No. 471: August Housing Starts, Existing Home Sales
COMMENTARY NUMBER 471
August Housing Starts, Existing Home Sales
September 19, 2012
__________
Official Recovery Remains an Illusion
Stagnant U.S. Economy Starts to Contract Anew
Housing Starts and Existing Home Sales Still Are Bottom-Bouncing
__________
PLEASE NOTE: The next regular Commentary is scheduled for Thursday, September 27th, covering the third revision to second-quarter 2012 GDP, and August new orders for durable goods and new home sales.
Best wishes to all — John Williams
Opening Comments and Executive Summary. Consistent with the weaker-than-expected reporting seen in August 2012 payrolls and industrial production, and with the topping seen in real (inflation-adjusted) retail sales, August housing starts rounded out the major monthly economic reporting with a continued 45-month pattern of bottom-bouncing at a low-level plateau of activity.
Official reporting of real gross domestic product (GDP) shows a fully recovered economy, with activity since fourth-quarter 2011 exceeding activity the preceded the official 2007 recession. Yet no other major economic series shows a pattern of full recovery. As discussed in Commentary No. 467, the official recovery remains an illusion created by the government’s use of understated inflation in preparing its inflation-adjusted economic series, such as GDP, where deflation using understated inflation results in the reporting of overstated real economic growth.
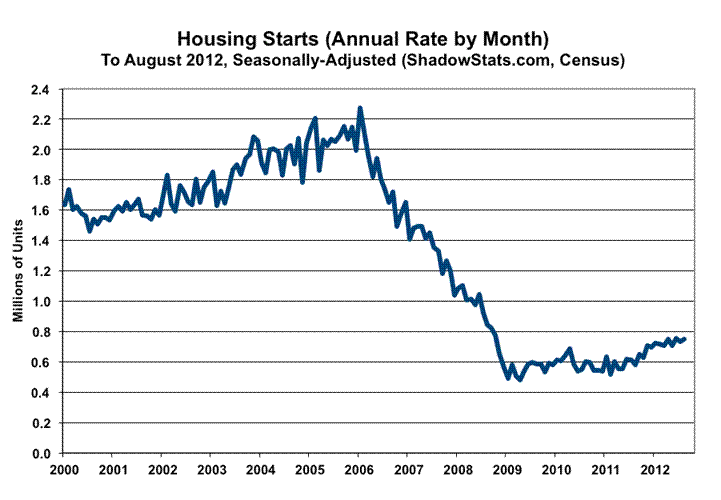
The U.S. economy began to turn down in 2006, as can be seen the following graph of official housing starts activity. The economy plunged into 2009 and has been stagnating ever since. Corrected for understated inflation used in official reporting (see Commentary No. 470), both the retail sales and industrial production series show somewhat similar patterns, but they appear to be turning down again.
The economic circumstance will be fully reviewed—along with the hyperinflation forecast—in the pending Special Commentary. A tentative publication date of that missive will be posted next week.
In terms of today’s (September 19th) housing-related releases, both the 2.3% gain reported in August housing starts, and the 7.8% gain in August existing home sales lacked reporting significance (see the Reporting Detail section for more comprehensive analysis and additional graphs).
Headline August housing starts gained 2.3% (an increase of 0.5% before prior-period revisions) for the month +/-11.9% (95% confidence level), which simply was not statistically meaningful. July starts were revised to a 2.8% (previously 1.1%) monthly decline.
The year-to-year change in August starts was a statistically-significant increase of 29.1%, following a revised 19.4% (previously 21.5%) gain in July. The annual growth was in the continued context of a protracted period of low-level bottom-bouncing.
Headline existing-home sales gained 7.8% for the month of August. Although reported activity was the highest since May of 2010, instabilities in seasonal factors and in underlying reporting suggest little significance, if any, for that monthly gain, at this time. The August increase followed an unrevised monthly gain of 2.8% in July sales.
August’s estimated growth seems to have been due largely to aberrant seasonal adjustments, with September 2012 reporting likely to offset much of the gain, as happened in a similar circumstance last year. On a year-to-year basis, August 2012 sales rose by 9.3%, versus an unrevised 10.4% annual gain for July 2012. Recent volatility in annual change here reflects partially the effects of lapsing housing stimulus efforts a year ago.
Hyperinflation Watch. The nature and implications of QE3—announced last week by the FOMC of the Federal Reserve Board—were discussed in the Opening Comments of Commentary No. 470. Specifically, while general circumstances have continued to advance towards the ultimate demise of the dollar, the general outlook is unchanged. While QE3 is an enabling action for the onset of massive inflation, the outside timing of 2014 for the ShadowStats.com hyperinflation forecast remains in place. The hyperinflation outlook will be reviewed and updated fully in a Special Commentary in the next couple of weeks. The following summary of the broad outlook is as revised in the September 14th Commentary.
The detail in Special Commentary No. 445 (June 12th) updated the hyperinflation outlook and the outlook for U.S. economic, U.S. dollar, and systemic-solvency conditions. That Special Commentary supplemented Hyperinflation 2012 (January 25th), which remains the primary missive detailing the hyperinflation story. Those reports are suggested as background reading for new subscribers.
Official GDP reporting shows plunging economic activity from fourth-quarter 2007 to second-quarter 2009, with an ensuing upturn in activity that has led to a full recovery as of fourth-quarter 2011, and that “recovery” has continued through second-quarter 2012 GDP reporting.
In contrast to the GDP reporting—and in line with patterns seen in better-quality economic series—I contend that the economy began turning down in 2006, plunging in 2008 into 2009 and subsequently stagnating—bottom-bouncing—at a low level of activity, ever since. There has been no recovery since mid-2009, and the economic downturn now is intensifying once again. The renewed slowdown is evident in the current reporting of nearly all major economic series. Not one of those series shows a pattern of activity that confirms the full recovery shown in the GDP series.
Federal Reserve Chairman Ben Bernanke has observed that broad aggregate measures of the U.S. economy, such as GDP, do not appear to be reflecting the common experience of the general public. Indeed, common experience suggests that the economy has not recovered. The official recovery simply is a statistical illusion created by the government’s use of understated inflation in deflating the GDP, which overstates deflated economic growth, as discussed in Commentary No. 467, Special Commentary No. 445, and Public Comment on Inflation.
The long-term fiscal solvency issues of the United States—where GAAP-based accounting shows annual deficits running in the $5 trillion range—are not being addressed, and the politicians currently running the government lack the political will to address those issues. That circumstance initially suggested a hyperinflation crisis by the end of this decade, but federal government and Federal Reserve actions—in response to the systemic-solvency crisis of 2008—accelerated the process, suggesting a hyperinflation problem by no later than the end of 2014. The continuing economic downturn is intensifying the fiscal- and systemic-solvency problems, and public awareness of this should grow rapidly in the months ahead.
Neither economic nor systemic-solvency issues have been resolved by U.S. government or Federal Reserve actions, and the most recent readings on income variance suggest that the worst is yet to be seen, as discussed in Commentary No. 469.
With the economy weak enough to provide political cover for further Federal Reserve accommodation to the still-struggling banking system, QE3 was introduced on September 13th. That action effectively provided for open-ended monetization of U.S. Treasury debt at the Fed’s discretion. The mechanism for eventual full debasement of the dollar now is in place, and it likely will come into full play, as needed to support the banking system and as needed to assure “successful” auctions of Treasury debt.
QE3 likely will lead to a massive dollar-selling crisis, and that will begin the process of a rapid upturn in domestic consumer inflation. A near-term dollar-selling crisis is now of a much greater risk, post-QE3. Separately, though, a dollar-selling crisis could begin at any time, triggered by various economic, sovereign-solvency or political issues. With the guidelines set for QE3, even negative employment reports could trigger massive dollar selling.
__________
REPORTING DETAIL
RESIDENTIAL CONSTRUCTION (August 2012)
No Change in Pattern of Stagnant Housing Starts Activity. Some minor upside bottom-bouncing was seen with August 2012 housing starts reporting, with the minimal upside August change of 2.3% being estimated relative to a downside revision in initial July reporting. As with the initial July reporting, the August 2012 activity level remained 67% below the January 2006 series high. This series remains particularly volatile and tends to suffer large monthly revisions.
Protracted stagnation in housing starts at historically-low levels of activity has continued well into its fourth year of activity, averaging 73% below 2006’s record-high construction level. Still within the normal scope of volatility for the series in the last four years, a slightly higher plateau of activity appears to have developed in the ten months through August that is 68% below the 2006 high. Given the underlying economic fundamentals, there is no recovery or relief in sight (see Special Report No. 445).
August 2012 Reporting. The Census Bureau reported today (September 19th) a statistically-insignificant month-to-month headline gain in seasonally-adjusted August 2012 housing starts of 2.3% (an increase of 0.5% before prior-period revisions) +/-11.9% (all confidence intervals are at the 95% level). The monthly change in July starts was revised to a 2.8% contraction from initial reporting of a 1.1% decline.
Activity in starts for apartment buildings remained volatile, yet it also was no more than statistical noise, month-to-month, declining by a statistically-insignificant 2.8% +/- 34.5%, after a revised 0.5% decline in July, which previously had been a 9.6% gain. The “one-unit” category for August showed a statistically-insignificant 5.5% gain +/- 12.2%, after a revised 4.5% (previously 6.5%) insignificant decline in July.
The year-to-year change in aggregate August 2012 housing starts was a statistically-significant increase of 29.1% +/- 15.0%, following a revised 19.4% (previously 21.5%) annual gain in July, but, again, that remains in the continued context of a protracted period of low-level bottom-bouncing.
For the last 45 months, the pattern of housing starts generally has remained one of stagnation at an historically low-level plateau of activity. Since December 2008, housing starts have averaged a seasonally-adjusted annual rate of 609,000. In that period, monthly readings have been within the normal range of monthly variability for the aggregate series, around that average, with the 750,000 annual starts rate for August 2012 at the upper end of that range. Nonetheless activity appears to have moved to a somewhat higher plateau since November 2011, with the average of the annualized monthly housing starts at 724,000 for the ten months through August 2012.
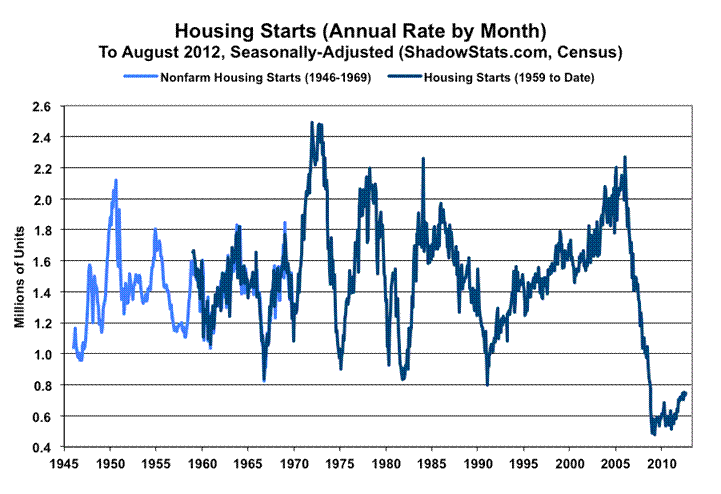
As shown in the graph in the Opening Comments and Executive Summary, current monthly housing starts activity remains off the record monthly low seen for the present series in April 2009. Recent series detail is seen more easily in that graph, which covers reporting since 2000. The preceding graph shows that current activity remains below any level reported prior to the 2006 peak in the current series, or in the predecessor nonfarm housing starts series, which was introduced in 1946.
EXISTING HOME SALES (August 2012)
August Existing-Home Sales Jumped Sharply, But Likely Not Meaningfully, for this Highly Volatile and Unstable Series. As has been noted regularly in the monthly Commentaries covering the existing-home sales series—despite recent massive corrections and revisions to the series—reporting remains subject to significant seasonal-factor instabilities, as also has been seen in a number of government series. Those seasonal-factor distortions are a result of the severe depth and length of the economic contraction, a circumstance that post-World War II (or modern) economic reporting never was designed to handle.
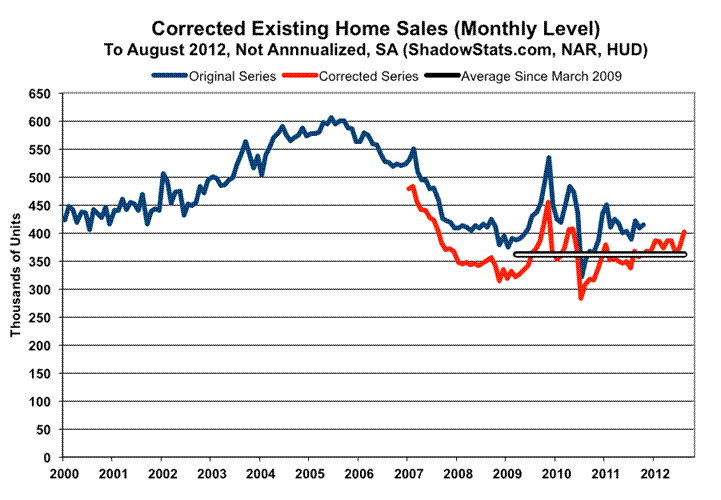
Further, as shown in the accompanying graph, the old (pre-November 2011) and corrected series do not appear to be consistent or comparable, effectively a discontinuity in the series. Seasonal-factor distortions have been skewed, not only by protracted, collapsing activity, but also by the impact of various stimulus/ tax-incentive packages, which pulled some future sales activity into the periods of the incentives. With the sales swings generated by the stimulus packages, and lapsing of same, averaged out—as shown in the graph—the pattern of activity resembles the bottom-bouncing seen otherwise in the new-home sales (through July 2012) and in housing-starts activity discussed in the prior section, although the peak-to-trough contraction never was a severe as that seen in the sales tied to new construction.
For those interested in the latest detail, however, we continue to look at the regular reporting of the new existing-home sales series, although a heavy caution is offered on the quality of what is being published.
August 2012 Reporting. Today’s (September 19th) release of August 2012 existing-home sales (counted based on actual closings, National Association of Realtors [NAR]) showed a seasonally-adjusted monthly gain of 7.8%. That reflected a monthly pace of 401.7 thousand homes sold, which was the best showing for the series since May of 2010. That said, given the previously-discussed instabilities in seasonal factors and in underlying reporting, there is little significance, if any, that can be attributed to the headline monthly number for August, at this time.
The August 2012 headline gain seems to be due largely to aberrant seasonal adjustments, with September 2012 reporting likely to offset much of the August 2012 gain, as September 2011 did in a similar circumstance last year.
That said, the August 2012 jump in sales followed an unrevised monthly gain of 2.8% in July sales.
On a year-to-year basis, August 2012 sales rose by 9.3%, versus an unrevised 10.4% gain July. Recent volatility in annual change reflects partially the effects of lapsing housing stimulus efforts a year ago.
Distressed properties remained a significant portion of existing home sales activity. The NAR estimated August’s “distressed” sales at 22% (12% foreclosures, 10% short sales), versus July’s 24% (12% foreclosures, 12% short sales).
The existing home sales price data (as with the government’s estimates of home sales price data) tend to be of extremely limited usefulness, since they usually reflect shifting patterns of home buying between differently-priced segments more than they do truly comparative prices. That said, both median and mean home sales prices in August 2012 (not seasonally-adjusted) were reported down month-to-month, but up year-to-year.
Week Ahead. Market recognition of an intensifying double-dip recession has taken stronger hold, at the moment, while recognition of a mounting inflation threat has been rekindled a bit by recent Fed monetary policy announcements and rising headline inflation numbers. The political system would like to see the issues disappear until after the election; the media does its best to avoid publicizing unhappy economic news or, otherwise, it puts a happy spin on the numbers; and the financial markets do their best to avoid recognition of the problems for as long as possible, problems that have horrendous implications for the markets and for systemic stability, as discussed in the Hyperinflation Watch section.
Until such time as financial-market expectations catch up fully with underlying reality, or underlying reality catches up with the markets, reporting generally will continue to show higher-than-expected inflation and weaker-than-expected economic results in the months and year ahead. Increasingly, previously unreported economic weakness should continue to show up in prior-period revisions.
New Home Sales (August 2012). The August 2012 new home sales release from the Census Bureau is scheduled for Wednesday, September 26th. As with today’s (September 19th) release of August housing starts, entrenched patterns of stagnation likely have continued, and the new monthly results are not likely to be statistically-significant.
New Orders for Durables Goods (August 2012). The initial estimate for August 2012 new orders for durable goods is scheduled for release on Thursday, September 27th, by the Commerce Department. As has been the case for months, whatever month-to-month change is reported for this regularly volatile series, it likely will not be meaningful, remaining well within the bounds of regular monthly volatility and subject to the irregular order activity in nondefense aircraft orders.
In terms of the potential inflation contribution to new orders growth, the seasonally-adjusted, month-to-month change in the August PPI finished goods capital equipment index was an increase of 0.18%, with year-to-year unadjusted inflation at 2.00%. Due to hedonic quality adjustments to this portion of the PPI series, however, as with the GDP numbers, those inflation data understate inflation reality and correspondingly overstate inflation-adjusted growth.
Gross Domestic Product—GDP (Second-Quarter, Third Estimate, Second Revision). The second revision to second-quarter 2012 GDP is due for release on Thursday, September 27th. It is unlikely that changes to the second-quarter GDP estimate will be anything more than statistical noise.
In any event, the revised numbers will remain statistically insignificant, and the series will remain the most worthless, the most heavily politicized and the most misleading of any major government economic statistical release, as discussed in Commentary No. 467, which followed the first revision.
__________