No. 593: December Industrial Production and Housing Starts
COMMENTARY NUMBER 593
December Industrial Production and Housing Starts
January 17, 2014
__________
Production Gain Indicated Intensifying Inventory Problem
December Housing Starts Pulled Back from November Nonsense;
Minimal Year-to-Year Growth of 1.6% Was Statistically Insignificant
__________
PLEASE NOTE: The next regular Commentary is scheduled for Thursday, January 23rd, covering December existing home sales and topical issues.
Best wishes to all — John Williams
OPENING COMMENTS AND EXECUTIVE SUMMARY
Economic Review—Watch Out for a GDP Contraction in First-Quarter 2014! With many of the widely-followed economic and inflation indicators having been reported for December 2013, economic activity generally slowed in the month, with the pace of inflation picking up. Those trends should accelerate in first-quarter 2014, with economic activity falling off quite sharply, but with inflation not rising too rapidly, until after significant selling of the U.S. dollar has been seen.
Reported growth, in major components of fourth-quarter 2013 economic activity, generally has been stronger than was seen in the third-quarter. Those quarterly gains, however, reflected more the surveying, data-gathering and reporting-quality issues surrounding the government shutdown, than they did any actual shift in underlying economic activity. With a reporting catch up of slower activity having started in December 2013, first-quarter 2014 GDP becomes the primary candidate for the first formal quarterly GDP contraction of what likely will be viewed as a new, or double-dip recession.
As to the underlying basics, structural problems with consumer liquidity continue to inhibit consumer spending activity. The consumer remains unable to generate or to drive positive, broad economic growth. There has been no economic recovery and there is none pending. (Respective Commentary numbers here are indicated in italics. See No. 590 for liquidity indicators, No. 592 for real earnings and for indications of a sharp decline in real year-to-year growth in M3. Broad employment and unemployment conditions also continued to deteriorate in December, as discussed in No. 589.)
Consumer liquidity problems flowed through to an outright contraction in real (inflation-adjusted) retail sales for December (No. 590 and No. 592). Rising consumer (No. 592) and wholesale (No. 591) inflation also were seen.
Getting to the December 2013 housing starts and industrial production covered in today’s (January 17th) Commentary, housing starts reflected some minor catch up from the extreme overstatement of growth in November, but the series still is distorted meaningfully and subject to major revisions in the months ahead. Industrial production has its separate issues, but the December 2013 detail suggested a mounting inventory problem that would favor a first-quarter 2014 GDP contraction.
Buildup in Excess Inventories Foreshadows Production Cutback. To the extent there is any meaning to reporting detail in the monthly retail sales and industrial production estimates, there is an intensifying build-up in excess, unwanted inventories. Seasonally-adjusted motor vehicle sales declined by 1.9% (both before and after inflation adjustment) in December 2013 retail sales, while seasonally-adjusted automotive production rose by 1.8% for the month. In theory, the difference went into inventories. When inventories are excessive and unwanted, as they have been in recent quarters, usually they are brought back into line with economic reality through a reduction in production. In turn, that circumstance commonly has been a direct trigger for quarterly GDP contractions.
Further detail on all of the series discussed above can be found on the site of ShadowStats affiliate: www.ExpliStats.com.
December 2013 Industrial Production—Slowing Growth in Manufacturing. Headline industrial production rose by 0.3% in December, with November growth revising lower, by a notch, to 1.0%. The slower growth indeed reflected slowing activity in the more-meaningful manufacturing and mining measures, but changes in the aberrant utility number continued to gyrate wildly, due to the Federal Reserve’s inability to adjust for the impact of unseasonable weather.
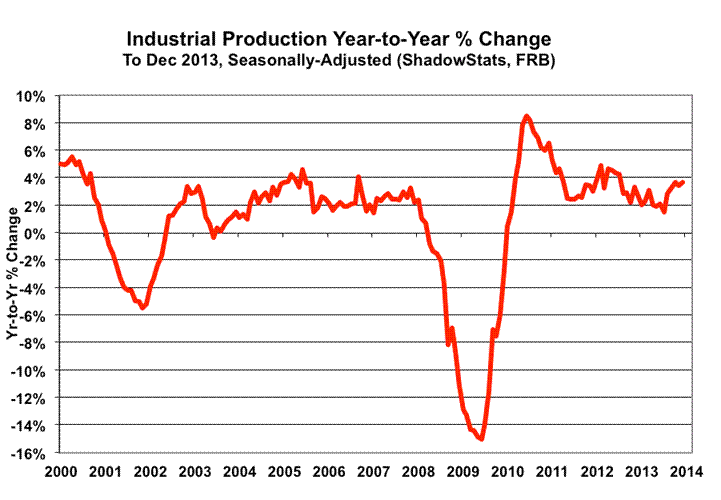
Where headline monthly growth in the dominant manufacturing component of production slowed from 0.6% in November to 0.4% in December, and mining output (including oil and gas) slowed from 1.9% to 0.8%, unstable utility usage went from a 3.0% increase to a 1.4% decline, due to irregular weather patterns, instead of to shifting economic activity. The unstable 7.6% annual jump in utility usage also largely was behind the increase in aggregate annual production growth to 3.7%, where year-to-year growth in manufacturing is at 2.6%, a level commonly seen in the early stages of a recession. This is despite the contribution of the stronger mining sector with 6.6% annual growth.
Irrespective of the modest slowing in December’s headline, monthly manufacturing growth, a continuing rapid build-up in unwanted, excess inventories provides a signal for a looming downside shift in manufacturing activity, as needed to redress the inventory issue (see the prior Economic Review section). The economy remains on the brink of falling into what formally should be recognized as renewed recession. Weaker data—revised and otherwise—remain likely in the months ahead, and in the upcoming annual benchmark revision to industrial production scheduled for the end of March 2014.
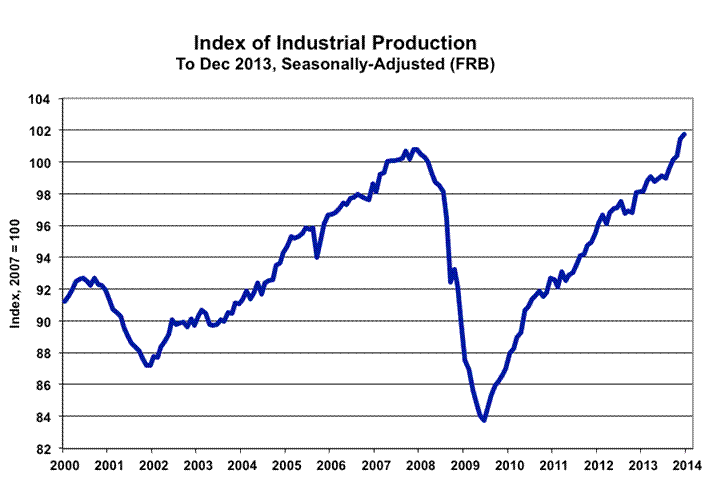
New High for the Production Series, But Still Inconsistent With the GDP. Headline December 2013 reporting, however, took the industrial production index to a new high, where the index level had broken above its pre-recession peak activity of February 2008, for the first time, last month. This “recovery” is not real, as discussed in the Corrected Industrial Production section that follows. The use of understated inflation in deflating certain components compiled in the production index has resulted in overstated headline production growth. As shown in the “corrected” graph, production remains well shy of an economic recovery.
Additionally, industrial production widely is recognized as a coincident indicator of GDP activity. It is used, for example, by the recession-defining authority—the National Bureau of Economic Research (NBER)—for timing the onsets of recessions. What is unusual here is that the headline GDP purportedly has been fully recovered, in economic expansion, since second-quarter 2011. If the GDP data and the production numbers were of consistent good quality, the two series would be moving together, rather than the production numbers lagging GDP reporting by eleven quarters. As discussed frequently, and as covered in Commentary No. 585 and here, there are serious reporting flaws with both series, particularly the GDP.
Industrial Production—December 2013. In the context of upside revisions to September through November 2013, headline monthly December industrial production rose by 0.3% (up by 0.31% at the second decimal point) and was up by 0.47% for the month, net of prior-period revisions. November was revised to a gain of 1.04%, with October showing a revised gain of 0.28%.
Year-to-year growth in December 2013 production increased to 3.68%, versus a revised 3.40% in November and a revised 3.68% in October. Allowing for series volatility and special factors tied to weather-related utility distortions, annual growth still has slowed to levels last seen during the mid-2008 economic collapse and remains consistent with annual growth patterns usually seen going into recession.
Industrial Production Graphs. The regular graphs of the headline level of industrial production, and year-to-year changes in production, are found in the Reporting Detail section. The graphs in this section also show the official level of production activity (first graph), as well as the official data, net of inflation distortions, as corrected by ShadowStats (second graph).
Corrected Industrial Production. Hedonic quality adjustments to inflation, understate the inflation used in calculating some components of industrial production, with the effect of overstating the inflation-adjusted growth in the headline industrial production series (see Special Commentary: No. 485 and Public Comment on Inflation).

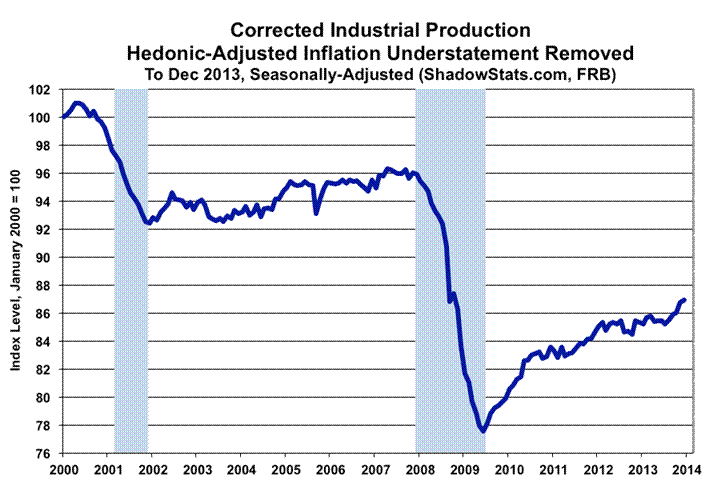
The two preceding graphs address that issue. The first reflects official industrial production reporting, indexed to January 2000 = 100, instead of the Fed’s index that is set at 2007 = 100. The 2000 indexing is used simply to provide for some consistency in this series of revamped graphics; it does not affect the appearance of the graph. The second graph is a corrected version of the first, with estimated hedonic-inflation adjustments backed-out of the official industrial-production deflator.
The “corrected” graph does show some growth in the period following the official June 2009 near-term trough in production activity. Yet, that upturn has been far shy of the full recovery and the renewed expansion reported in official GDP estimation. Where the headline production series recovered its pre-recession high (first graph) in November 2013, with further upside movement in December, the corrected production levels have not. Instead, corrected production entered a period of protracted low-level stagnation in 2012, with quarterly contractions in third-quarter 2012, second-quarter 2013, with stagnation in third-quarter 2013, and some upturn in the fourth-quarter 2013 (second graph).
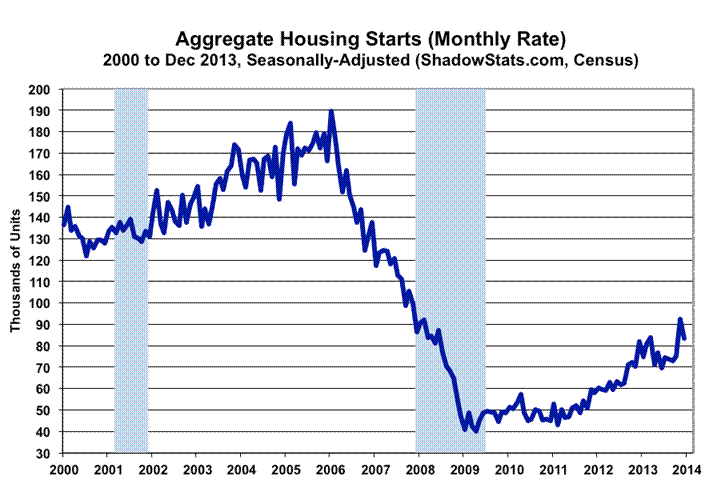
December 2013 Housing Starts—Minimal Pullback from Heavily-Inflated November Reporting. December 2013 reporting of housing-starts activity was not statistically significant, either in terms of a month-to-month drop or minimal year-to-year gain. Nonetheless, the aggregate housing starts, as well as the single- and multiple-unit categories, showed large retrenchments from the heavily distorted and still-unbelievable spikes in November activity, which likely resulted more from surveying, data gathering and reporting problems tied to the government shutdown, than from a sudden surge in housing activity (see Commentary No. 584). The latest detail is reflected in the accompanying graph.
As discussed in Commentary No. 590, there has been no change in the underlying consumer-liquidity fundamentals. There is nothing that would support a sustainable turnaround in housing or general economic activity. There never was a broad economic recovery, and there is no recovery underway, just general bottom-bouncing that broadly is turning down anew.
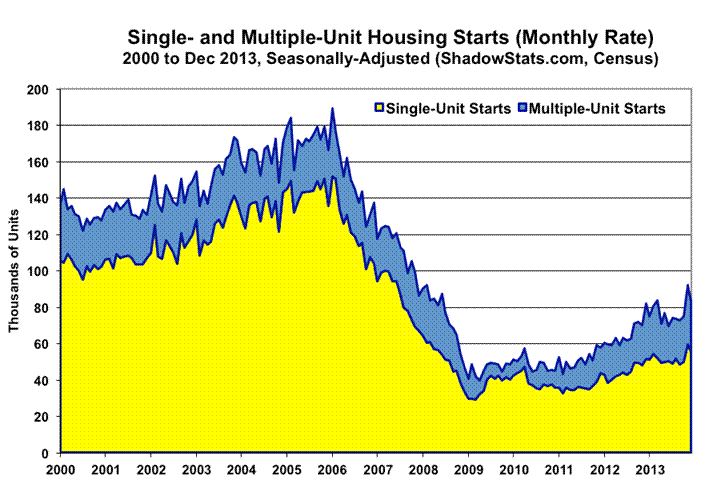
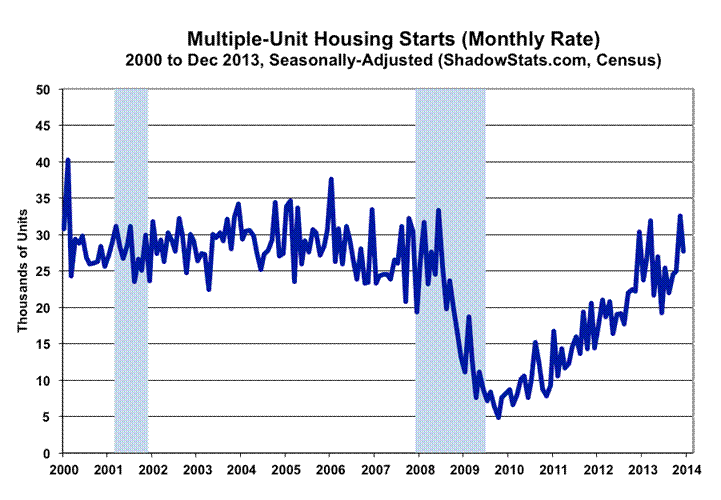
Where the irregular housing starts series tends to show varying patterns, that partially is due to a reporting mix of residential construction products, with one-unit housing starts that generally are for individual consumption, resulting in new home sales, versus multi-unit starts that generally reflect the building of rental and apartment units.
December 2013 Housing-Starts Reporting. The headline month-to-month decline in seasonally-adjusted December 2013 housing starts was 9.8% +/-12.5% (all confidence intervals are at the 95% level); the decline was 8.4% before prior-period revisions. November’s inflated surge—again likely warped by government-shutdown effects—actually revised higher to 23.1% (previously 22.7%), with October also showing an upwardly revised monthly gain of 3.0% (previously an increase of 1.8%).
Year-to-year growth in the seasonally-adjusted, December 2013 total measure of housing-starts was a statistically-insignificant increase of 1.6% +/- 13.9%, versus a revised annual gain in November of 31.5% (previously 29.6%), and a revised October annual gain of 4.1% (previously 2.9%).
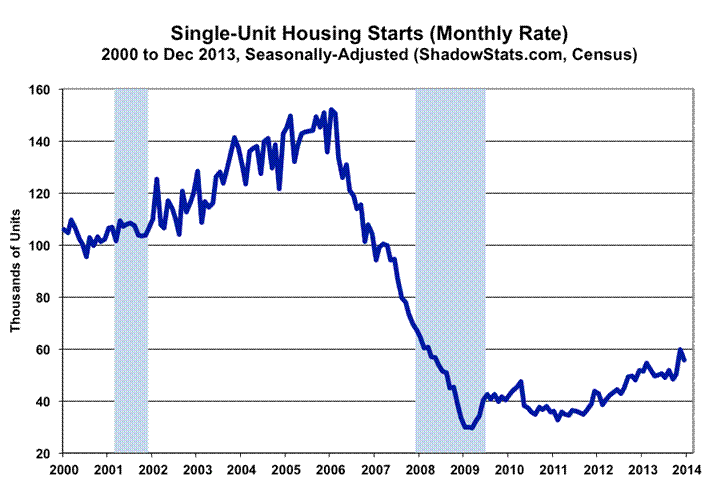
By Unit Category. Housing starts for single-unit structures in December fell by a statistically-insignificant 7.0% +/- 10.4% for the month, versus a downwardly revised 19.5% (previously 20.8%) gain in November (see accompanying graphs). December’s annual gain of 7.6% +/- 14.0% also was statistically-insignificant, with November’s year-to-year increase revising to 24.5% (previously 26.2%).
Reporting of housing starts activity for apartment buildings (generally 5 units or more) remained highly unstable, with a statistically-insignificant December month-to-month plunge of 17.9% +/- 30.0%. November’s headline number, however, revised to a 31.5% monthly gain (previously up by 26.0%), as reflected in the accompanying graphs. December’s year-to-year contraction of 9.6% +/- 30.5% also was not statistically significant, while November’s annual gain was a revised 48.4% (previously 38.3%).
Expanding the multi-unit housing starts category to include “2 to 4 units” plus “5 units or more,” usually reflects the bulk of rental- and apartment-unit activity. The Census Bureau does not publish estimates of the “2 to 4 units” category, due to statistical-significance problems (a general issue for the aggregate series). Nonetheless, the total multi-unit category can be calculated by subtracting the single-unit category from the total category. Accordingly, the aggregate, statistically-insignificant December monthly decline of 9.8% was composed of an insignificant 7.0% monthly drop in one-unit housing starts, combined with an insignificant 14.9% monthly drop in starts of multiple-unit structures (2 units or more, including the 5 units or more category). The graphs that follow reflect that detail.
Graphs of Housing Starts Activity. The record monthly low seen for the present aggregate series was in April 2009, which was down 79% from the January 2006 peak. Against the downside-spiked low in April 2009, the December 2013 headline number was up by 109%, but it still was down by 56% from the January 2006 series high. That detail is reflected in the graphs of this section, as well as in those of the Reporting Detail section.
Where the official reporting of housing starts is expressed at an annualized monthly pace of starts, which was 999,000 in December 2013, versus a revised 1,107,000 in November, the graphs on that basis are plotted in the Reporting Detail section.
Due to the regular, extreme volatility in the monthly series, though, it is more meaningful to look at the non-annualized monthly number by month. In terms of estimated, actual seasonally-adjusted monthly activity, housing starts were 83.3 thousand in December 2013, versus 92.3 thousand in November. The graphed patterns of relative activity are exactly the same; it is just that the monthly levels tend to be more representative of actual activity. Accordingly, the accompanying graphs in this section reflect the seasonally-adjusted monthly rates of activity, not the annualized numbers, which, again, are used in the graphs of the Reporting Detail section.
These graphs breakout the component reporting between one-unit and multiple-unit housing starts. The Census Bureau breaks its headline data into three categories beyond “total.” Those structure definitions are “1 unit,” “2 to 4 units,” and “5 units or more.” Due to lack of “meeting reliability standards,” Census does not publish the actual numbers for the “2 to 4 units,” although the numbers can be imputed. Accordingly, ShadowStats breaks the data into two sub-categories: “single-unit” and “multiple-unit” starts, where the multiple-unit category simply is the total unit count, minus the single-unit count.
Aside from the November 2013 surge and December pullback, activity in single-unit starts generally had remained stagnant in the post-housing-crash environment, and, after a slight uptrend, had moved lower. Multiple-unit starts activity has remained highly unstable and irregular. Though trending higher into first-quarter 2013, activity in this series also appeared to have shifted anew, to the downside, except for the November surge and December pullback.
[For greater detail on the December industrial production and housing starts,
see the Reporting Detail section.]
__________
HYPERINFLATION WATCH
Hyperinflation Outlook. With the First Installment of Hyperinflation 2014—The End Game Begins published on January 7th, a new Hyperinflation Summary for this section will be added shortly. The publication date also will be advised shortly for the Second Installment, which covers historical and prospective economic activity, as well as possible protective and preventative actions and reactions at both a personal and federal level versus the unfolding circumstance.
__________
REPORTING DETAIL
INDEX OF INDUSTRIAL PRODUCTION (December 2013)
December Production Growth Suggested Continued Excess-Inventory Buildup. To the extent there is any meaning to reporting detail in the monthly retail sales and industrial production estimates, there is an intensifying problem with a build-up of unwanted, excess inventories. Seasonally-adjusted motor-vehicle retail sales declined by 1.9% (both before and after inflation adjustment) in December 2013, while seasonally-adjusted automotive production rose by 1.8% for the month. In theory, the difference goes into inventories. When the inventories are excessive, as they have been in recent quarters, usually they are brought back into line with economic reality by a reduction in production. In turn, that circumstance commonly has been a direct trigger for quarterly GDP contractions.
Monthly December Production Growth Slowed Sharply, But Year-to-Year Growth Increased. Headline industrial production rose by 0.3% in December, with November growth revising lower, by a notch, to 1.0%. The slower growth indeed reflected slowing activity in the more-meaningful manufacturing and mining measures, but the aberrant utility number continued to gyrate wildly due to the Federal Reserve’s inability to adjust for the impact of unseasonable weather. Where headline monthly growth in the dominant manufacturing component of production slowed from 0.6% in November, to 0.4% in December, and mining output (including oil and gas) slowed from 1.9% to 0.8%, unstable utility usage went from a 3.0% increase to a 1.4% decline, due to irregular weather patterns instead of shifting economic activity. The unstable 7.6% annual jump in utility usage also largely is behind the increase in aggregate annual production growth to 3.7%, where year-to-year growth in manufacturing is at 2.6%, a level commonly seen in the early stages of a recession, and despite the contribution of the stronger mining sector, with 6.6% annual growth.
Irrespective of the modest slowing in the headline monthly manufacturing growth, the still-expanding inventory issue provides a signal for a looming downside shift in manufacturing activity, as needed to redress an excess-inventory issue. The economy remains on the brink of falling into what formally should be recognized as renewed recession. Weaker data—revised and otherwise—remain likely in the months ahead, and in the upcoming annual benchmark revision scheduled for the end of March 2014.
New High for the Series. Nonetheless, headline December 2013 reporting took the industrial production index to a new high, where the index level had broken above its pre-recession peak activity of February 2008, for the first time, last month. This “recovery” is not real, as discussed in the Opening Comments section. The use of understated inflation in deflating certain components of the production index has resulted in overstated headline production growth. As shown in the “corrected” graph in that section, production remains well shy of an economic recovery.
Inconsistent Reporting with GDP. Further, industrial production widely is recognized as a coincident indicator of GDP activity. It is used, for example, by the recession-defining authority the National Bureau of Economic Research (NBER), for timing the onsets of recessions. What is unusual here is that the headline GDP purportedly has been fully recovered, in economic expansion, since second-quarter 2011. If the GDP data and the production numbers were of consistent good quality, the series would be moving together, rather than the production numbers lagging GDP reporting by eleven quarters. As has been discussed frequently, and as was covered in Commentary No. 585 and in the Opening Comments, there are serious reporting flaws with both series, particularly the GDP.
Industrial Production—December 2013. The Federal Reserve Board released its estimate of seasonally-adjusted, December 2013 industrial production this morning, January 17th. In the context of upside revisions to September through November, headline monthly December production rose by 0.3% (up by 0.31% at the second decimal point) and was up by 0.47% for the month, net of prior-period revisions. November was revised to a gain of 1.04% (previously 1.13%), with October revised to a gain of 0.28% (previously a 0.10% gain, initially a 0.14% contraction).
Year-to-year growth in December 2013 production increased to 3.68%, versus a revised 3.40% (previously 3.23%) in November and a revised 3.68% (previously 3.42%, initially 3.24%) in October. Allowing for series volatility and special factors tied to weather-related utility distortions, annual growth still has slowed to levels last seen during the mid-2008 economic collapse, and it remains consistent with annual growth patterns usually seen going into recession.
Further detail on the official production numbers may be found on the site of ShadowStats affiliate www.ExpliStats.com.
Production Graphs. The “recovery” in industrial production is reflected in the following two sets of graphs. The first graph in the first set shows the monthly level of the production index, while the second graph shows the year-to-year or annual percentage change in the same series for recent historical detail, beginning January 2000.
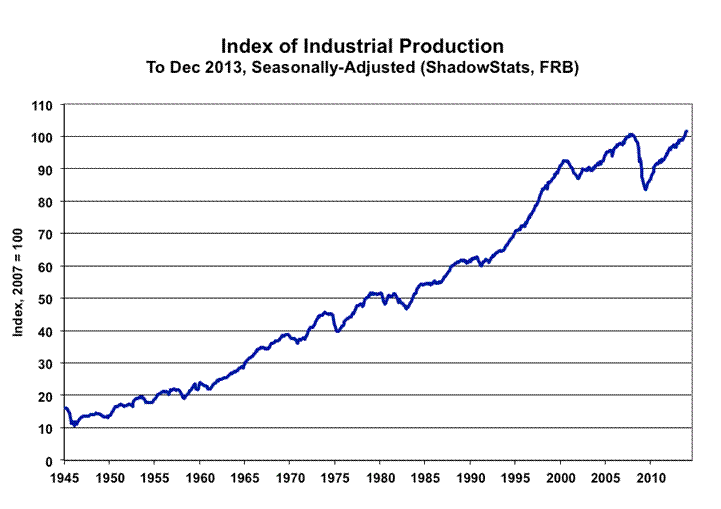
The second set of graphs shows the same data in historical context since World War II.
As shown more clearly in the first set of graphs, current year-to-year activity recently dipped lower, with annual growth close to levels last seen in a slowing-growth pattern in the first two quarters of the formal 2007 recession. The higher annual growth seen in the last several months should revert back to the earlier patterns as excess inventories are worked off. Annual growth remains well off the recent relative peak for the series, which was 8.50% in June 2010, going against the official June 2009 trough of the economic collapse. Indeed, as shown in the second set of graphs, the year-to-year contraction of 15.02% in June 2009, at the end of second-quarter 2009, was the steepest annual decline in production since the shutdown of war-time production following World War II.
Although official production levels have moved higher since the June 2009 trough, the headline series first broke above its pre-recession high only with the November 2013 reporting.
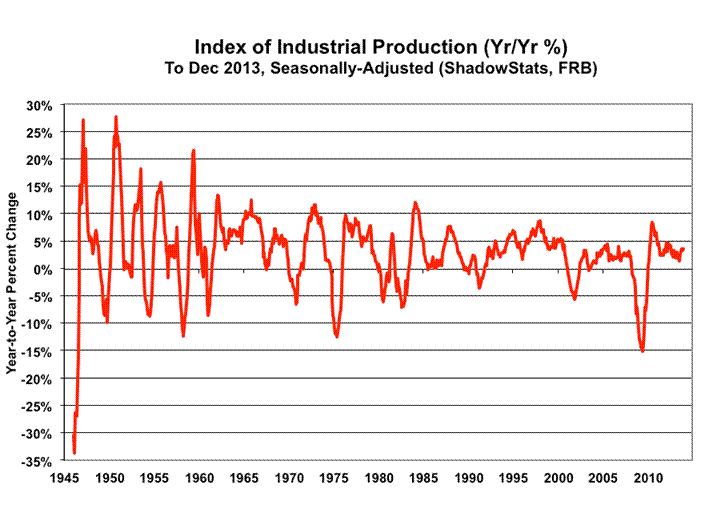
Corrected for the understatement of inflation used in deflating portions of the industrial production index, the series has shown more of a pattern of stagnation with a slow upside trend, since 2009, topping out into 2012, with a renewed slight upturn into a recent, protracted period of inventory build-up. The corrected production series is discussed and graphed in the Opening Comments. Please note also that the index base for those graphs showing production levels, both the corrected graph and the accompanying graph based on official reporting, is January 2000 = 100, instead of the Federal Reserve’s official 2007 = 100, used in the graphs here.
RESIDENTIAL CONSTRUCTION (December 2013)
Housing Starts Fall Back, Correcting Minimally from Shutdown Distortions. December 2013 reporting of housing starts activity was not statistically significant, either in terms of month-to-month or year-to-year change. Nonetheless, aggregate housing starts, as well as single- and multiple-unit categories showed large pullbacks from the heavily distorted and still-unbelievable spikes in November activity, which likely resulted more from surveying, data gathering and reporting problems tied to the government shutdown, than from a sudden surge in housing activity (see Commentary No. 584).
As discussed in Commentary No. 590, there has been no change in the underlying consumer-liquidity fundamentals. There is nothing that would support a sustainable turnaround in housing or general economic activity. There never was a broad economic recovery, and there is no recovery underway, just general bottom-bouncing that broadly is turning down anew.
Where the irregular housing starts series tends to show varying patterns, that partially is due to a reporting mix of residential construction products, with one-unit housing starts that generally are for individual consumption, resulting in new home sales, versus multi-unit starts that generally reflect the building of rental and apartment units.
December 2013 Housing-Starts Reporting. The Census Bureau reported today, January 17th, a statistically-insignificant, month-to-month headline decline in seasonally-adjusted December 2013 housing starts of 9.8% +/-12.5% (all confidence intervals are at the 95% level); the monthly decline was 8.4% before prior-period revisions. November’s nonsensical monthly gain, likely warped by government-shutdown effects, revised higher to 23.1% (previously 22.7%), with October showing a revised monthly gain of 3.0% (previously an increase of 1.8%).
Year-to-year growth in the seasonally-adjusted, aggregate December 2013 housing-starts measure was a statistically-insignificant increase of 1.6% +/- 13.9%, versus a revised annual gain in November of 31.5% (previously 29.6%), and a revised October annual gain of 4.1% (previously 2.9%).
By Unit Category. Housing starts for single-unit structures in December fell by a statistically-insignificant 7.0% +/- 10.4% for the month, versus a downwardly revised 19.5% (previously 20.8%) gain in November (see graphs in the Opening Comments section). December’s annual gain of 7.6% +/- 14.0% also was statistically-insignificant, with November’s year-to-year increase revising to 24.5% (previously 26.2%).
Reporting of housing starts activity for apartment buildings (generally 5 units or more) remained highly unstable, with a statistically-insignificant December month-to-month plunge of 17.9% +/- 30.0%. November’s headline number, however, revised to a 31.5% monthly gain (previously up by 26.0%), as reflected in the graphs in the Opening Comments section. December’s year-to-year contraction of 9.6% +/- 30.5% also was not statistically significant, while November’s annual gain was a revised 48.4% (previously 38.3%).
Expanding the multi-unit housing starts category to include “2 to 4 units” plus “5 units or more,” usually reflects the bulk of rental- and apartment-unit activity. The Census Bureau does not publish estimates of the “2 to 4 units” category, due to statistical significance problems (a general issue for the aggregate series). Nonetheless, the total multi-unit category can be calculated by subtracting the single-unit category from the total category. Accordingly, the aggregate, statistically-insignificant December monthly decline of 9.8% was composed of an insignificant 7.0% monthly drop in one-unit housing starts, combined with an insignificant 14.9% monthly drop in starts of multiple-unit structures (2 units or more, including the 5 units or more category).
Further detail on the official residential construction numbers may be found on the site of ShadowStats affiliate www.ExpliStats.com.
Graphs of Aggregate Housing Starts Activity. The record monthly low seen for the present aggregate series was in April 2009, which was down 79% from the January 2006 peak. Against the downside-spiked low in April 2009, the December 2013 headline number was up by 109%, but it still was down by 56% from the January 2006 series high.
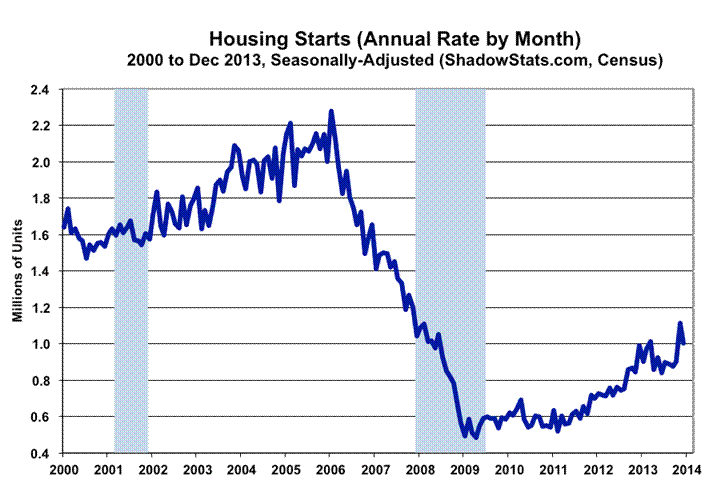

The official reporting of housing starts is expressed at an annualized monthly pace of starts, which was 999,000 in December 2013 and a revised 1,107,000 in November. These details are reflected in the accompanying graphs. Where monthly activity more realistically is reflected in the actual monthly rate, 83,250 in December, versus the annualized 999,000, the monthly rate is used in the scales of the graphs in the Opening Comments section. With either scale, the appearance of the graph is the same.
__________
WEEK AHEAD
Weaker-Economic and Stronger-Inflation Reporting Likely in the Months and Year Ahead. At the moment, markets generally appear to still be overly optimistic as to the economic outlook, based on data that likely were puffed-up in the process of going through the data-gathering and reporting distortions of the October shutdown to the federal government. Although expectations should soften anew, quickly, there remains the potential for unusual, irregular and eventually corrective reporting and revisions in the months ahead.
That circumstance, and underlying fundamentals that remain highly suggestive of deteriorating business activity, mean that weaker-than-consensus economic reporting should become the general trend.
Stronger inflation reporting remains likely. Upside pressure on oil-related prices should reflect intensifying impact from a weakening U.S. dollar in the currency markets, and from ongoing political instabilities in the Middle East. The dollar faces pummeling from continuing QE3, the ongoing U.S. fiscal-crisis debacle, a weakening U.S. economy and deteriorating U.S. political conditions (see Hyperinflation 2014—The End Game Begins). Particularly in tandem with a weakened dollar, reporting in the year ahead generally should reflect much higher-than-expected inflation.
A Note on Reporting Quality Issues and Systemic Reporting Biases. Significant reporting-quality problems remain with most major economic series. Headline reporting issues are tied largely to systemic distortions of seasonal adjustments. The data instabilities were induced by the still-ongoing economic turmoil of the last seven-to-eight years, which has been without precedent in the post-World War II era of modern economic reporting. These impaired reporting methodologies provide particularly unstable headline economic results, where concurrent seasonal adjustments are used (as with retail sales, durable goods orders, employment and unemployment data), and they have thrown into question the statistical-significance of the headline month-to-month reporting for many popular economic series.
PENDING RELEASES:
Existing-Home Sales (December 2013). December 2013 existing-home sales are scheduled for release on Thursday, January 23rd, by the National Association of Realtors. The developing circumstance for this highly volatile and unstable series is an entrenched pattern of weakening stagnation. That likely has continued, with the report of monthly change in existing-home sales activity not likely to be meaningful, in either direction, particularly in the context of the prior-month’s revision.
As discussed in Commentary No. 590, there has been no change in the underlying consumer-liquidity fundamentals. There is nothing that would support a sustainable turnaround housing or general economic activity. There never was a broad economic recovery, and there is no recovery underway, just general bottom-bouncing that is turning down anew.
This series increasingly should continue to show a relationship parallel with the broad stagnation seen in recent years for single-unit housing starts, government-shutdown period excepted, as shown in the graph in today’s Opening Comments section. New home sales for December 2013 are due for release on Monday, January 27th.
__________