No. 622: March Durable Goods Orders, New- and Existing-Home Sales
COMMENTARY NUMBER 622
March Durable Goods Orders, New- and Existing-Home Sales
April 24, 2014
__________
First-Quarter 2014 Durable Goods Order Contracted at
Annualized Quarterly Pace of 7.2%
First-Quarter New-Home Sales Contracted at Annualized Pace of 9.8%,
Down by 3.2% Year-to-Year
First-Quarter Existing-Home Sales Contracted at Annualized Pace of 24.8%,
Down by 6.6% Year-to-Year
__________
PLEASE NOTE: The next regular Commentary is scheduled for Wednesday, April 30th, covering the “advance” estimate of first-quarter 2014 GDP, with a subsequent missive, on May 2nd, covering April employment and unemployment, and March construction spending. The May 2nd Commentary likely will include detail of the April 30th annual benchmark revision to retail sales.
Best wishes to all — John Williams
OPENING COMMENTS AND EXECUTIVE COMMENTARY
Continued Reporting of Quarterly Contractions. This week’s reporting of March 2014 existing- and new-home sales and today’s (April 24th) reporting of new orders for durable goods locked in first-quarter 2014 quarter-to-quarter contractions in each of those series (both before and after adjustment for inflation in durable goods orders), consistent with a quarterly downturn in first-quarter 2014 GDP. That said, and as discussed in the Week Ahead section, market expectations appear to be holding in slightly-positive territory for the initial first-quarter GDP growth estimate, due for release on April 30th. The Bureau of Economic Analysis (BEA), which estimates the GDP numbers, has considerable leeway in its initial guesstimate of growth in a given quarter and tends to target the consensus estimate. Accordingly, the headline reporting may be slightly on the positive side, but it should still come in below consensus, and significant risk of an outright headline contraction remains in place (see Commentary No. 621).
March and First-Quarter 2014 Durable Goods Orders—Nominal Orders Fell at an Annualized Quarter-to-Quarter Pace of 7.2%, Real Orders Fell by 8.7%. Despite a headline March gain of 2.6%, which was bloated minimally by prior-period downside revisions and by commercial aircraft orders, first-quarter 2014 new orders contracted quarter-to-quarter (both before and after adjustment for inflation), consistent with a quarterly contraction in first-quarter 2014 GDP.
In this traditionally-unstable orders series, the headline March gain was within the normal scope of month-to-month volatility. An ongoing longer-term pattern of stagnation has remained in place for the series—particularly when viewed net of inflation—and recently that has turned down anew. The patterns of activity remain of a nature that commonly precedes or coincides with a recession or deepening business downturn. The inflation-adjusted real series, and that same series corrected for understatement of the official inflation series, are discussed and graphed at the end of this section.
Nominal (Not-Adjusted-for-Inflation) March 2014 Reporting. Headline March 2014 new orders for durable goods rose by 2.60% for the month, following a revised 2.07% gain in February. Before prior-period revisions, total new orders in March rose by 2.38%.
First-quarter 2014 nominal orders fell quarter-to-quarter at an annualized pace of 7.17%, versus an annualized gain of 9.28% in fourth-quarter 2013. Adjusted for inflation, first-quarter 2014 real orders fell quarter-to-quarter at an annualized pace of 8.73%, versus an annualized gain of 7.10% in the fourth-quarter.
Net of Volatility in Commercial Aircraft Orders. The reporting of contractions and surges in commercial aircraft orders is seen in an irregularly-repeating process throughout the year and often dominates headline monthly durable goods orders. These extremely volatile aircraft orders are booked well into the future and are indicative more of longer-term, rather than shorter-term prospects for manufacturing activity.
In March, nondefense (or commercial) aircraft orders rose month-to-month by 8.57%, following a revised 12.52% gain in February. Net of the aircraft numbers, total new orders rose by 2.19% in March, versus a revised 1.42% gain in February.
What these numbers show over the last ten months, or so, is no meaningful change (up by 0.93%)—effectively stagnation—in new orders for durable goods, net of commercial-aircraft order activity and before any consideration for the effects of inflation. The ten-month change is up by 0.02% net of PPI inflation for “durable manufactured goods.”
Aircraft-order volatility also has impact on year-to-year change in seasonally-adjusted, total new orders. Total orders in March 2014 were up by 9.09%, up by 6.76% ex-commercial aircraft. In February a revised aggregate gain of 0.02% was against a revised 1.69% gain, ex-commercial aircraft.
Further affected by aircraft-order activity were the seasonally-adjusted new orders for nondefense capital goods, which rose by 7.14% month-to-month in March, versus a revised 2.78% decline in February, and, ex-commercial aircraft, were up by 6.79% in March, versus a revised 5.94% decline in February.
Real (Inflation-Adjusted) Durable Goods Orders—March 2014. ShadowStats uses the PPI aggregated inflation measure “durable manufactured goods” for deflating the new orders for durable goods series. Published only on a not-seasonally-adjusted basis, the related PPI series reflected a headline decline in monthly inflation of 0.1% in March 2014, following a 0.2% gain in February, with headline annual inflation of 0.7% in March, versus 0.8% in February.
Adjusted for that inflation, and again as reflected in the graphs at the end of this section, real month-to-month aggregate orders rose by 2.73% in March, following a revised 1.89% gain in February. Ex-commercial aircraft, orders rose for the month by 2.31% in March, versus a revised 1.24% gain in February.
Real year-to-year aggregate orders rose by 8.30% in March, versus a revised 0.76% decline in February, and, ex-commercial aircraft, they rose by 5.99% in March, versus a revised 0.90% gain in February.
Graphs of Inflation-Adjusted and Smoothed Durable Goods Orders and the Corrected Series. The first two graphs following plot new orders for durable goods, adjusted for inflation. Consistent with the recently revamped Producer Price Index (PPI) series, the inflation measure used here is an aggregation published from the PPI for “Durable Manufactured Goods.” These graphs show monthly as well as a six-month moving average of the activity level. The first graph shows the aggregate new orders series. The second graph is the headline series, net of the unstable commercial-aircraft order sector. Accordingly, the plot is somewhat smoother than the first graph.
In terms of inflation-adjusted activity, both of these series have shown a slowing uptrend and flattening-out in the last two-to-three years—with a dip and upside bouncing into 2013, and renewed downturn in recent reporting. Broadly, there has been a recent general pattern of stagnation or bottom-bouncing evident in the orders—clearly not the booming recovery that is seen in official GDP reporting. The real (inflation-adjusted) level of orders in March 2014 remained at or below both the pre-2001 and pre-2007 recession highs. The pattern of recent stagnation and downturn in the inflation-adjusted series also is one that commonly precedes or is coincident with a recession.
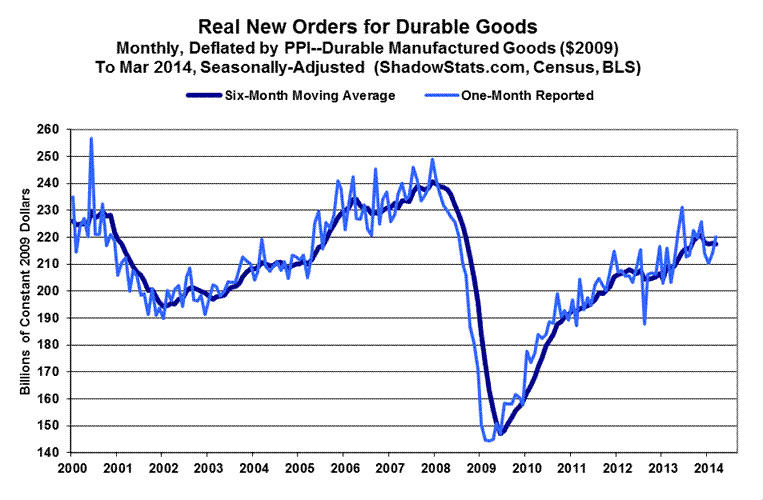

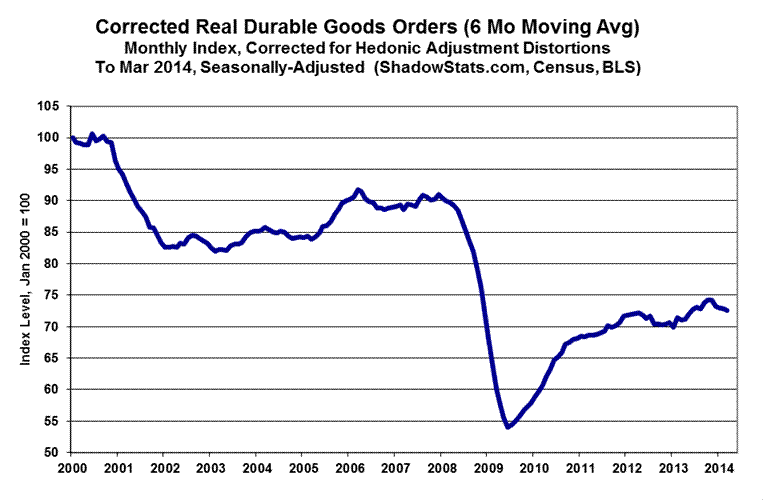
As with other economic series that are deflated by official government inflation measures, estimates of inflation-adjusted growth in new orders for durable goods are overstated, due to the understatement of the official inflation. That understatement here is through the use of hedonic-quality adjustments—usually not perceived by the consumer—used to reduce the pace of headline inflation (see Public Comment on Inflation). As has been done with other series such as the GDP, retail sales and industrial production, ShadowStats now publishes an experimental corrected version of the inflation-adjusted graph of real new orders for durable goods, corrected for the understatement of the related headline PPI inflation.
The next two graphs, following, reflect a smoothed version of the real total durable goods orders series (using a six-month moving average). The first graph reflects the real series, as graphed previously, only indexed to January 2000 = 100. The second graph is a “corrected” version of the first, where the estimated, understated inflation effects (overstated inflation-adjusted growth effects) from hedonic adjustments have been reversed by ShadowStats. As shown in 2014 Hyperinflation Report—Great Economic Tumble – Second Installment, the “corrected” real new orders for durable goods series shows a fair correlation to the “corrected” industrial production series.

Existing- and New-Home Sales—March 2014. After protracted periods of stagnation, both new- and existing homes have entered a period of renewed decline. As discussed in Commentary No. 619, there has been no underlying improvement in fundamental consumer liquidity conditions, and most underlying economic numbers are showing renewed economic contraction. There has been no basis and there is no basis here for expectations of an imminent recovery in the housing market.
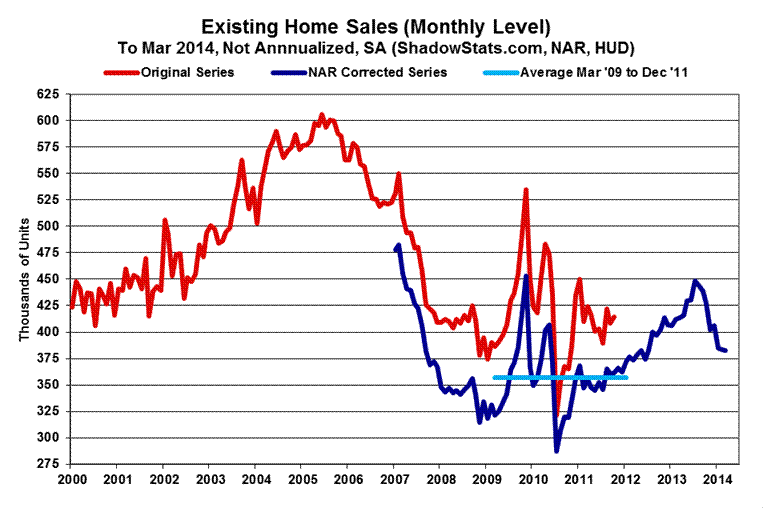
Existing-Home Sales Declined Month-to-Month, Quarter-to-Quarter and Year-to-Year. Except for a one-month bounce of 0.8% in December 2013, existing-home sales activity has been sliding since July 2013, with the March 2014 annualized sales pace of 4,590,000 down by 14.7% from the post-recession high of July 2013, and at the lowest level seen since July 2012. The March 2014 sales level still was 36.9% below the July 2005 pre-recession peak in activity. As with the new-home sales series, existing-home sales activity never came close to recovering peak pre-recession activity and now the numbers are turning down anew.
March Existing-Home Sales Were Down 0.2% for the Month, Down 7.5% Year-to-Year. The March 2014 existing-home sales (counted based on actual closings, National Association of Realtors [NAR]) showed a seasonally-adjusted 0.2% month-to-month decline, versus an unrevised 0.4% drop in February.
On a year-to-year basis, March 2014 annual sales declined by 7.5%, versus a 7.1% drop in February. The March annual contraction was the fifth consecutive month where headline sales were reported below those of the year before.
First-quarter 2014 sales contracted for the second consecutive quarter, down at an annualized pace of 24.8% versus fourth-quarter 2013, which, in turn, was down at an annualized pace of 25.6% from third-quarter 2013. Versus the same quarter of the year before, first-quarter 2014 sales were down by 6.6%, while fourth-quarter 2013 sales were up by 1.1%.
The NAR estimated the portion of total sales in “distressed” properties in March eased to 14% (10% foreclosures, 4% short sales), versus 16% (11% foreclosures, 5% short sales) in February 2014.
Reflecting continued lending problems, related banking-industry and consumer-solvency issues, and the ongoing influx of speculative investment money into the existing-housing market, the NAR also estimated that all-cash sales in March 2014 was 33%, down from 35% in February 2014, but up from 30% in March 2013.
New-Home Sales Also Declined Month-to-Month, Quarter-to-Quarter and Year-to-Year. The 14.5% retreat in monthly new-home sales activity for March 2014 was on top of an upside revision to February reporting. Net of prior-period revisions, the headline decline in March activity would have been 12.7%. As with existing-home sales, both monthly and quarterly levels of activity were negative on a month-to-month or quarterly basis and were down year-to-year. As of the headline March 2014 sales, activity still was down 72.4% from the pre-recession peak activity, seen in July 2005.
March 2014 New-Home Sales Reflect Renewed Downturn. Headline March 2014 new-home sales (counted based on contract signings, Census Bureau) fell by a statistically-insignificant 14.5%, following a revised 4.5% decline in February, and a revised 7.6% gain in January. Before prior-period revisions, March sales sank by a still-statistically-insignificant 12.7% for the month.
Year-to-year, however, the March 2014 annual sales decline of 13.3% was statistically-significant. That followed a revised year-to-year gain of 0.9% in February, and a revised 2.9% gain in January. The numbers here often are unstable and not reliable.
In terms of annualized quarter-to-quarter change, first-quarter 2014 new-home sales fell at an annualized pace of 9.8%, versus an annualized quarterly gain of 74.1% in fourth-quarter 2013. Year-to-year, first-quarter 2014 sales were down by 3.2%, where fourth-quarter 2013 sales had been up by 15.4%
Home-Sales Graphs. The regular monthly graphs of home sales activity follow. First is the graph of existing-home sales. Smoothed for irregular distortions, the series has remained statistically consistent with a period of broad stagnation that has turned now into renewed downturn, with both the fourth-quarter 2013 and first-quarter 2014 showing quarter-to-quarter contractions.
Second is the graph of new-home sales, also with first-quarter 2014 activity in contraction. For purposes of comparison, the third graph is of February single- and multiple-unit housing starts (from Commentary No. 621), where the housing starts series also was in quarterly downturn for first-quarter 2014.
Again, encompassed in these general patterns, and as discussed in Commentary No. 619, there has been no change in underlying consumer-liquidity fundamentals. There is nothing that would support a sustainable turnaround in the housing industry or general economic activity. There never was an economic recovery, and there is no recovery underway, just general bottom-bouncing that broadly is turning down anew.


[For further detail on March durable goods and home sales, see the Reporting Detail section]
__________
HYPERINFLATION WATCH
Hyperinflation Summary Outlook. The hyperinflation and economic outlook were updated with the publication of 2014 Hyperinflation Report—The End Game Begins – First Installment Revised, on April 2nd, and publication of 2014 Hyperinflation Report—Great Economic Tumble – Second Installment, on April 8th. Consistent with those Special Commentaries and the interim economic reporting of Commentary No. 621, a revised summary outlook is planned shortly for this section, which will incorporate the renewed business slowdown or downturn that should be evident in the April 30th initial estimate of first-quarter 2014 GDP.
__________
REPORTING DETAIL
NEW ORDERS FOR DURABLE GOODS (March 2014)
Nominal First-Quarter Durable Goods Orders Fell at an Annualized Quarter-to-Quarter Pace of 7.2%, Real Orders Fell by 8.7%. Despite a headline March gain of 2.6%, which was bloated minimally by downside prior-period revisions and by commercial aircraft orders, first-quarter 2014 new orders contracted at a quarterly pace (both before and after adjustment for inflation), consistent with a quarterly contraction in first-quarter 2014 GDP.
In this traditionally-unstable series, the headline March gain was within the scope of normal month-to-month volatility. An ongoing longer-term pattern of stagnation has remained in place for the durable goods series—particularly when viewed net of inflation—and recently has turned down anew. The patterns of activity in this series remain of a nature that commonly precedes or coincides with a recession or deepening business downturn. The inflation-adjusted real series, and the same series corrected for understatement of the official inflation series, are discussed and graphed in the Opening Comments section.
Nominal (Not-Adjusted-for-Inflation) March 2014 Reporting. The Census Bureau reported today, April 24th, that the regularly-volatile, seasonally-adjusted nominal level of March 2014 new orders for durable goods rose by 2.60% for the month, following a revised 2.07% (previously 2.23%) gain in February. Before prior-period revisions, total new orders in March rose by 2.38%.
First-quarter 2014 nominal orders fell quarter-to-quarter at an annualized pace of 7.17%, versus an annualized gain of 9.28% in fourth-quarter 2013. Adjusted for inflation, first-quarter 2014 real orders fell quarter-to-quarter at an annualized pace of 8.73%, versus an annualized gain of 7.10% in the fourth-quarter.
Net of Volatility in Commercial Aircraft Orders. The reporting of contractions and surges in commercial aircraft orders is seen in an irregularly-repeating process throughout the year and often dominates headline monthly durable goods orders. These extremely volatile aircraft orders are booked well into the future and are indicative more of longer-term, rather than shorter-term prospects for manufacturing activity.
In March, nondefense (or commercial) aircraft orders rose month-to-month by 8.57%, following a revised 12.52% (previously 13.56%) gain in February. Net of the aircraft numbers, total new orders rose by 2.19% in March, versus a revised 1.42% (previously 1.52%) gain in February.
What these numbers show over the last ten months, or so, is no meaningful change (up by 0.93%)—effectively stagnation—in new orders for durable goods, net of commercial-aircraft order activity and before any consideration for the effects of inflation. The ten-month change is up by 0.02% net of PPI inflation for “durable manufactured goods.”
Aircraft-order volatility also has impact on year-to-year change in seasonally-adjusted, total new orders. Total orders in March 2014 were up by 9.09%, up by 6.76% ex-commercial aircraft, versus a revised February gain in aggregate orders of 0.02% (previously 0.24%), and up by a revised 1.69% (previously 1.86%) ex-commercial aircraft.
Further affected by aircraft-order activity were the seasonally-adjusted new orders for nondefense capital goods, which rose by 7.14% month-to-month in March, versus a revised 2.78% (previously 2.83%) decline in February, and, ex-commercial aircraft, were up by 6.79% in March, versus a revised 5.94% (previously 6.21%) decline in February.
Pending Revisions. Separately, the Census Bureau has announced that its seasonal-adjustment model for the reporting of durable goods orders has been revised. New seasonally-adjusted numbers will be restated back to January 1992, on May 15th. Where the unadjusted numbers will not be changed, the adjusted revisions will be covered by ShadowStats in the next regular Commentary on new orders for durable goods (tentatively scheduled for May 27th).
Caution: Current durable goods reporting remains subject to many of the same sampling and concurrent-seasonal-adjustment problems that are seen with retail sales, payroll and unemployment reporting. Unusual seasonal-factor volatility raises issues as to the significance of reported seasonally-adjusted monthly and annual changes. While those issues are brought into balance, temporarily, with an annual benchmark revision to durable goods orders—as will be seen on May 15th this year—subsequent reporting makes all historical reporting prior to January 2014 inconsistent with the current headline numbers.
Real (Inflation-Adjusted) Durable Goods Orders—March 2014. ShadowStats uses the PPI aggregated inflation measure “durable manufactured goods” for deflating the new orders for durable goods series. Published only on a not-seasonally-adjusted basis, the related PPI series reflected a headline decline in monthly inflation of 0.1% in March 2014, following a 0.2% gain in February, with headline annual inflation of 0.7% in March, versus 0.8% in February.
Adjusted for that inflation, and again as reflected in the graphs of the Opening Comments section, real month-to-month aggregate orders rose by 2.73% in March, following a revised 1.89% (previously 2.04%) gain in February. Ex-commercial aircraft, orders rose for the month by 2.31% in March, versus a revised 1.24% (previously 1.33%) gain in February.
Real year-to-year aggregate orders rose by 8.30% in March, versus a revised 0.76% (previously 0.55%) decline in February, and, ex-commercial aircraft, they rose by 5.99% in March, versus a revised 0.90% (previously 1.07%) gain in February.
Graphs of Inflation-Adjusted and “Corrected” Smoothed Durable Goods Orders. Two sets of inflation-adjusted graphs are found in the Opening Comments section. The first set shows the monthly as well as a six-month moving-average activity for both the aggregate new orders series and the series net of the unstable commercial-aircraft order sector. The moving-average levels in both series have been holding in a pattern of near-stagnation, with some a recent turn to the downside.
Real levels of the March 2014 orders remained at or below both the pre-2001 and pre-2007 recession highs. The pattern of recent stagnation and downturn in the inflation-adjusted series also is one that commonly precedes or is coincident with a recession.
The second set of graphs in the Opening Comments section also shows the pattern of historical real new durable goods orders net of official inflation and “corrected” for the understatement of that inflation (overstatement of official, inflation-adjusted growth).
EXISTING-HOME SALES (March 2014)
Existing-Home Sales Declined Month-to-Month, Quarter-to-Quarter and Year-to-Year. Except for a one-month bounce of 0.8% in December 2013, existing-home sales activity has been sliding since July 2013, with the March 2014 annualized sales pace of 4,590,000 down by 14.7% from the post-recession high of July 2013, and at the lowest level seen since July 2012. March 2014 sales activity still was down by 36.9% from the July 2005 pre-recession peak in activity.
March Existing-Home Sales Were Down 0.2% for the Month, Down 7.5% Year-to-Year. The April 22nd release of March 2014 existing-home sales (counted based on actual closings, National Association of Realtors [NAR]) showed a seasonally-adjusted 0.2% month-to-month decline, versus an unrevised 0.4% drop in February.
On a year-to-year basis, March 2014 annual sales declined by 7.5%, versus a 7.1% drop in February. The March annual contraction was the fifth consecutive month where headline sales were reported below those of the year before.
First-quarter 2014 sales contracted for the second consecutive quarter, down at an annualized pace of 24.8% versus fourth-quarter 2013, which, in turn, was down at an annualized pace of 25.6% from third-quarter 2013. Versus the same quarter of the year before, first-quarter 2014 sales were down by 6.6%, while fourth-quarter 2013 sales were up by 1.1%.
Smoothed for irregular distortions, the series remained statistically consistent with a period of broad stagnation that has turned into renewed downturn, as seen in the graph in the Opening Comments. The data quality, though, remains questionable.
The NAR estimated the portion of total sales in “distressed” properties in March eased to 14% (10% foreclosures, 4% short sales), versus 16% (11% foreclosures, 5% short sales) in February 2014.
Reflecting continued lending problems, related banking-industry and consumer-solvency issues, and the ongoing influx of speculative investment money into the existing-housing market, the NAR also estimated that all-cash sales in March 2014 was 33%, down from 35% in February 2014, but up from 30% in March 2013.
As discussed in Commentary No. 619, there has been no underlying improvement in fundamental consumer liquidity conditions, and most underlying economic numbers are showing a renewed economic downturn. There is no basis here for an imminent recovery in the housing market.
Existing-Home Sales Graph. The regular monthly graph of existing-home sales activity is included in the Opening Comments section, along with graphs of the latest new-home sales and housing starts. Existing-home sales activity has turned down anew, with both fourth-quarter 2013 and first-quarter 2014 in quarter-to-quarter contractions.
NEW-HOME SALES (March 2014).
New-Home Sales Decline Month-to-Month, Quarter-to-Quarter and Year-to-Year. The 14.5% retreat in monthly new-home sales activity for March 2014 was on top of an upside revision to February reporting. Net of prior-period revisions, the headline decline in March activity would have been 12.7%. As with existing-home sales, both monthly and quarterly levels of activity were negative on a month-to-month or quarterly basis and were down year-to-year.
Again, as discussed in Commentary No. 619, there has been no underlying improvement in fundamental consumer liquidity conditions, and most underlying economic numbers are showing a renewed economic downturn. There is no basis here for an imminent recovery in the housing market. As of the headline March 2014 sales, activity still was down 72.4% from the pre-recession peak, seen in July 2005.
March 2014 New-Home Sales Reflected Renewed Downturn. As reported April 23rd by the Census Bureau, March 2014 headline new-home sales (counted based on contract signings) fell by a statistically-insignificant 14.5% +/- 15.1% (all confidence intervals are at the 95% level), following a revised 4.5% (previously 3.3%) decline in February, and a revised 7.6% (previously 3.2%, initially 9.6%) gain in January. Before prior-period revisions, March sales sank by a still-statistically-insignificant 12.7% for the month.
Year-to-year, March 2014 sales declined by a statistically-significant 13.3% +/- 11.6%. That followed a revised year-to-year gain of 0.9% (previously a decline of 1.1%) in February, and a revised 2.9% gain (previously a 0.7% annual decline, initially a 2.2% gain) in January. The numbers here often are unstable and not reliable.
In terms of annualized quarter-to-quarter change, first-quarter 2014 new-home sales fell at an annualized pace of 9.8%, versus an annualized quarterly gain of 74.1% in fourth-quarter 2013. Year-to-year, first-quarter 2014 sales were down by 3.2%, where fourth-quarter 2013 sales had been up by 15.4%
New-Home Sales Graph. The regular monthly graph of new-home sales activity is included in the Opening Comments section, along with graphs of the latest existing-home sales and housing starts. Even with the recent, unusually-unstable numbers, new-home sales activity appears to have turned down anew, with first-quarter 2014 in quarter-to-quarter and year-to-year contraction.
__________
WEEK AHEAD
Much-Weaker-Economic and Stronger-Inflation Reporting Likely in the Months and Year Ahead. Although shifting to the downside, market expectations generally still appear to be overly optimistic as to the economic outlook. Expectations should continue to be hammered, though, by ongoing downside corrective revisions and further, disappointing headline economic activity. The initial stages of that process have been seen in the recent headline reporting of many major economic series (see 2014 Hyperinflation Report—Great Economic Tumble – Second Installment).
That corrective circumstance and underlying weak economic fundamentals remain highly suggestive of deteriorating business activity. Accordingly, weaker-than-consensus economic reporting should become the general trend until such time as the unfolding “new” recession receives general recognition.
Stronger inflation reporting also remains likely. Upside pressure on oil-related prices should reflect intensifying impact from a weakening U.S. dollar in the currency markets, and from ongoing global political instabilities. Food inflation has started to pick up as well. The dollar faces pummeling from continuing QE3, the ongoing U.S. fiscal-crisis debacle, a weakening U.S. economy and deteriorating U.S. and global political conditions (see Hyperinflation 2014—The End Game Begins (Updated) – First Installment). Particularly in tandem with a weakened dollar, reporting in the year ahead generally should reflect much higher-than-expected inflation.
A Note on Reporting-Quality Issues and Systemic Reporting Biases. Significant reporting-quality problems remain with most major economic series. Ongoing headline reporting issues are tied largely to systemic distortions of seasonal adjustments. The data instabilities were induced by the still-evolving economic turmoil of the last eight years, which has been without precedent in the post-World War II era of modern economic reporting. These impaired reporting methodologies provide particularly unstable headline economic results, where concurrent seasonal adjustments are used (as with retail sales, durable goods orders, employment and unemployment data), and they have thrown into question the statistical-significance of the headline month-to-month reporting for many popular economic series.
PENDING RELEASES:
Gross Domestic Product—GDP (First-Quarter 2014, First or “Advance” Estimate). The Bureau of Economic Analysis (BEA) has scheduled release of the first estimate of first-quarter 2014 GDP for Wednesday, April 30th. As discussed in the Opening Comments and Commentary No. 621, a strong case can be made for an outright contraction in the initial, headline reporting for the quarter. With market expectations holding in minimal, albeit positive-growth territory, and with the BEA usually targeting the consensus outlook for the “advance” estimate, the headline estimate most likely will be held in positive territory. Nonetheless, a downside surprise to the already-weak consensus outlook is a good bet, and an outright quarterly contraction remains a real possibility.
Retail Sales (Annual Benchmark Revision). The Census Bureau has scheduled release of its annual benchmark revision to retail sales for Wednesday, April 30th, incorporating data from the 2012 Annual Retail Trade Survey. The new data should restate recent economic history to the downside. ShadowStats likely will publish an analysis of the revamped series in the May 2nd Commentary covering April employment and unemployment.
Construction Spending (March 2014). The Commerce Department is scheduled to release its estimate of March 2014 construction spending on Thursday, May 1st. The headline monthly changes, as usual, should not be statistically significant, while previous data again may be subject to unusually large and unstable revisions.
Employment/Unemployment (April 2014). The Bureau of Labor Statistics (BLS) will release its April 2014 labor data on Friday, May 2nd. Following March’s stronger-than-consensus and artificially-bloated 192,000 gain in payroll employment, a downside surprise to even-stronger April expectations is a fair bet. The BLS trend model suggests a 210,000 headline jobs gain for April (see Commentary No. 618).
The consensus tends to close in around the trend, and early expectations seem to be running near or slightly above trend level. Underlying economic reality would suggest a downside surprise versus both the trend and market expectations.
Expectations also appear to be for the headline April U.3 unemployment rate to ease a notch from March’s 6.7% reading. Underlying fundamentals would suggest an upturn in U.3, but the BLS’s continuing purge of discouraged workers from the unemployment rolls would argue in favor of a lower rate. As discussed regularly in the employment/unemployment-related Commentaries, month-to-month comparisons of U.3 are of no meaning, because of the standard, inconsistent reporting calculations that leave the monthly data not comparable.
If U.3 drops, there likely would be some further labor-force loss associated with that. The broader U.6 and ShadowStats unemployment measures would tend to hold, or increase anew, at their broader and higher respective levels.
Again, all these Labor Department numbers remain unsettled and could come in well outside general expectations.
__________