No. 665: September Retail Sales, PPI
COMMENTARY NUMBER 665
September Retail Sales, PPI
October 15, 2014
__________
September Retail Sales Declined, August and September Activity Revised Lower and
Third-Quarter Broad Growth Slowed Sharply
Unstable Seasonal Factors Helped Push Headline PPI Lower
___________
PLEASE NOTE: The next regular Commentary is planned for tomorrow, Thursday, October 16th, covering September industrial production, followed by one on Friday, covering housing starts.
Best wishes to all — John Williams
OPENING COMMENTS AND EXECUTIVE SUMMARY
Third-Quarter Growth Is Slowing. In the event you missed the prior Commentary, reviewing domestic and global financial, economic and systemic circumstances, and updating the Hyperinflation Outlook Summary, it is suggested that you look at it: Commentary No. 664.
Today’s relatively brief missive focuses on the headline nominal retail sales, updated consumer conditions and the producer price index (PPI) for September. Although the headline numbers generally were as expected, third-quarter growth in consumer activity slowed markedly versus prior headline indications. A summary of key September reporting to-date will be published in Friday’s (October 17th) Commentary No. 667, with a more-comprehensive review of September and third-quarter 2014 data to be published in the October 22nd Commentary No. 668, which will cover headline CPI inflation and real retail sales for September, among other items.
Retail Sales—September 2014—Sales Contracted in Context of Downside Revisions to July and August. Published a week in advance of the government’s headline report on September consumer inflation and the estimate of real (inflation-adjusted) retail sales, September 2014 nominal retail sales showed a statistically-insignificant headline contraction of 0.3% (-0.3%). A monthly sales decline was expected by the markets, but this decline also was on top of downside revisions to July and August activity. Net of prior-period revisions, September sales dropped by 0.4% (-0.4%).
Discussed with the August retail sales report (see Commentary No. 656), horrendously-poor-quality seasonal adjustments had led to wild gyrations in headline reporting of automobile sales, close to the model-year change. As generally expected, September’s headline numbers reflected some reversal in August’s extreme jump in automobile sales. Not expected, though, was the outright sales decline or significant slowing of sales activity also seen across almost all other major business categories (electronic and appliance stores excepted).
The formal estimate of real, or inflation-adjusted, September retail sales will be published on October 22nd and reviewed in Commentary No. 668 of that date. A likely small headline CPI-U inflation gain in September would deepen today’s headline monthly nominal contraction in real terms.
Nominal (Not-Adjusted-for-Inflation) Retail Sales—September 2014. The latest headline retail-sales detail was in the context of downside revisions to July and August 2014 activity. Headline September 2014 nominal retail sales activity showed a statistically-insignificant, seasonally-adjusted, monthly contraction of 0.32% (-0.32%), and a monthly decline of 0.38% (-0.38%) before prior-period revisions. The headline monthly decline in September followed a revised gain of 0.59% in August. The upside revision to headline August growth, however, was due to the headline July level being revised lower, not to August being revised higher.
Year-to-year growth in September 2014 retail sales eased to a statistically-significant 4.31%, versus a revised 5.04% gain in August. The September 2014 annual change reflected an upside revision to the prior-year level of activity, while the August 2014 annual growth was bloated by a downside revision to the August 2013 number.
Those year-ago revisions are junk-reporting out of the concurrent seasonal-adjustment process, which leaves headline data non-comparable with all the other historical data, shifting seasonally-adjusted headline activity between months, by stealth (see Reporting Instabilities and Distortions in the Reporting Detail section). Generally, near-term, headline reporting in retail sales is of negligible reliability. The nominal data become increasingly reliable over time, however, particularly after several years of revisions and annual retail census surveys.
Constrained Consumer Liquidity Restrains Residential Construction. Repeated frequently in these Commentaries (see for example Commentary No. 656, Commentary No. 658 and Commentary No. 659), the primary structural issue preventing meaningful, domestic U.S. economic growth remains impaired consumer liquidity. Without real growth in income, and without the ability and/or willingness to offset declining purchasing power with debt expansion, the consumer lacks the ability to fuel traditional, consumption-based growth or recovery in U.S. economic activity, including retail sales, residential investment and related construction spending.
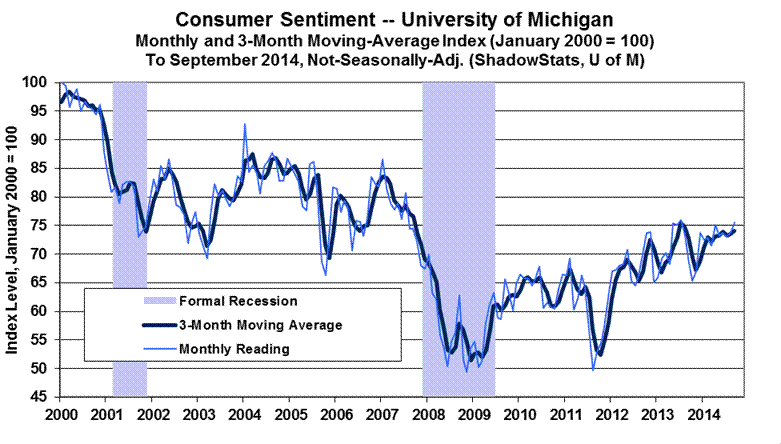
The first two graphs following show the month-end September 2014 readings for the Conference Board’s Consumer Confidence Index and the University of Michigan’s Consumer Sentiment Index. Although confidence fell and sentiment rose in September, both series remained deep in historical-recession territory.
There has been no economic recovery here, as shown by a plunge in activity into 2009 and then a purported recovery, to-date, in headline GDP activity. Instead, as indicated in these and other consumer-related measures, economic reality remains an economic plunge into 2009, followed by a period of prolonged, low-level stagnation, with activity now turning down anew.

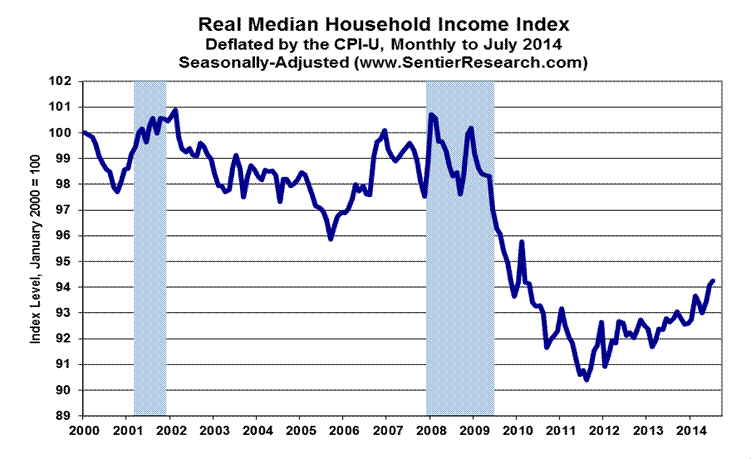
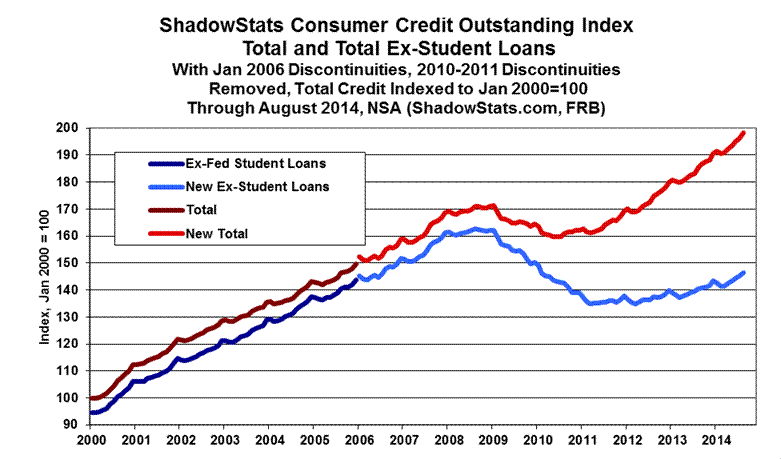
The next two graphs show monthly real median household income through July 2014, as reported by www.SentierResearch.com, and the August 2014 detail for the Federal Reserve’s series on consumer credit outstanding.
Real median household income has shown continued income stagnation through July 2014. As the GDP purportedly started its solid economic recovery in mid-2009, household income plunged to new lows. Deflated by headline CPI-U, the same series, published by the Census Bureau on an annual basis (Commentary No. 658), showed further that 2013 annual real median household income held at a low level of activity, at levels that also had been seen in the late-1960s and early-1970s.
Sentier Research prepares its data from what otherwise had been unpublished monthly detail available from the Census Bureau. Sentier apparently is having some issues with the Census information, as indicated by this note on the Sentier site: "Future releases of monthly income trends reports are pending our analysis of the effects of changes in the Current Population Survey sample design that result from the introduction of information derived from the 2010 Decennial Census." ShadowStats will keep you posted.
Growth in consumer credit, post-2008 Panic, has continued to be dominated by growth in federally-held student loans, not in bank loans to consumers that otherwise would fuel broad consumption growth. The upside notch to the latest level of student-loan activity reflects the regular seasonal jump at the beginning of the school year. These disaggregated data are available only on a not-seasonally-adjusted basis and are so plotted.
Producer Price Index (PPI)—September 2014—Unstable Seasonal Adjustments Took A Notch Out of Headline Wholesale Inflation. Questionable seasonal adjustments fell somewhat shy of neutralizing more fully the unadjusted downside movement in energy prices, which hit inflation in both the "energy" and "transportation" sectors hard. Otherwise adjusted, the headline September PPI would have been "unchanged," instead of a contraction of 0.1% (-0.1%), a small difference in this highly volatile, unstable and indeed questionable series.
As reported, the aggregate monthly 0.09% (-0.09%) decline in September’s final demand inflation, reflected a decline of 0.17% (-0.17%) headline monthly goods inflation, depressed by sharply-negative seasonal adjustments to food inflation, and despite some upside seasonal biases in the still-negative energy and minimally-positive “core” inflation. The negative inflation in the goods sector was muted minimally by a more-heavily weighted 0.09% (-0.09%) decline in services inflation.
Not headlined, but of potential use in adjusting construction-spending numbers for changing costs, seasonally-adjusted “final demand construction” inflation was unchanged month-to-month for the second month, with unadjusted annual inflation at a 2.97% gain, down from the 3.16% year-to-year increase for August 2014.
Discussed in Commentary No. 591, a new producer price index (PPI)—effective with January 2014 reporting—replaced the traditional headline monthly measure of wholesale inflation in "finished goods," with a headline monthly measure of wholesale "total final demand," composed of "final demand goods" (basically the old "finished goods" series), "final demand services" which tends to cap the goods inflation when oil prices are an issue, and "final demand construction."
September 2014 Headline PPI Detail. The seasonally-adjusted, month-to-month, headline producer price index (PPI) for September 2014 "total final demand" declined by 0.09% (-0.09%), following an unchanged (0.00%) reading in August, and a 0.09% gain in July. The aggregate impact of the various seasonal adjustments on the headline monthly September number was positive, but still understated. The unadjusted monthly inflation rate was a decline of 0.27% (-0.27%) in September. On a not-seasonally-adjusted basis—all annual growth rates are unadjusted—year-to-year headline PPI inflation eased to 1.65% in September, versus 1.83% in August 2014, but it was up from 1.11% in September 2013.
In terms of the three major subcategories for September 2014 "final demand" PPI, headline monthly "final demand goods" inflation contracted by 0.17% (-0.17%), "final demand services" inflation contracted by 0.09% (-0.09%), and "final demand construction" inflation was unchanged at 0.00%.
Final Demand Goods (Weighted at 34.40% of the Aggregate). Running somewhat in parallel with the old "finished goods" PPI series, headline monthly "final demand goods" inflation in September was down by 0.17% (-0.17%), having been down by 0.35% (-0.35%) in August, with an aggregate positive impact on the September reading from underlying seasonal-factor adjustments. On a not-seasonally-adjusted basis, headline September final demand goods inflation contracted by 0.35% (-0.35%). Year-to-year goods inflation was 1.51% in September, versus an increase of 1.68% in August 2014, and against a decline of 0.18% (-0.18%) in September 2013. Headline monthly changes by major components for September 2014 final demand goods:
· "Foods" inflation was down by 0.74% (-0.74%) in September, having declined by 0.49% (-0.49%) in August, with September’s drop in inflation intensified by seasonal adjustments. Unadjusted, September food inflation declined by 0.41% (-0.41%) for the month.
· "Energy" inflation fell by 0.71% (-0.71%) in September, having dropped by 1.49% (-1.49%) in August, with the September negative reading being narrowed by seasonal adjustments. Unadjusted September energy inflation dropped month-to-month by 1.32% (-1.32%).
· "Less foods and energy" (’core’ goods) inflation rose by 0.18% in September, having been unchanged at 0.00% in August. Seasonal adjustments boosted "core" inflation from an unadjusted 0.09% gain.
Final Demand Services (Weighted at 63.52% of the Aggregate). Headline monthly "final demand services" inflation fell by 0.09% (-0.09%) in September, having gained 0.27% in August. The overall impact on the September services inflation reading from underlying seasonal-factor adjustments was positive, but also understated, with unadjusted monthly change a decline of 0.27% (-0.27%). Year-to-year unadjusted inflation was 1.58% in September 2014, versus 1.86% in August 2014, and against 1.80% in September 2013. The headline monthly changes by major component for September 2014 final demand services inflation:
· "Services less trade, transportation and warehousing" inflation fell by 0.09% (-0.09%) in September, following a gain of 0.28% for the month of August. Seasonal-adjustment impact was neutral.
· "Transportation and warehousing" inflation declined by 0.17% (-0.17%) in September, following a monthly gain of 0.34%. Seasonal adjustments inflated an unadjusted decline in September of 1.59% (-1.59%). Where the decline in inflation here likely was largely in the energy sector, again, the seasonal-factor neutralizing of the decline in energy prices appears to have been understated.
· "Trade" inflation was unchanged at 0.00% for the second month, September 2014, with the headline number inflated by seasonal adjustments from a headline unadjusted September decline of 0.09% (-0.09%).
Final Demand Construction (Weighted at 2.08% of the Aggregate). Although a fully self-contained subsection of the "final demand" PPI, "final demand construction" inflation receives no formal headline coverage. Nonetheless, there are headline numbers published. Headline monthly construction inflation was unchanged in September, for a second month, following a headline gain of 0.45% in July 2014. The impact of seasonal factors on the headline number was neutral. On an unadjusted basis, year-to-year inflation was 2.97% in September 2014, versus 3.16% in August 2014, and 1.99% inflation in September 2013.
[For further detail on the August PPI and Retail Sales, see the Reporting Detail section.]
[Also, various drill-down detail and graphics options on retail sales headline reporting and revisions are available to ShadowStats subscribers at our affiliate: www.ExpliStats.com.]
__________
HYPERINFLATION WATCH
Hyperinflation Outlook Summary. The following Summary was updated in the prior Commentary No. 664, and it has not been updated further, other than for minor adjustments to language. If this is being read for the first time, reading it in the context of the Opening Comments of No. 664 (linked above), is suggested. The prior version of the Summary is found in Commentary No. 661.
The long-standing hyperinflation and economic outlooks were updated with the publication of 2014 Hyperinflation Report—The End Game Begins – First Installment Revised, on April 2nd, and publication of 2014 Hyperinflation Report—Great Economic Tumble – Second Installment, on April 8th, along with ongoing updates in the regular Commentaries, including Commentary No. 661. The two 2014 Hyperinflation Report installments remain the primary background material for the hyperinflation and economic analyses and forecasts.
Primary Summary. Current fiscal conditions show the effective long-term insolvency of the U.S. government, a circumstance that usually would be met by unfettered monetization of the national debt and obligations, leading to an eventual hyperinflation. The 2008 Panic and near-collapse of the financial system, and official (U.S. government and Federal Reserve) response to same, pulled the elements of the eventual hyperinflation crisis into the 2014 period. The primary and basic summary of the broad outlook and the story of how and why this fiscal, financial and economic crisis has unfolded and developed over the years—particularly in the last decade—is found in the Opening Comments and Overview and Executive Summary of that First Installment Revised (linked above). The following section summarizes the underlying current circumstance and recent developments.
Consistent with the above Special Commentaries, the unfolding economic circumstance, in confluence with other fundamental issues, should place mounting and massive selling pressure on the U.S. dollar, as well as potentially resurrect elements of the 2008-Panic. Physical gold and silver, and holding assets outside the U.S. dollar, remain the primary hedges against the pending total loss of U.S. dollar purchasing power, despite sharp recent rallies in the U.S. dollar’s exchange and related heavy selling in the gold and silver markets.
Current relative U.S. economic strength versus major U.S. trading partners is seriously over-estimated, with a crash back to recognition of realistic domestic-economic circumstances likely to be accompanied by a crash in the U.S. dollar versus major currencies, such as the euro, yen, pound, Swiss franc, Canadian dollar and Australian dollar; related rallies in precious metals and oil; and related sell-offs in the domestic stock and bond markets.
Current Economic Issues versus Underlying U.S. Dollar Fundamentals. U.S. economic activity is turning down anew. The headline contraction in first-quarter 2014 GDP was the reality; the headline second-quarter GDP boom was the aberration. Such should become increasingly and painfully obvious to the financial markets in the domestic economic reporting of the weeks and months ahead.
New reporting of relatively hard annual numbers from 2013 showed ongoing economic contraction, with no trend towards sustainable economic growth (see Commentary No. 656). Also, as discussed in today’s Opening Comments section, real business activity—net of all the happy assumptions and modeling used by the Bureau of Economic Analysis in putting the GDP growth estimates together—is flat-to-minus.
Despite any short-term pre-election fluff, those basic underlying, increasingly negative economic conditions will show up in various series, such as the trade deficit, retail sales, industrial production and payroll employment, providing consensus expectations with downside shocks. In turn, that should shift the popular outlook quite rapidly towards a "new recession," with negative shifts in the economic consensus increasingly disrupting the already-disintegrating stability in the financial markets.
As financial-market expectations increasingly shift towards renewed or deepening recession, that circumstance, in confluence with other fundamental issues, specifically should place mounting and massive selling pressures on the U.S. dollar, as well as potentially resurrect elements of the 2008-Panic.
Unexpected economic weakness intensifies the known stresses on an already-impaired banking system, hence a perceived need for expanded, not reduced, quantitative easing. The highly touted and ongoing "tapering" by the FOMC is pre-conditioned by a continued flow of "happy" economic news. Banking-system and other systemic (i.e. U.S. Treasury) liquidity needs likely still will be provided, as needed, by the Fed, under the ongoing political covering of a weakening economy—a renewed, deepening contraction in business activity.
Accordingly, some speculation already has begun to circulate as to an added round of Federal Reserve quantitative easing, QE4. That would be a major factor behind crashing the dollar and boosting the price of gold. The Fed has strung out its options for propping up the system as much as it could, with continual, negative impact on the U.S. economy. The easing to date, however, appears to have been a prop to the equity markets (see Commentary No. 663). In the event of QE4, any resulting renewed boost to U.S. equities likely would be a fleeting illusion, at least in terms of real value (purchasing power of the dollar). Such gains would tend to be losses, with the stocks valued in terms of Swiss francs, for example, or valued against what would be a rapidly-increasing pace of domestic U.S. inflation.
Unexpected economic weakness also savages projections of headline, cash-based, federal-budget deficits (particularly the 10-year versions) as well as projected funding needs for the U.S. Treasury. Current fiscal "good news" is from cash-based, not GAAP-based accounting projections, and comparative year-ago cash numbers are distorted against U.S. Treasury and government activity operating sub rosa, in order to avoid the limits of a constraining debt ceiling.
All these crises should combine against the U.S. dollar, likely in the very-near future. That said, recent faux market perceptions of domestic economic, financial-system and monetary tranquility have boosted the U.S. dollar’s strength significantly in global trading and have contributed to savaging the prices of precious metals. Again, such should not prevail in the context of underlying reality. The actual fundamental problems threatening the U.S. dollar could not be worse. The broad outlook has not changed. The key issues include, but are not limited to:
· A severely damaged U.S. economy, which never recovered post-2008 and is turning down anew. The circumstance includes a sharply widening trade deficit, as well as ongoing severe, structural-liquidity constraints on the consumer, which are preventing a normal economic rebound in the traditional, personal-consumption-driven U.S. economy.
· U.S. government unwillingness to address its long-term solvency issues. Those controlling the U.S. government have demonstrated not only a lack of will to address long-term U.S. solvency issues, but also the current political impossibility of doing so. Any current fiscal "good news" comes from cash-based, not GAAP-based accounting projections. The GAAP-based version has continued to run in the $6-trillion-plus range for annual shortfall—and should have done so again in the just-completed fiscal-2014—while those in Washington continue to increase spending and to take on new, unfunded liabilities. The history and issues here are explored in the first installment of the Hyperinflation Report, as previously linked.
· Monetary malfeasance by the Federal Reserve, as seen in central bank efforts to provide liquidity to a troubled banking system, and also to the U.S. Treasury. Despite the "tapering" of the Fed’s asset purchases, the current pace of the Fed’s monetization is at 58.9% of effective net issuance of the federal debt to be held by the public in calendar-year 2014 (through October 8th). The pace of effective monetization has been 66.0% since the January 2013 expansion of QE3.
· Mounting domestic and global crises of confidence in a dysfunctional U.S. government. The relative positive rating by the public of the U.S. President tends to be an indicative measure of this circumstance, with a meaningful correlation with the foreign-exchange-rate strength of the U.S. dollar. The weaker the rating, the weaker tends to be the U.S. dollar. Positive ratings for both the President and Congress are at historic lows and still are sinking.
· Mounting global political pressures contrary to U.S. interests. Downside pressures on the U.S. currency generally are mounting, in the context of global political and military developments contrary to U.S. strategic, financial and economic interests. Current conditions include the situation in Ukraine versus Russia and the extremely-volatile circumstances in the Middle East.
· Spreading global efforts to dislodge the U.S. dollar from its primary reserve-currency status. Active efforts or comments against the U.S. dollar have been seen with Russia, China, France and India, along with some rumblings in OPEC and elsewhere.
When the selling pressure breaks massively against the U.S. currency, the renewed and intensifying weakness in the dollar will place upside pressure on oil prices and other commodities, boosting domestic inflation and inflation fears. Domestic willingness to hold U.S. dollars will tend to move in parallel with global willingness, or lack of willingness, to do the same. These circumstances will trigger the early stages of a hyperinflation.
Both the renewed dollar weakness and the resulting inflation spike should boost the prices of gold and silver, where physical holding of those key precious metals remains the ultimate hedge against the pending inflation and financial crises.
__________
REPORTING DETAIL
RETAIL SALES (September 2014)
Headline September Sales Contracted in Context of Downside Revisions to July and August. Published a week in advance of the government’s headline report on September consumer inflation and the estimate of real (inflation-adjusted) retail sales, September 2014 nominal retail sales showed a statistically-insignificant headline contraction of 0.3% (-0.3%). A monthly sales decline was expected by the markets, but this decline also was on top of downside revisions to July and August activity. Net of prior-period revisions, September sales dropped by 0.4% (-0.4%).
Discussed with the August retail sales reporting (see Commentary No. 656), horrendously-poor-quality seasonal adjustments led to wild gyrations in reported automobile sales activity, close to the model-year change. As expected by the market consensus, today’s headline numbers reflected some reversal in August’s extreme jump in automobile sales. Not expected, however, was the outright sales decline or significant slowing of sales activity also seen across almost all other major business categories (electronic and appliance stores excepted).
Nominal (Not-Adjusted-for-Inflation) Retail Sales—September 2014. The latest headline retail-sales detail was in the context of downside revisions to July and August 2014 activity. Not adjusted for consumer inflation, today’s (October 15th) report on September 2014 retail sales—issued by the Census Bureau—indicated a statistically-insignificant, seasonally-adjusted, headline monthly contraction of 0.32% (-0.32%) +/- 0.58% (this and all other confidence intervals are expressed at the 95% level), and a monthly decline of 0.38% (-0.38%) before prior-period revisions. The September decline followed a revised gain of 0.59% (previously 0.58%) +/- 0.23% in August. The upside revision to headline August growth was on top of a downside revision to the headline July level, which now shows monthly growth of 0.27% (previously 0.34%, initially 0.04%).
Year-to-year growth in September 2014 retail sales eased to a statistically-significant 4.31% +/- 0.82%, versus a revised 5.04% (previously 5.00%) gain in August. The September 2014 annual change reflected an upside revision to the prior-year level of activity, while the August 2014 annual growth was bloated by a downside revision to the August 2013 number.
Those year-ago revisions are junk-reporting out of the concurrent seasonal-adjustment process, which leaves headline data non-comparable with all the other historical data, shifting seasonally-adjusted headline activity between months, by stealth (see Reporting Instabilities and Distortions). In general, terms, the near-term, headline reporting in retail sales is of negligible reliability. The nominal data become increasingly reliable over time, however, particularly after several years of revisions and annual retail census surveys.
September Core Retail Sales—Still-Tumbling Gasoline Prices. In an environment of generally rising food prices, and with an unadjusted 2.27% decline in monthly gasoline prices, seasonally-adjusted monthly grocery-store sales declined by 0.12% (-0.12%) in September, with gasoline-station sales down by 0.83% (-0.835). Under normal conditions, the bulk of non-seasonal variability in food and gasoline sales is in pricing, instead of demand. “Core” retail sales—consistent with the Federal Reserve’s preference for ignoring food and energy prices when “core” inflation is lower than full inflation—are estimated using two approaches:
Version I: September 2014 versus August 2014 seasonally-adjusted retail sales series—net of total grocery store and gasoline station sales—reflected a monthly decline of 0.29% (-0.29%), versus the official contraction of 0.32% (-0.32%).
Version II: September 2014 versus August 2014 seasonally-adjusted retail sales series—net of the monthly change in revenues for grocery stores and gas stations—reflected a 0.23% (-0.23%) monthly decline, versus the official 0.32% (-0.32%) contraction.
Real (Inflation-Adjusted) Retail Sales—September 2014. Again, the headline 0.32% September 2014 retail sales gain was before accounting for inflation. Real retail sales growth for September (net of inflation), will be reported along with the headline estimate of consumer inflation, the September 2014 CPI-U, in the October 22nd Commentary No. 668. September headline inflation should be around 0.1%, enough to dampen further, in real terms, the already-negative headline nominal growth rate.
Liquidity Constraints Impair Consumer Economic Activity. As discussed frequently and in the Opening Comments, during the last six-plus years of economic collapse and stagnation, activity in consumer buying of goods and services has been constrained by the intense, structural-liquidity woes besetting the consumer. Without real, or inflation-adjusted, growth in income, and without the ability or willingness to take on meaningful new debt, the consumer simply does not have the ability to sustain real growth in retail sales or in the personal-consumption activity that dominates the headline change in GDP.
Reporting Instabilities and Distortions. The usual seasonal-factor distortions were at play in September reporting, where the headline data reflected concurrent seasonal adjustments. Given Census Bureau reporting procedures, the headline detail is not comparable with earlier reporting. Accordingly, current data can reflect growth shifts from earlier periods, without the specifics being published or otherwise being mentioned to the public.
As has been a common pattern, the year-ago numbers for August and September were revised, along with the publication of the September 2014 data and revised detail on July and August 2014. The August and September 2013 revisions were due only to the changed seasonal adjustments, not due to the availability of new historical data lower. Where all other seasonally-adjusted historical numbers also were revised, though, those details were not published. Only the new details for July and August 2013 were provided for the earlier numbers. The upside revision to September 2013, means that the new seasonal factors added some upside spike to September 2014, shifting activity into the headline month from some unspecified prior period.
This allows for invisible shifts in seasonally-adjusted current activity that are not consistent with published historical reporting. Further, the stability of the seasonal-adjustment process (particularly the concurrent-seasonal-adjustment process used with retail sales) and sampling methods has been disrupted severely by the unprecedented depth and length of the current economic downturn in the post-World War II era (the period of modern economic reporting).
Retail sales reporting suffers the same inconsistency issues seen with other series, such as payroll employment, the unemployment rate, and durable goods orders. The highly variable and unstable seasonal factors here continued to cloud relative activity in the July 2014-to-September 2014, and in the August 2013-to-September 2013 periods, five months that are published on a non-comparable basis with all the other historical data. Consistent data are calculated each month and are available within the Census Bureau, but the Bureau chooses not to publish them.
PRODUCER PRICE INDEX—PPI (September 2014)
Unstable Seasonal Adjustments Took A Notch Out of Headline Wholesale Inflation. [Text here basically is unchanged from that in the Opening Comments.] Questionable seasonal adjustments fell somewhat shy of neutralizing more fully the unadjusted downside movement in energy prices, which hit both the "energy" and "transportation" sectors hard. Otherwise adjusted, the headline September PPI would have been "unchanged," instead of a contraction of 0.1% (-0.1%), a small difference in this highly volatile, unstable and indeed questionable series.
As reported, the aggregate monthly 0.09% (-0.09%) decline in September’s final demand inflation, reflected a decline of 0.17% (-0.17%) headline monthly goods inflation, depressed by sharply-negative seasonal adjustments to food inflation, and despite some upside seasonal biases in the still-negative energy and minimally-positive “core” inflation. The negative inflation in the goods sector was muted minimally by a more-heavily weighted 0.09% (-0.09%) decline in services inflation.
Not headlined, but of potential use in adjusting construction-spending numbers for changing costs, seasonally-adjusted “final demand construction” inflation was unchanged month-to-month for the second month, with unadjusted annual inflation at a 2.97% gain, down from the 3.16% year-to-year increase for August 2014.
Discussed in Commentary No. 591, a new producer price index (PPI)—effective with January 2014 reporting—replaced the traditional headline monthly measure of wholesale inflation in "finished goods," with a headline monthly measure of wholesale "total final demand," composed of "final demand goods" (basically the old "finished goods" series), "final demand services" which tends to cap the goods inflation when oil prices are an issue, and "final demand construction."
In the new structure of the PPI series, the dominant "final demand services" sector largely reflects problematic and questionable surveying of intermediate or quasi-wholesale profit margins in the services area. To the extent that profit margins shrink in the services sector, one could argue that the resulting lowered estimation of inflation actually is a precursor to higher inflation, as firms subsequently would move to raise prices, in an effort to regain more-normal margins. The new PPI series is an interesting concept, but likely limited as to its aggregate predictive ability versus general consumer inflation. There is not enough history available on the new series (just five years of post-2008-panic data) to establish any meaningful predictive relationship to general inflation, while the goods sector relationship has been established for many years.
September 2014 Headline PPI Detail. The Bureau of Labor Statistics (BLS) reported, this morning, October 15th, that the seasonally-adjusted, month-to-month, headline producer price index (PPI) for September 2014 "total final demand" declined by 0.09% (-0.09%), following an unchanged (0.00%) reading in August, and a 0.09% gain in July. The aggregate impact of the various seasonal adjustments on the headline monthly September number was positive, but understated. The unadjusted monthly inflation rate was a decline of 0.27% (-0.27%) in September. On a not-seasonally-adjusted basis—all annual growth rates are unadjusted—year-to-year headline PPI inflation eased to 1.65% in September, versus 1.83% in August 2014, but it was up from 1.11% in September 2013.
In terms of the three major subcategories for September 2014 "final demand" PPI, headline monthly "final demand goods" inflation contracted by 0.17% (-0.17%), "final demand services" inflation contracted by 0.09% (-0.09%), and "final demand construction" inflation was unchanged at 0.00%.
Final Demand Goods (Weighted at 34.40% of the Aggregate). Running somewhat in parallel with the old "finished goods" PPI series, headline monthly "final demand goods" inflation in September was down by 0.17% (-0.17%), having been down by 0.35% (-0.35%) in August, with an aggregate positive impact on the September reading from underlying seasonal-factor adjustments. On a not-seasonally-adjusted basis, headline September final demand goods inflation contracted by 0.35% (-0.35%). Year-to-year goods inflation was 1.51% in September, versus an increase of 1.68% in August 2014, and against a decline of 0.18% (-0.18%) in September 2013. Headline monthly changes by major components for September 2014 final demand goods:
· "Foods" inflation was down by 0.74% (-0.74%) in September, having declined by 0.49% (-0.49%) in August, with September’s drop in inflation intensified by seasonal adjustments. Unadjusted, September food inflation declined by 0.41% (-0.41%) for the month.
· "Energy" inflation fell by 0.71% (-0.71%) in September, having dropped by 1.49% (-1.49%) in August, with the September negative reading being narrowed by seasonal adjustments. Unadjusted September energy inflation dropped month-to-month by 1.32% (-1.32%).
· "Less foods and energy" (’core’ goods) inflation rose by 0.18% in September, having been unchanged at 0.00% in August. Seasonal adjustments boosted "core" inflation from an unadjusted 0.09% gain.
Final Demand Services (Weighted at 63.52% of the Aggregate). Headline monthly "final demand services" inflation fell by 0.09% (-0.09%) in September, having gained 0.27% in August. The overall impact on the September services inflation reading from underlying seasonal-factor adjustments was positive, but also understated, with unadjusted monthly change a decline of 0.27% (-0.27%). Year-to-year unadjusted inflation was 1.58% in September 2014, versus 1.86% in August 2014, and against 1.80% in September 2013. The headline monthly changes by major component for September 2014 final demand services inflation:
· "Services less trade, transportation and warehousing" inflation fell by 0.09% (-0.09%) in September, following a gain of 0.28% for the month of August. Seasonal-adjustment impact was neutral.
· "Transportation and warehousing" inflation declined by 0.17% (-0.17%) in September, following a monthly gain of 0.34%. Seasonal adjustments inflated an unadjusted decline in September of 1.59% (-1.59%). Where the decline in inflation here likely was largely in the energy sector, again, the seasonal-factor neutralizing of the decline in energy prices appears to have been understated.
· "Trade" inflation was unchanged at 0.00% for the second month, September 2014, with the headline number inflated by seasonal adjustments from a headline unadjusted September decline of 0.09% (-0.09%).
Final Demand Construction (Weighted at 2.08% of the Aggregate). Although a fully self-contained subsection of the Final Demand PPI, "final demand construction" inflation receives no formal headline coverage. Nonetheless, there are headline numbers published. Headline monthly construction inflation was unchanged in September, for a second month, following a headline gain of 0.45% in July 2014. The impact of seasonal factors on the headline number was neutral. On an unadjusted basis, year-to-year inflation was 2.97% in September 2014, versus 3.16% in August 2014, and 1.99% inflation in September 2013.
__________
WEEK AHEAD
Against Overly-Optimistic Expectations, Pending Economic Releases Should Be Much Weaker; Inflation Releases Should Be Increasingly Stronger. Although having shifted some to the downside, again, amidst wide fluctuations, market expectations for business activity generally remain overly optimistic, well above any potential, underlying economic reality. Market outlooks increasingly should be hammered, though, by ongoing, downside corrective revisions and by an accelerating pace of downturn in broad-based headline economic activity.
Longer-Range Reporting Trends. The process of downside shifting in economic-growth expectations has been sporadic, but the underlying fundamentals remain extraordinarily negative. Other than for nonsense-growth in the headline second-quarter GDP (see Commentary No. 662), renewed weakness has been, and increasingly will be seen in the headline reporting of other major economic series (see 2014 Hyperinflation Report—Great Economic Tumble – Second Installment), particularly subsequent to the November 4th election. Indeed, weaker-than-consensus economic reporting should remain the general trend until the unfolding "new" recession receives broad recognition, which likely would follow the next reporting of a headline contraction in real GDP growth.
A generally stronger consumer inflation trend remains likely to continue, as seen in recent months (August 2014 excepted). Beyond the spread of earlier oil-based inflation pressures into the broad economy, upside pressure on oil-related prices should continue and be rekindled from the intensifying impact of global political instabilities and a likely near-term weakening of the U.S. dollar in the currency markets. Such excludes any near-term efforts to push oil prices lower as an informal financial sanction against Russia.
The dollar faces eventual pummeling from the weakening economy, continuing perceptions of needed, ongoing quantitative easing, the ongoing U.S. fiscal-crisis debacle, and deteriorating U.S. and global political conditions (see Hyperinflation 2014—The End Game Begins (Updated) – First Installment). Particularly in tandem with a prospective, significantly-weakened dollar, reporting in the year ahead generally should reflect much higher-than-expected U.S. inflation, across the board.
A Note on Reporting-Quality Issues and Systemic-Reporting Biases. Significant reporting-quality problems remain with most major economic series. Ongoing headline reporting issues are tied largely to systemic distortions of seasonal adjustments. The data instabilities were induced by the still-evolving economic turmoil of the last eight years, which has been without precedent in the post-World War II era of modern economic reporting. These impaired reporting methodologies provide particularly unstable headline economic results, when concurrent seasonal adjustments are used (as with retail sales, durable goods orders, employment, and unemployment data). These issues have thrown into question the statistical-significance of the headline month-to-month reporting for many popular economic series.
PENDING RELEASES:
Index of Industrial Production (September 2014). Tomorrow, Thursday, October 16th, the Federal Reserve Board releases the September 2014 index of industrial production. September production has a fair chance of surprising relatively strong consensus-growth estimates on the downside. Risks of such a surprise, including an outright September contraction, likely would be in the context of downside revisions to prior reporting, with implied downside adjustments to inventory building.
Residential Construction—Housing Starts (September 2014). The Census Bureau plans the release of September 2014 residential construction detail, including housing starts, on Friday, October 17th. As discussed in Commentary No. 660 on the August version of this wild-man series of monthly economic detail, the headline reporting simply is worthless. Month-to-month volatility is extreme, and the headline numbers rarely come close to being statistically significant. Consensus expectations appear to be for a large, though likely not-statistically-significant, monthly increase.
In the violent headline swings seen regularly in the reporting of this series, month-to-month change likely will continue a pattern of statistical-insignificance, with ongoing stagnation and renewed downturn and/or downside revisions as seen in the six-month moving-average of the series. This series also is subject to extremely large prior-period revisions.
In the wake of a 75% collapse in aggregate activity from 2006 through 2008, and of an ensuing five-year pattern of housing starts stagnation at historically low levels, little has changed. As discussed in today’s Opening Comments section, there remains no chance of a near-term, sustainable turnaround in the housing market, unless there is a fundamental upturn in consumer and banking-liquidity conditions. That has not happened and does not appear to be in the offing.
__________