No. 685: November Trade Deficit, Construction Spending
COMMENTARY NUMBER 685
November Trade Deficit, Construction Spending
January 7, 2015
__________
Trade Deficit Shifts to Neutral Impact on Fourth-Quarter GDP Growth,
Had Contributed 0.8% Growth to Third-Quarter GDP
Real Construction Spending in Down-Trending Stagnation since Late-2013
Some Surprises to December Labor Data?
___________
PLEASE NOTE: The Special Commentary should be published tomorrow, January 8th, followed by a Regular Commentary on Friday, January 9th, covering December employment and unemployment.
In the event that factors beyond my control push the publication of the Special Report into the weekend, following Friday’s employment/unemployment Commentary, details will be advised in the schedule box in the upper left-column of the home page.
Best Wishes to all — John Williams
OPENING COMMENTS AND EXECUTIVE SUMMARY
Real Trade Deficit and Construction Spending Offer No Growth Prospects for Fourth-Quarter 2014 GDP. With the reporting of the November 2014 monthly trade-deficit and construction spending numbers, all the details are in place that are going to be reported for these two series before the January 30th "advance" estimate of fourth-quarter GDP. In the areas of trade-balance and construction activity, there are no indications of positive contributions to headline GDP growth in the fourth-quarter. ShadowStats will publish a comprehensive estimate of potential headline fourth-quarter growth and fudge factors later in the month, once full reporting for the quarter becomes available for series such as retail sales, industrial production and housing starts.
Today’s Missive (January 7th). Today’s Commentary concentrates on detail from the reporting of the November 2014 trade deficit and November construction spending.
The Week Ahead section highlights potential unusual reporting in the December labor data, scheduled for release on Friday, January 9th, versus market expectations for the headline detail.
Given the extensive new material in the pending publication of the year-end Special Commentary, today’s missive excludes the usual Hyperinflation Watch section and any general review of economic activity other than for the trade and construction-spending detail.
Trade Deficit—November 2014—Monthly Deficit Narrowed Both in Nominal and Real Terms; Impact on GDP Reporting Shifts from Positive in Third-Quarter to Neutral in Fourth-Quarter. Where the third-quarter 2014 trade deficit boosted headline GDP in that quarter, the government’s estimate for the fourth-quarter trade deficit should shift to neutral impact on the initial estimate of fourth-quarter GDP growth. Last month’s first estimate of the October 2014 trade deficit had suggested the fourth-quarter trade-deficit impact would be negative. While that remains possible as a result of likely large revisions to the quarterly trade estimate, once the December trade detail is available, the headline impact on initial fourth-quarter GDP reporting should be nil.
Initial Estimate of Fourth-Quarter Real Net Exports Effectively Should Be the Same as in the Third-Quarter. With the October and November 2014 trade deficit estimates in hand, all the data are available on which the "advance" estimate of the fourth-quarter 2014 net-export component of the GDP largely will be based. The news still is not positive for fourth-quarter GDP growth, but it is better than it was, based solely on what had been the initial October trade-deficit reporting.
Growth contribution from the trade deficit should be nil for the initial estimate of fourth-quarter 2014 GDP, due for release on January 30th. Of the 5.0% annualized real (inflation-adjusted) headline growth rate in the third-quarter GDP, quarterly narrowing of the third-quarter real trade deficit contributed 0.8% growth to the quarter. That 5.0% GDP growth was composed of 2.2% from personal consumption, 1.2% from business/residential investment, 0.8% from net exports and 0.8% from government spending (see Commentary No. 684).
The indication from the initial October 2014 reporting had been that the real fourth-quarter trade deficit would widen versus the third-quarter—resuming its traditional quarterly pattern of deterioration—with the effect of subtracting from headline fourth-quarter GDP growth. With the November reporting and a revised narrowing of the October deficit estimate, the headline impact on initial fourth-quarter GDP should be neutral. Even so, the headline fourth-quarter trade pattern still will be subject to potentially-significant revisions following next month’s December trade estimate. Revised GDP growth patterns would follow.
Monthly Narrowing of Both Real and Nominal Deficits. In headline nominal terms, the November deficit narrowed by $3.2 billion (7.7%) versus the October deficit, which narrowed in revision from its prior reporting. The improvement in the headline monthly deficit was somewhat greater than anticipated by the markets and was due largely to lower oil prices. In real terms, the November deficit also narrowed (by $2.2 billion [4.4%] versus October), but the impact of oil prices there was eliminated, in theory, by the inflation-adjustment process. Separately, the October real deficit narrowed in revision.
Nominal (Not-Adjusted-for-Inflation) November 2014 Trade Deficit. The headline, nominal, seasonally-adjusted monthly trade deficit in goods and services for November 2014, on a balance-of-payments basis, narrowed by $3.248 billion to $39.001 billion, from a revised $42.249 (previously $43.432) billion in October 2014, but widened versus a $35.972 billion deficit in November 2013. As to month-to-month trade patterns, November 2014 saw roughly a $1.964 billion decline in monthly exports, more than offset by a $5.211 billion decline in monthly imports. Although the decline in imports was dominated by a decline in the value of oil imports, that decline also reflected a lower physical volume of imports.
Declining physical volume in exports is a signal for slowing economic activity, as is a declining physical volume in imports. Physical volume took a hit on both sides of the trade reporting with the seasonally-adjusted November data.
Aside from temporarily declining oil prices, the ongoing trend should be for significant monthly, quarterly and annual deterioration in the U.S. trade deficit, both before and particularly after adjustment for inflation. Look for a sharp widening of the headline real deficit in the December reporting, along with relative deterioration of fourth-quarter versus third-quarter deficit data and implications for related GDP growth.
Real (Inflation-Adjusted) November 2014 Trade Deficit. Adjusted for seasonal factors, and net of oil-price swings and other inflation (2009 chain-weighted dollars, also used for GDP deflation), the November 2014 merchandise trade deficit (no services) narrowed to $47.844 billion, versus a revised $50.082 (previously $50.841) billion in October 2014, but it widened sharply versus a $45.117 billion deficit in November 2013.
With the early reporting (October and November) now in place for fourth-quarter trade activity, the trade-deficit news turned neutral for fourth-quarter 2014 GDP growth prospects.
Consistent with headline November reporting, the annualized quarterly real merchandise trade deficit stood at $554.7 billion for fourth-quarter 2013, $591.0 billion for first-quarter 2014, $619.9 billion for second-quarter 2014, and at an unrevised $587.2 billion for third-quarter 2014.
Based just on the headline October and November 2014 reporting (the basis on which the BEA will make its initial GDP estimate on January 30th), the fourth-quarter 2014 trade deficit would annualize out to $587.6 billion, virtually unchanged versus third-quarter activity of $587.2 billion. Accordingly, the initial estimate of quarter-to-quarter change in the real net-export account should be nil, with a shift to neutral impact on initial headline fourth-quarter GDP reporting as a result. Third-quarter 2014 trade activity had contributed 0.8% growth to headline third-quarter GDP reporting.
Again, with the initial estimate of the October 2014 deficit, the fourth-quarter deficit had annualized out to $610.1 billion, which would have provided a large hit against initial fourth-quarter 2014 GDP headline growth, had the October deficit pace continued.
Looking ahead, headline December 2014 trade-deficit reporting is a good bet to move the quarterly estimate of the real trade shortfall back above $600 billion for the fourth-quarter, which, in turn would contribute to a downside revision for fourth-quarter GDP growth in the first or second revision.
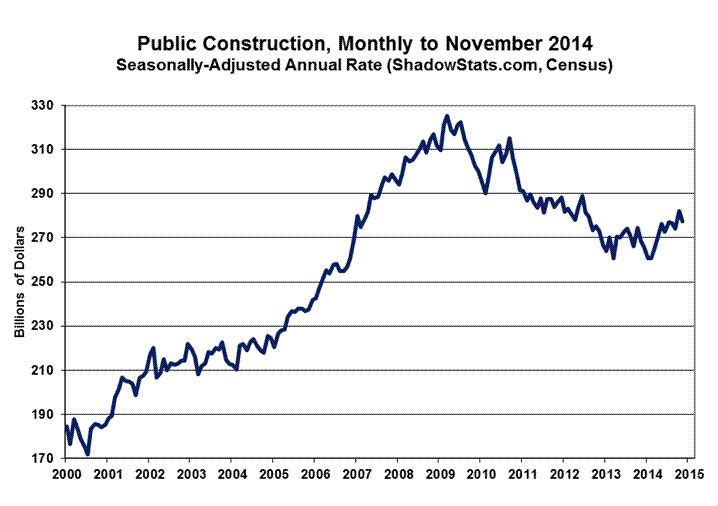
Construction Spending—November 2014— Down-Trending Stagnation in Inflation-Adjusted Series Began in Late-2013. The headline monthly decline of 0.3% (-0.3%) in nominal construction spending for November 2014 was not statistically meaningful, and it was on top of upside revisions to monthly activity in September and October. The pattern of ongoing, low-level stagnation remained intact, however, both before and after inflation adjustment, with the recent real (inflation-adjusted) series showing an ongoing irregular pattern of flat-to-downtrend that began in late-2013. The general effect here is that real data so far in the two months reported for fourth-quarter 2014 are suggestive of flat quarter-to-quarter real construction activity, fourth-quarter versus third-quarter.
That is shown in the Reporting Detail section in a preview of a new graph introduced in the pending Special Report, which shows the level of real construction spending put in place, monthly, since 1994, expressed in billions of 2009 dollars (same deflation-year base as used with real GDP reporting). As shown in the accompanying graph here, which also includes indexed real spending since 2000, the historical pattern is not one that supports headline real GDP numbers showing a full recovery and post-recession expansion since 2009.
PPI Final Goods Construction Index (FGCI). ShadowStats uses the newly created Final Goods Construction Index (FGCI) component of the Producer Price Index (PPI) for deflating the aggregate activity in the construction-spending series. The previously used New Construction Index (NCI), was so far shy of reflecting construction costs as to be virtually useless. Although closely designed to match this construction-spending series, the FGCI has two problems. First, its historical data only go back to November 2009. Second, it still understates actual construction inflation. There is no perfect, publicly-available inflation measure for deflating construction spending. Used here to deflate the historical series in the accompanying graph are the NCI through November 2009, and the FGCI thereafter.
For November 2014, the seasonally-adjusted FGCI month-to-month inflation was unchanged at 0.00%, following a 0.54% gain in October, with year-to-year inflation at 2.20% in September 2014, versus 2.29% in October 2014.
Headline Reporting for November 2014. The headline, total value of construction put in place in the United States for November 2014 was $975.0 billion, on a seasonally-adjusted—but not-inflation-adjusted—annual-rate basis. That estimate was down month-to-month by a statistically-insignificant 0.3% (-0.3%). Such followed a revised level of $977.7 billion in October, which was up by a revised 1.2% gain versus September. In turn the revised level of $966.4 billion in September was up by a revised 0.6% from an unrevised August level of $961.0 billion.
Adjusted for the FGCI inflation measure in the PPI, aggregate real spending in November 2014 was down month-to-month by 0.3% (-0.3%), versus a month-to-month gain of 0.5% in October.
On a year-to-year or annual-growth basis, November 2014 construction spending rose by a statistically-significant 2.4%, versus a revised 4.0% in October. Net of construction costs indicated by the FGCI, however, year-to-year change in spending was an annual gain of 0.2% in November 2014, following a gain of 1.7% in October 2014.
The headline 0.3% (-0.3%) monthly contraction in November 2014 construction spending, versus a monthly gain of 1.2% in October 2014, included a monthly contraction in November public spending of 1.7% (-1.7%), versus a 2.8% gain in October. November private construction rose by 0.3% in November, versus a gain of 0.5% in October. Within total private construction spending, the residential sector gained 0.9% in November, versus a 0.9% gain in October, while the nonresidential sector activity contracted by 0.3% (-0.3%) in November, versus a gain of 0.1% in October. This latest extended detail is graphed in the Reporting Detail section.
[Further detail on the Trade and Construction Spending Data, are found in the Reporting Detail. Various drill-down and graphics options on the headline Trade data also are available to subscribers at our affiliate: www.ExpliStats.com].
__________
REPORTING DETAIL
U.S. TRADE BALANCE (November 2014)
November Deficit Narrowed Both in Nominal and Real Terms; Quarterly Impact on GDP Growth Shifted from Positive in Third-Quarter to Neutral in Fourth-Quarter. Where the third-quarter 2014 trade deficit boosted headline GDP in that quarter, the government’s estimate for the fourth-quarter trade deficit should show a shift to neutral impact for the deficit on initial fourth-quarter GDP reporting. Last month’s first estimate of the October 2014 trade deficit had suggested the fourth-quarter trade-deficit impact would be negative. While that remains possible as a result of likely large revisions to the quarterly trade estimate, once the December trade detail is available, the impact on initial fourth-quarter GDP reporting should be nil.
Initial Estimate of Fourth-Quarter Real Net Exports Should Be Effectively the Same as in the Third-Quarter. With the October and November 2014 trade deficit estimates in hand, all the data are available on which the "advance" estimate of the fourth-quarter 2014 net-export component of the GDP largely will be based. The news still is not positive for fourth-quarter GDP growth, but it is better than it was, based solely on what had been the initial October trade-deficit reporting.
Growth contribution from the trade deficit should be nil for the initial estimate of fourth-quarter 2014 GDP, due for release on January 30th. Of the 5.0% annualized real (inflation-adjusted) headline growth rate in the third-quarter GDP, quarterly narrowing of the third-quarter real trade deficit contributed 0.8% growth to the quarter. That 5.0% GDP growth was composed of 2.2% from personal consumption, 1.2% from business/residential investment, 0.8% from net exports and 0.8% from government spending (see Commentary No. 684).
The indication from the initial October 2014 reporting had been that the real fourth-quarter trade deficit would widen versus the third-quarter—resuming its traditional quarterly pattern of deterioration—with the effect of subtracting from headline fourth-quarter GDP growth. With the November reporting and a revised narrowing of the October deficit estimate, the headline impact on initial fourth-quarter GDP should be neutral. Even so, the headline fourth-quarter trade pattern still will be subject to potential significant revision following next month’s December trade estimate.
Monthly Narrowing of Both Real and Nominal Deficits. In headline nominal terms, the November deficit narrowed by $3.2 billion versus the October deficit, which narrowed in revision from its prior reporting. The improvement in the monthly deficit was somewhat greater than anticipated by the markets and was due largely to lower oil prices. In real terms, the November deficit also narrowed (by $2.2 billion versus October), but the impact of oil prices there was eliminated, in theory, by the inflation-adjustment process. The October real deficit separately narrowed in revision.
Nominal (Not-Adjusted-for-Inflation) November 2014 Trade Deficit. The Bureau of Economic Analysis (BEA) and the Census Bureau reported this morning, January 7th, that the nominal, seasonally-adjusted monthly trade deficit in goods and services for November 2014, on a balance-of-payments basis, narrowed by $3.248 billion to $39.001 billion, from a revised $42.249 (previously $43.432) billion in October 2014, but widened versus a $35.972 billion deficit in November 2013. As to month-to-month trade patterns, November 2014 saw roughly a $1.964 billion decline in monthly exports, more than offset by a $5.211 billion decline in monthly imports (there are minor rounding differences in the monthly changes). Although the decline in imports was dominated by a decline in the value of oil imports, that decline also reflected a lower physical volume of imports.
Declining physical volume in exports is a signal for slowing economic activity, but so, too, is declining physical volume in imports. Physical volume took a hit on both sides with the seasonally-adjusted November data.
Aside from temporarily declining oil prices, the ongoing trend should be for significant monthly, quarterly and annual deterioration in the U.S. trade deficit, both before and particularly after adjustment for inflation. Look for a sharp widening of the headline real deficit in the December reporting, along with relative deterioration of fourth-quarter versus third-quarter deficit data.
Energy-Related Petroleum Products. For November 2014, the not-seasonally-adjusted average price of imported oil continued to fall, down to $82.95 per barrel, from $88.47 in October and $92.54 in September, and it was down from $94.69 per barrel in November 2013. Also not-seasonally-adjusted, physical oil import volume in November 2014 averaged 6.296 million barrels per day, down from 7.229 million in October and 7.550 million in September, and down from 7.091 million in November 2013.
Ongoing Cautions on Data Quality. Potentially heavy distortions in headline data continue from seasonal adjustments. Similar issues are seen with other economic releases, such as retail sales and payrolls, where the headline number reflects month-to-month change. Discussed frequently (see 2014 Hyperinflation Report—Great Economic Tumble – Second Installment for example), the extraordinary length and depth of the current business downturn have disrupted regular seasonality patterns. Accordingly, the markets should not rely too heavily on the accuracy of the monthly headline data.
Real (Inflation-Adjusted) November 2014 Trade Deficit. Adjusted for seasonal factors, and net of oil-price swings and other inflation (2009 chain-weighted dollars, also used for GDP deflation), the November 2014 merchandise trade deficit (no services) narrowed to $47.844 billion, versus a revised $50.082 (previously $50.841) billion in October 2014, but it widened sharply versus a $45.117 billion deficit in November 2013.
With the early reporting (October and November) now in place for fourth-quarter trade activity, the trade-deficit news turned neutral for fourth-quarter 2014 GDP growth prospects.
Consistent with headline November reporting, the annualized quarterly real merchandise trade deficit stood at $554.7 billion for fourth-quarter 2013, $591.0 billion for first-quarter 2014, $619.9 billion for second-quarter 2014, and at an unrevised $587.2 billion for third-quarter 2014.
Based just on the headline October and November 2014 reporting (the basis on which the BEA will make its initial GDP estimate on January 30th), the fourth-quarter 2014 trade deficit would annualize out to $587.6 billion, virtually unchanged versus third-quarter activity of $587.2 billion. Accordingly, the initial estimate of quarter-to-quarter change in the real net-export account should be nil, with a shift to neutral impact on initial headline fourth-quarter GDP reporting as a result. Third-quarter 2014 trade activity had contributed 0.8% growth to headline third-quarter GDP reporting.
With the initial estimate of the October 2014 deficit, the fourth-quarter deficit had annualized out to $610.1 billion, which would have provided a large hit against initial fourth-quarter 2014 GDP headline growth, had the October deficit pace continued.
Looking ahead, headline December 2014 trade-deficit reporting is a good bet to move the quarterly estimate of the real trade shortfall back above $600 billion for the fourth-quarter, which, in turn would contribute to a downside revision for GDP growth in the first or second revision.
CONSTRUCTION SPENDING (November 2014)
Down-Trending Stagnation in Inflation-Adjusted Construction Spending Began in Late-2013. The headline monthly decline of 0.3% (-0.3%) in nominal construction spending for November 2014 was not statistically meaningful, and it was on top of upside revisions to monthly activity in September and October. The pattern of ongoing, low-level stagnation remained intact, however, both before and after inflation adjustment, with the recent real (inflation-adjusted) series showing an ongoing irregular pattern of flat-to-downtrend that began in late-2013. The general effect here is that real data so far in the two months reported for fourth-quarter 2014 are suggestive of flat quarter-to-quarter real construction activity, fourth-quarter versus third-quarter.
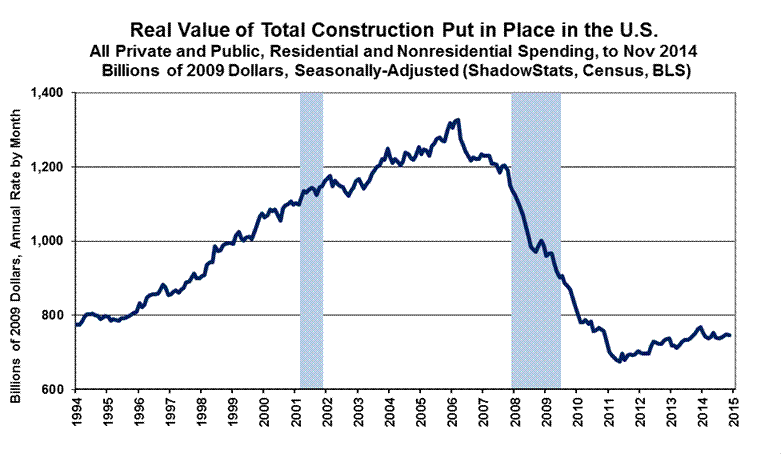
Such is shown in the preceding preview of a new graph introduced in the pending Special Report, which shows the level of real construction spending put in place, monthly, since 1994, expressed in billions of 2009 dollars (same deflation-year base as used with real GDP reporting). The historical pattern is not one that supports headline real GDP numbers showing a full recovery and post-recession expansion since 2009.
PPI Final Goods Construction Index (FGCI. Discussed in Commentary No. 679, ShadowStats shifted to using the newly created Final Goods Construction Index (FGCI) component of the Producer Price Index (PPI) for deflating the aggregate activity in the construction-spending series. The previously used New Construction Index (NCI), was so far shy of reflecting construction costs as to be virtually useless. Although closely designed to match this construction-spending series, the FGCI has two problems. First, its historical data only go back to November 2009. Second, it still understates actual construction inflation. There is no perfect, publicly-available inflation measure for deflating construction spending. What now is being used here to deflate the historical series in the accompanying graphs are the NCI through November 2009, and the FGCI thereafter.
For November 2014, the seasonally-adjusted FGCI month-to-month inflation was unchanged at 0.00%, following a 0.54% gain in October, with year-to-year inflation at 2.20% in September 2014, versus 2.29% in October 2014.
Headline Reporting for November 2014. The Census Bureau reported January 1st that the headline, total value of construction put in place in the United States for November 2014 was $975.0 billion, on a seasonally-adjusted—but not-inflation-adjusted—annual-rate basis. That estimate was down month-to-month by a statistically-insignificant 0.3% (-0.3%) +/- 1.8% (all confidence intervals are at the 95% level). Such followed a revised level of $977.7 (previously $971.0) billion in October, which was up by a revised 1.2% (previously 1.1%) gain versus September. In turn the revised level of $966.4 (previously $960.3, initially $950.9) billion in September was up by a revised 0.6% [previously it was down by 0.1% (-0.1%), initially down by 0.4% (-0.4%)] from an unrevised August level of $961.0 billion.
Adjusted for the FGCI inflation measure in the PPI, aggregate real spending in November 2014 was down month-to-month by 0.3% (-0.3%), versus a month-to-month gain of 0.5% in October.
On a year-to-year or annual-growth basis, November 2014 construction spending rose by a statistically-significant 2.4% +/- 1.9%, versus a revised 4.0% (previously 3.3%) in October. Net of construction costs indicated by the FGCI, however, year-to-year change in spending was an annual gain of 0.2% in November 2014, following a gain of 1.7% in October 2014.
The statistically-insignificant 0.3% (-0.3%) monthly contraction in November 2014 construction spending, versus a monthly gain of 1.2% in October 2014, included a monthly contraction in November public spending of 1.7% (-1.7%), versus a 2.8% gain in October. November private construction rose by 0.3% in November, versus a gain of 0.5% in October. Within total private construction spending, the residential sector gained 0.9% in November, versus 0.9% in October, while the nonresidential sector contracted by 0.3% (-0.3%) in November, versus a gain of 0.1% in October. The following graphs show the latest extended detail.

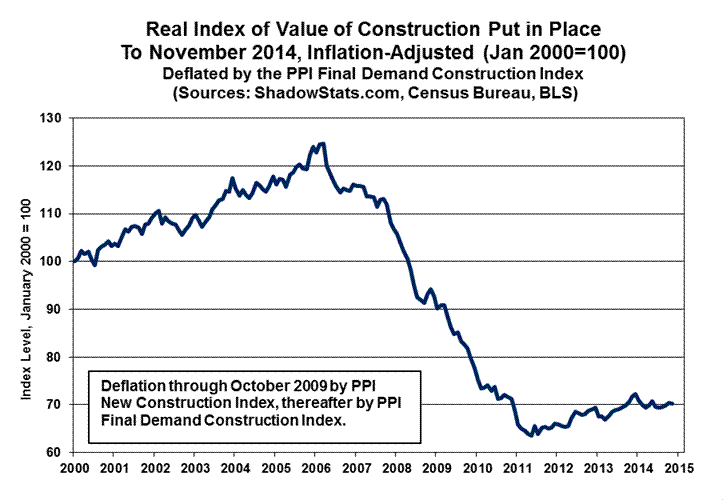
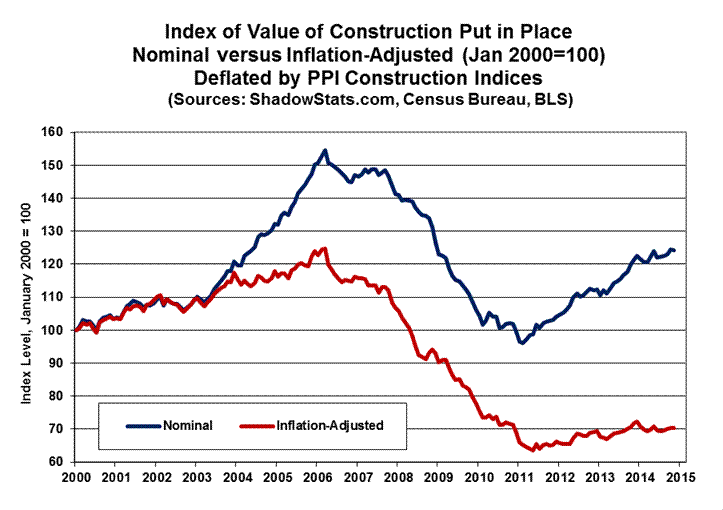
Construction and Related Graphs. The preceding two graphs reflect total construction spending through November 2014, both in the headline nominal dollar terms, and in real terms, after inflation adjustment. The inflation-adjusted graph is on an index basis, with January 2000 = 100.0. Adjusted for the PPI’s NCI measure through October 2009 and the PPI’s Final Demand Construction Index thereafter, real construction spending showed the economy slowing in 2006, plunging into 2011, then turning minimally higher in an environment of low-level stagnation, and now trending lower since late-2013.
As with the earlier graph in billions of 2009 dollars, the pattern of inflation-adjusted activity here—net of government inflation estimates—does not confirm the economic recovery indicated by the headline GDP series (see Commentary No. 684). To the contrary, the latest construction reporting, both before (nominal) and, more prominently, after (real) inflation adjustment, shows a pattern of slowing or down-trending stagnation, where activity never recovered pre-recession highs.
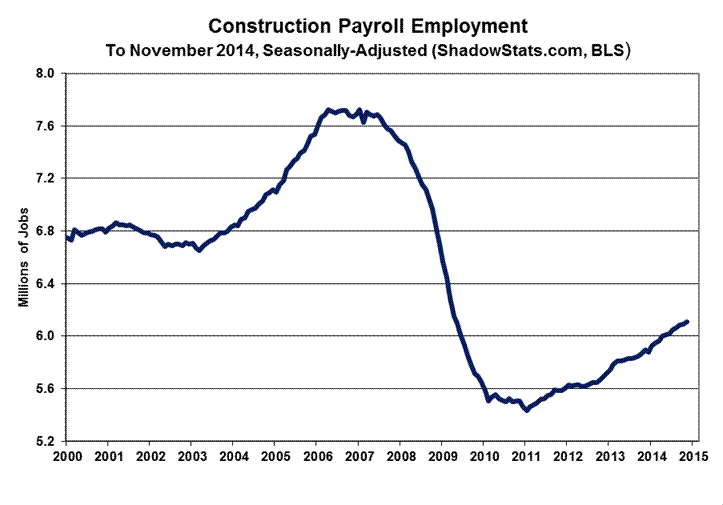
The first of the next two following graphs reflects November 2014 construction employment. The graph will be updated in the January 9th Commentary No. 687, which will cover December 2014 payroll reporting. In theory, payroll levels should move more closely with the inflation-adjusted aggregate series, where the nominal series reflects the impact of costs and pricing, as well as a measure of the level of physical activity. Still, the heavily-upside-biased construction payroll numbers (officially bloated by 5,000 jobs per month, unofficially at an order of magnitude of 20,000 jobs per month), as well as the heavily-guessed-at related construction activity in the GDP, have been running counter to most other recent indications of weakening construction activity, including the real construction spending levels detailed here.
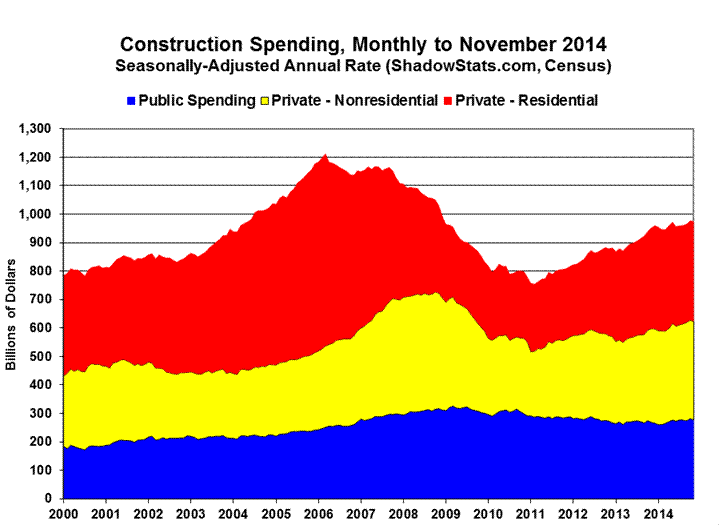
The next graph shows total nominal construction spending, broken out by the contributions from total-public (blue), private-nonresidential (yellow) and private-residential spending (red).
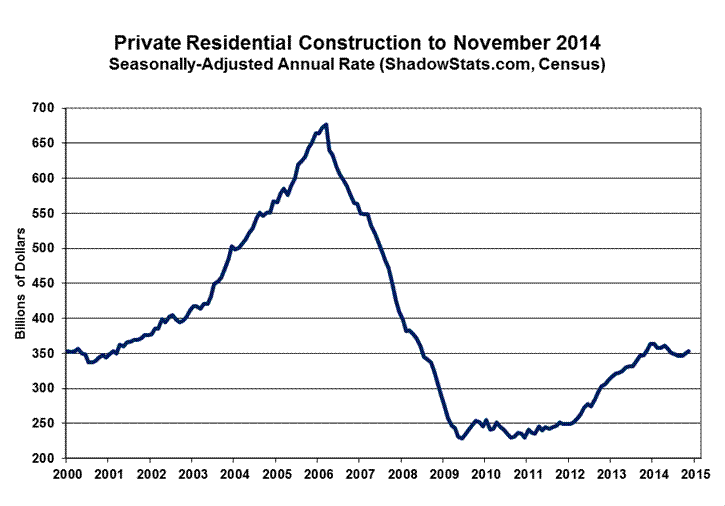
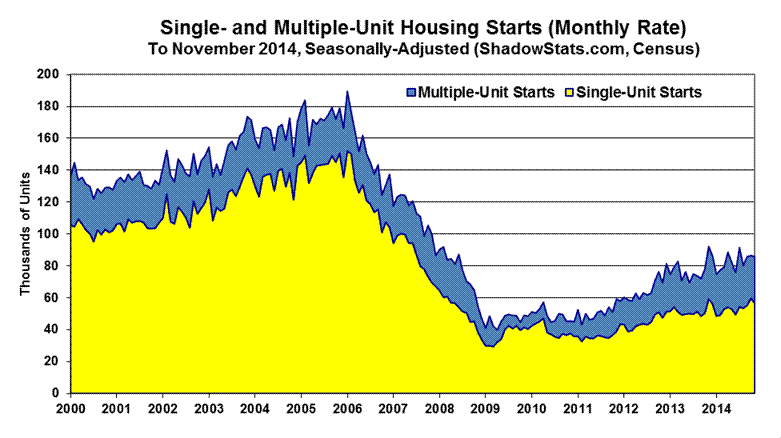
The first two graphs following cover private residential construction along with housing starts (combined single- and multiple-unit starts) for November (see Commentary No. 682). Keep in mind that the construction spending series is in nominal (not-adjusted-for-inflation) dollars, while housing starts reflect unit volume, which should tend to be more parallel with the real (inflation-adjusted) series. Where the private residential construction spending had been in recent upturn through most of 2013, that now has turned lower, trending to the downside in 2014, even before adjustment for inflation.
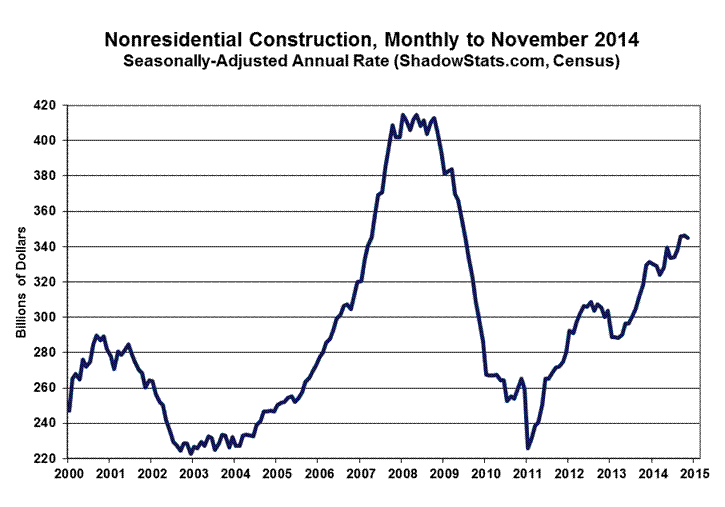
The final set of two graphs, the third and fourth, following, show the patterns of the monthly level of activity in private nonresidential construction spending and in public construction spending. The spending in private nonresidential construction remains well off its historic peak, but had bounced higher off a secondary, near-term dip in late-2012, and then heading higher, again, with a topping pattern seen recently. Public construction spending, which is 98% nonresidential, has continued in a broad downtrend, or with intermittent bouts of fluttering stagnation and some upturn, most recently.
__________
WEEK AHEAD
Against Overly-Optimistic Expectations, Economic Releases and Revisions in the Months Ahead Should Trend Much Weaker; Inflation Releases Should Be Increasingly Stronger after the Impact of Temporary Oil-Price Declines. Shifting some to the upside, again, from the downside, amidst wide fluctuations in the numbers, market expectations for business activity remain overly optimistic in the extreme. They exceed any potential, underlying economic reality. Downside corrective revisions and an accelerating pace of downturn in broad-based headline economic reporting should hammer those expectations in the next several months. Recent GDP excesses, however, will not face downside revisions until the July 30, 2015 benchmark revision to that series (see Commentary No. 684).
Headline consumer inflation—dominated by gasoline and other oil-price related commodities—should hit a near-term bottom in the next two months. Significant upside inflation pressures should resume when oil prices begin their rebound, a process that should be accelerated rapidly by an eventual sharp downturn in the exchange-rate value of the U.S. dollar. These areas, the general economic outlook and longer range reporting trends are reviewed broadly in the pending Special Commentary.
A Note on Reporting-Quality Issues and Systemic-Reporting Biases. Significant reporting-quality problems remain with most major economic series. Beyond gimmicked changes to reporting methodologies of the last several decades, ongoing headline reporting issues are tied largely to systemic distortions of seasonal adjustments. Data instabilities were induced partially by the still-evolving economic turmoil of the last eight years, which has been without precedent in the post-World War II era of modern economic reporting. The severity and ongoing nature of the downturn provide particularly unstable headline economic results, when concurrent seasonal adjustments are used (as with retail sales, durable goods orders, employment, and unemployment data). Combined with recent allegations (see Commentary No. 669) of Census Bureau falsification of data in its monthly Current Population Survey (the source for the Bureau of Labor Statistics’ Household Survey), these issues have thrown into question the statistical-significance of the headline month-to-month reporting for many popular economic series. Again, new issues tied to GDP reporting are discussed in the pending Special Commentary and in prior Commentary No. 684.
PENDING RELEASE:
Employment and Unemployment (December 2014). The Bureau of Labor Statistics (BLS) will release its December 2014 labor data on Friday, January 9th. Given continuing indications of weakening broad economic activity in fourth-quarter 2014, combined with the heavy, regular and irregular distortions in the headline reporting of monthly nonfarm payroll gains, almost anything remains possible with the headline December reporting. Unstable and distorted detail in the unemployment and related household-survey reporting, however, should be smoothed out some in the context of annual revisions to the seasonally-adjusted numbers.
Payrolls—High Risk of Downside Surprise versus Consensus. Happy headline-GDP reporting aside, the system remains due for negative surprises against persistently overly-optimistic market expectations for nonfarm payrolls. Below-consensus reporting in the headline December payroll employment, along with downside revisions to November and October’s previous estimates would intensify an unfolding negative tone for fourth-quarter GDP activity, and for the variety of monthly economic indicators due for release in the balance of January.
As published previously by ShadowStats-affiliate www.ExpliStats.com, in its analysis of the biases built into the concurrent-seasonal-factor modeling of November 2014 payroll employment, the implied built-in bias trend is for a December 2014 headline jobs gain of 214,000, versus the above-consensus 321,000 headline payroll employment surge reported in November. Where consensus forecasts for the month ahead tend to settle in around the trend number, market expectations for December appear to have settled well above trend at 245,000 [Bloomberg]. Where the trend is driven by the BLS modeling, there is high risk here of the headline payroll number disappointing market expectations.
Those risks are intensified by underlying economic reality, which would suggest a downside reporting surprise both to the trend estimate and to the market expectations for payrolls.
The annual benchmark revision to nonfarm payrolls is due with next month’s (February 6th) release of the January 2005 payroll data. The BLS already has indicated that the revision will be of little substance, in aggregate, although it will change patterns of employment reporting within the year (see Commentary No. 660).
Unemployment—Pending Annual Revisions to Seasonal Adjustments. Early expectations appear to be for the December 2014 headline U.3 unemployment rate to notch lower to 5.7%, from 5.8% in November. What will happen is anyone’s guess, and significant surprises are possible. For example, the headline November unemployment rate no longer may be 5.8%. Specifically, along with annual revisions to seasonal adjustments for the household survey data, existing patterns of month-to-month change in the headline unemployment rates and underlying data will be recast, and the new patterns may not be quite as happy as they were before or as they are expected.
Discussed regularly in the employment/unemployment-related Commentaries, month-to-month comparisons of headline, seasonally-adjusted U.3 and related numbers usually are of no meaning, because of the standard, inconsistent-reporting calculations tied to concurrent-seasonal-factor adjustments, which leave the monthly data not comparable. The current headline U.3 is calculated with a unique set of seasonal factors. Where the new headline detail is published, the historical data—revised along with the calculation of the headline number—are not (except once per year with headline December data, see discussion in Commentary No. 679).
Only with the December 2014 headline data, the published seasonally-adjusted household-survey numbers will be revised back five years, on a consistent basis with the headline December detail. Only the seasonal adjustments are revised, however, not the underlying or unadjusted survey details. Historical details, including adjusted household employment counts and month-to-month changes in the unemployment rates will be comparable, but only for just the one month. Come headline January 2015 reporting (February 6th), past history will be re-estimated again so as to be consistent with the headline January detail, but only the January detail, not the revised, consistent history will be published.
Where the raw, not-seasonally-adjusted underlying survey detail is sacrosanct, never revised, that does not apply to reporting with the headline January detail, next month (February 6th). The new population estimates as of January 2015 will make that detail not comparable with the December 2014 detail and all prior periods, separate from the inconsistent seasonal adjustments that otherwise also will be reinstituted at that time.
In the current circumstance, the headline U.3 unemployment (5.8% as initially reported for November 2014) remains at a seriously-troubled level, where many of those who have disappeared from the unemployment rolls have been unable to find work and have given up looking for a job, instead of the much happier circumstance of rejoining the ranks of the employed.
While underlying economic reality and the fundamental drivers of economic activity would suggest a general increase in the U.3 rate, the BLS’s continuing purge of discouraged workers from the unemployment rolls and headline labor force could argue in favor of a lower rate.
If the headline December 2014 U.3 unemployment rate should decline month-to-month, there likely would be additional labor-force loss associated with those relative headline numbers. The broader U.6 and ShadowStats unemployment measures still would tend to hold, or increase anew, at their broader and higher respective levels. In general, though, all the Labor Department employment and unemployment numbers remain unsettled and could come in well outside general expectations.
__________