No. 691: Advance Estimate of Fourth-Quarter 2014 GDP, Velocity of Money
COMMENTARY NUMBER 691
Advance Estimate of Fourth-Quarter 2014 GDP, Velocity of Money
January 30, 2015
__________
Slower Fourth-Quarter GDP Growth
Faces Likely Heavy-Downside Revisions
Headline GDP Growth Was Statistically Insignificant;
Economic Reality Remains Ongoing Stagnation and Contraction
Money Velocity Slowed Slightly
___________
PLEASE NOTE: The Special Commentary is scheduled for Monday, February 2nd. The next Regular Commentary will follow on Thursday, February 5th, covering the December trade deficit and construction spending, with another on Friday, February 6th, covering the January labor numbers.
Best Wishes to all — John Williams
OPENING COMMENTS AND EXECUTIVE SUMMARY
Is the Bureau of Economic Analysis Signaling Downside Revisions to Fourth-Quarter GDP? Headline fourth-quarter GDP growth came in at 2.6%, shy of the consensus 3.2% [Bloomberg], but still strong enough to support President Obama’s "risen from recession" comments in the State of the Union Address. Of some note, today’s (January 30th) headline "advance" GDP reporting reversed the pattern seen with the reporting of the "advance" second- and third-quarter 2014 estimates. Then, the initial Bureau of Economic Analysis (BEA) guesstimates topped consensus expectations, meaningfully, and subsequent estimates were revised higher. In contrast, the initial estimate of first-quarter 2014 GDP had come in sharply below expectations, with subsequent reporting revised lower, deep into negative territory. The "advance" headline reporting for fourth-quarter 2014 suggested that there were downside revisions ahead, perhaps into flat-to-minus territory by the March 27th GDP revision.
As noted in Commentary No. 689, the BEA literally was guessing the fourth-quarter GDP growth rate with its initial estimate, where the Bureau still lacked full quarterly information on factors such as the trade deficit, inventories and construction spending. Unless it saw evidence for sharply higher or lower growth than the consensus outlook, it would tend to target the consensus outlook for the "advance" reporting. Accordingly, an initial estimate sharply above or below the consensus would tend to indicate where the BLS saw the revised reporting going, and would tend to signal the likely direction of the first revision. Again, this morning’s headline growth was reported at 2.6%, versus a 3.2% consensus.
Of further note, recent BEA revisions to early GDP estimates have been unusually volatile, signaling new instabilities in the reporting system. Beyond historical changes in reporting methodology that have built upside biases into the headline GDP growth, a special-purpose political manipulation appears to have been a factor in recent and current reporting, likely tied to the impact of the Affordable Care Act (ACA). An economic depressant, not a stimulus, the ACA is not easily quantifiable, given the extremely poor-quality of the data available. Of the headline 2.6% GDP growth just reported, roughly 0.8% of that likely was tied to the ACA in some manner.
Underlying economic reality and likely activity in the year ahead will be explored in some depth in the February 2nd Special Commentary. Otherwise, as discussed frequently by ShadowStats, GDP remains the most-worthless and the most-heavily modeled, massaged and politically-manipulated of government economic series.
The headline GDP does not reflect properly or accurately the changes to the underlying fundamentals that drive the economy. Independent data generally support ShadowStats contentions that the U.S. economy never recovered from the recession, and that current business activity is stagnant and trending to the downside. The broad economy began to turn down in 2006 and 2007, plunged into 2009, entered a protracted period of stagnation thereafter—never recovering—and then began to turn down anew in recent quarters (see 2014 Hyperinflation Report—The End Game Begins – First Installment Revised, and 2014 Hyperinflation Report—Great Economic Tumble – Second Installment and the detail in the pending Special Commentary).
Today’s Missive (January 30th). Today’s Commentary concentrates on the detail from the first estimate of fourth-quarter 2014 GDP, and related measures such as the velocity of money. Usual with the first estimate of quarterly GDP activity, the Hyperinflation Watch includes the latest estimates of money supply velocity, a measure of how many times the money supply M1, M2 or M3 turns over in the national economy on an annual basis.
Otherwise, given the material pending in the Special Commentary, today’s Hyperinflation Watch section excludes the usual Hyperinflation Summary. The latest Hyperinflation Summary is found in Commentary No. 684; it will be updated post-Special Commentary.
The Week Ahead section previews the reporting of the December trade deficit and construction spending, plus the reporting of the headline January labor data, including effects of the annual payroll-benchmark revision on headline jobs reporting, and the annual re-estimation of population controls on the unemployment detail and related measures out of the household survey.
Gross Domestic Product (GDP)—Fourth-Quarter 2014—The first estimate of annualized, real (inflation-adjusted) fourth-quarter 2014 GDP growth slowed to 2.64%, a pace of gain that was not statistically significant. That followed headline growth of 4.97% in third-quarter 2014, 4.59% growth in second-quarter 2014, and a contraction of 2.11% (-2.11%) in first-quarter 2014. All these numbers face likely, significant downside revisions in the annual benchmarking of July 30, 2015.
Graphed in the Reporting Detail section, headline year-to-year growth in real fourth-quarter 2014 GDP slowed to 2.48%, versus 2.70% in third-quarter 2014, 2.59% annual growth in the second-quarter 2014, and 1.89% in the first-quarter 2014. Year-to-year growth in fourth-quarter 2013 was 3.13%, the near-term peak in the current cycle.
The latest quarterly year-to-year growth remained below that peak of a year ago. The current-cycle trough in annual change was in second-quarter 2009, at a 4.09% pace of decline (-4.09%). That was the deepest year-to-year contraction for any quarterly GDP in the history of the series, which began with first-quarter 1947.
In terms of annual average growth, average real 2014 GDP was up by 2.42 % over 2013, which, in turn was up by 2.22% over 2012. The annual decline in real activity of 2.78% (-2.78%) in 2009 was the deepest since the 11.58% (-11.58%) plunge in the post-war production shutdown of 1946. War disruptions excluded, the headline 2009 downturn was the worst seen since the economic plunge of 3.31% (-3.31%) in 1938, the second down leg of the Great Depression.
Implicit Price Deflator (IPD). As general guidance, the weaker the inflation rate used in deflating an economic series, the stronger will be the resulting inflation-adjusted growth. The first estimate of fourth-quarter 2014 GDP inflation, or the implicit price deflator (IPD), was at an annualized quarter-to-quarter rate of contraction of 0.09% (-0.09%), versus annualized inflations of 1.38% in third-quarter 2014, 2.15% in second-quarter 2014, and 1.33% in first-quarter 2014.
The unusual fourth-quarter 2014 contraction in the IPD means that real fourth-quarter growth of 2.64% actually was higher than the nominal fourth-quarter growth of 2.55%.
Year-to-year, fourth-quarter 2014 IPD inflation was 1.19%, versus 1.57% in third-quarter 2014, 1.64% in second-quarter 2014, 1.37% in first-quarter 2014, and 1.40% in fourth-quarter 2013.
Annual average IPD inflation was 1.44% in 2014, versus 1.49% in 2013.
For comparison, on a seasonally-adjusted, annualized quarter-to-quarter basis, CPI-U inflation published by the Bureau of Labor Statistics (BLS) contracted by 1.20% (-1.20%) in fourth-quarter 2014, versus a gains of 1.10% in third-quarter 2014, 3.03% in second-quarter 2014, and 1.91% in first-quarter 2014.
Unadjusted, year-to-year quarterly inflation was 1.25% in fourth-quarter 2014, versus 1.78% in third-quarter 2014, 2.05% in second-quarter 2014, 1.41% in first-quarter 2014, and 1.23% in fourth-quarter 2013
Annual average CPI-U was 1.62% in 2014 versus 1.46% in 2013.
Gross National Product (GNP) and Gross Domestic Income (GDI) Reporting Delayed Due to Usual Lack of Meaningful Data. Given the poor-quality of broad economic data available, year-end reporting tradition has been to delay the initial fourth-quarter and annual estimates of Gross National Product (GNP) and Gross Domestic Income (GDI), until the second revision of the fourth-quarter GDP (March 27th, this year). Such a delay in GDP reporting would be of value, as well, given the usual lack of significance to the early headline reporting.
Distribution of Headline GDP Growth. Despite the severely-limited significance of the following detail, it is included for those interested in the reported internal patterns of GDP growth, as guessed at by the BEA. The "advance," or first guesstimate of headline, annualized quarterly growth in fourth-quarter 2014 GDP was 2.64%, following 4.97% headline growth in third-quarter 2014, 4.59% growth in second-quarter 2014, and a contraction of 2.11% (-2.11%) in first-quarter 2014 GDP.
The initial fourth-quarter growth rate is detailed in the following aggregation of contributed growth. Please note that the annualized growth number in each sub-category is the additive contribution to the aggregate, headline change in GDP, where 2.87% + 1.20% - 1.02% - 0.40% = 2.65% (rounding difference versus 2.64%). When all the dust settles from revisions in the next six months, headline fourth-quarter 2014 GDP quarter-to-quarter growth should be flat-to-minus.
· Consumer Spending Contributed 2.87% to Fourth-Quarter Growth; Contributed 2.21% to Third-Quarter. Headline, fourth-quarter personal consumption appears to have been heavily bloated by the highly questionable effects and measurement of the Affordable Care Act (ACA), which likely contributed in excess of 0.8% of the overall 2.6% headline GDP growth. Three other unusual areas here accounted for another 0.8%, including surging gasoline consumption [as nonsensically indicated in real retail sales reporting, consumers seem to be spending their gasoline savings on buying more gasoline]; surging home utility usage [an issue with seasonal adjustments and unseasonable weather, but contrary in direction to the indication from industrial production]; and the strongest quarterly surge in clothing and footwear purchases seen in years. Durable goods consumption, including furniture, autos and recreational vehicles accounted for 1.20% of the aggregate GDP growth rate.
· Business/Residential Investment Contributed 1.20% to Fourth-Quarter Growth; Contributed 1.18% to Third-Quarter. An involuntary inventory build-up added 0.82% to the aggregate GDP growth, which left final sales (GDP minus inventory changes) at 1.82%. The regular upside bias added to GDP growth in the last major GDP overhaul—intellectual property—contributed its regular 0.3% to aggregate GDP growth.
· Net Exports Subtracted 1.02% (-1.02%) from Fourth-Quarter Growth; Contributed 0.78% to Third-Quarter. The net export account subtracted more from GDP growth than was suggested by the November trade deficit reporting. Based on the November trade detail, the initial impact on GDP growth should have been relatively neutral for the quarter. Accordingly, there could be some surprise-widening in the week ahead (Thursday, February 5th) for the still-pending, headline December merchandise trade deficit, net of inflation. See the Week Ahead section.
· Government Spending Subtracted 0.40% from Fourth-Quarter Growth; Contributed 0.80% to Third-Quarter. A reversal in, or a balancing of the prior quarter’s surge in defense spending, subtracted 0.54% from aggregate GDP growth, where it had contributed 0.66% to growth in the third-quarter. Other areas, including state and local government consumption, were changed little from the prior quarter, including spending by state and local governments tied to the ACA distortions.
Economic Reality. Even with the headline first estimate of annualized fourth-quarter 2014 GDP growth slowing to 2.64 %, following 4.97% growth in third-quarter 2014, 4.59% growth in second-quarter 2014 and a contraction of 2.11% (-2.11%) in first-quarter 2014, the general outlook as to underlying economic reality has not changed, as will be extensively discussed in the Special Commentary. The broad economy still is turning down anew, and a wide variety of monthly economic detail still should confirm that in reporting of the months ahead. Serious downside revisions to recent and current GDP reporting also are likely, come the annual benchmark revision in the GDP series scheduled for July 30, 2015, in addition to downside growth adjustments to the fourth-quarter 2014 estimate in the next two months of regular revision (February 27th and March 27th). Accordingly, the gist of much of the following text remains along the lines of other recent GDP Commentaries, but the details and numbers have been updated for the fourth-quarter reporting.
Discussed frequently, the GDP does not reflect properly or accurately the changes to the underlying fundamentals that drive the economy. Underlying real-world economic activity shows that the broad economy began to turn down in 2006 and 2007, plunged into 2009, entered a protracted period of stagnation thereafter—never recovering—and then began to turn down anew in recent quarters. Irrespective of the reporting gimmicks introduced in the July 2013 and July 2014 GDP benchmark revisions, including a recent pattern of inclusion and estimation of highly-questionable data on the Affordable Care Act (ACA), a consistent, fundamental pattern of faltering historical activity is shown in the accompanying sets of “corrected” GDP graphs.
Please note that the pattern of activity shown for the “corrected” GDP series is much closer to the patterns shown in the graphs of employment and monthly real median household income and other consumer measures (see Commentary No. 689 and Commentary No. 690). Similar patterns are found in recent indications of annual consumer expenditures (see Commentary No. 656 and Commentary No. 673) and economic series not otherwise reliant on understated inflation for their reported growth, such as housing starts (see 2014 Hyperinflation Report—Great Economic Tumble – Second Installment and in the pending, February 2nd Special Commentary). A sustainable business recovery could not have taken place since 2009, and a recovery will not be forthcoming until the consumer’s structural income and liquidity problems are resolved.
Official and Corrected GDP. As usually discussed in these Commentaries covering the quarterly GDP reporting and monthly revisions, the full economic recovery indicated by the official, real GDP numbers remains an illusion. It is a statistical illusion created by using too-low a rate of inflation in deflating (removing inflation effects) from the GDP series. The accompanying two sets of graphs tell that story, updated for the initial estimate of fourth-quarter 2014 GDP.
The first set of graphs (2000-to-date) is the one traditionally that has been incorporated in the GDP Commentaries, and is expressed on an index base where first-quarter 2000 = 100.0. The second set updates the longer-term graphs (1970-to-date), expressed in billions of 2009 dollars as used in headline GDP reporting, and as published initially in the second installment of the Hyperinflation Report (linked above).
Shown in the first graph of official Headline Real GDP, GDP activity has been reported above pre-2007 recession levels—in full recovery—since second-quarter 2011, and headline GDP has shown sustained growth since (with a growth interruption in first-quarter 2014). Adjusted for official GDP inflation (the implicit price deflator), the level of fourth-quarter 2014 GDP currently now stands at 8.8% above the pre-recession peak-GDP estimate of fourth-quarter 2007. In contrast, the “corrected” GDP version, in the second graph, shows fourth-quarter 2014 GDP activity at 6.1% (-6.1%) below the pre-recession peak of first-quarter 2006.
Further, as discussed in the second installment of the Hyperinflation Report, and again in the pending Special Commentary, no other major economic series has shown a parallel pattern of official full economic recovery and meaningful expansion beyond, consistent with the GDP reporting (see discussions on the real retail sales and the industrial production series in Commentary No. 688, as well as the real durable goods orders series discussed in Commentary No. 690). Either the GDP reporting is wrong, or all other major economic series are wrong. While the GDP is heavily modeled, imputed, theorized and gimmicked, it also encompasses reporting from those various major economic series and private surveys, which still attempt to survey real-world activity. Flaws in the GDP inflation methodologies and simplifying reporting assumptions have created the “recovery.”
The second graph in each series plots the Corrected Real GDP, corrected for the understatement inherent in official inflation estimates (see Public Commentary on Inflation Measurement), with the deflation by the implicit price deflator (IPD) adjusted for understatement of roughly two-percentage points of annual inflation. The inflation understatement has resulted from hedonic-quality adjustments, as discussed in the Hyperinflation Reports. Both graphs in the first set are indexed to first-quarter 2000 = 100, and show official periods of recession as shaded areas.

The shaded areas in the “corrected” graph that follows reflect official as well as ShadowStats-defined recessions, again as discussed in detail in the second installment of the Hyperinflation Report and the pending Special Report.
[Further background material on Fourth-Quarter GDP is included the Reporting Detail. Various drill-down and graphics options are available to subscribers at our affiliate: www.ExpliStats.com].
__________
HYPERINFLATION WATCH
Hyperinflation Outlook Summary. This sub-section will be updated post-Special Commentary. See Commentary No. 684 for the last version of the Hyperinflation Summary.
Money Supply Velocity. Incorporating the initial new nominal data on fourth-quarter 2014 GDP, as well as continued and regular Federal Reserve benchmark revisions to money supply-related data, graphed below are updated estimates for the velocity of money, broken out for money supply M1, M2 and M3.
Velocity generally softened minimally in fourth-quarter 2014 for each money-supply measure, M1, M2 and M3 (ShadowStats Ongoing-M3 Measure), as shown in the accompanying graphs, having plunged into 2014 for M1 and M2. M3 velocity has been stagnant since the end of 2010.
Where velocity simply is the ratio of the nominal GDP to the nominal money supply, the unchanged ratios, reflected somewhat stronger money growth and GDP growth, with recent slowing in M1 and M2 velocity bottoming out, and the flattening of M3 holding in place or turning slightly to the upside.
As to M1, consider that perhaps 70% or more of the cash-in-circulation component of that measure (with cash accounting for about 44% of M1) could be physically outside the United States, per the Federal Reserve. Where that has been an increasing trend, a true measure of domestic M1 velocity well could be showing a significant uptrend. In like manner, where M1 includes cash, M2 includes M1, and M3 includes M2, M2 and M3 velocities also would be somewhat higher (cash is 11% of M2, 8% of M3).
M3 versus M1 and M2 had been showing opposite patterns since 2011, because growth in M3 has been weaker than growth in M1 and M2. The reason behind that difference was that much of the relatively stronger M1 and M2 growth reflected cash moving out of M3 categories—such as large time deposits and institutional money funds—into M2 or M1 accounts. The clarity of what happened there is why ShadowStats still tracks what had been the broadest money measure (M3) available.

Subscribers often ask for specifics on the velocity of the money supply, with the result that this section has become a standard feature for Commentaries covering the first GDP reporting of a given quarter. The nature of velocity is discussed in some detail in the 2008 Money Supply Special Report. Velocity simply is the number of times the money supply turns over in the economy in a given year, or the ratio in nominal terms (not adjusted for inflation) of GDP to the money supply. It is a residual number, not otherwise open to calculation or independent surveying.
Velocity has theoretical significance. In combination with money-supply growth, it should be a driving force behind inflation. Yet, since velocity is a ratio of two not-particularly-well or realistically-measured numbers, its actual estimate is of limited value. As an inflation predictor, it has to be viewed in the context of accompanying money-supply growth, and vice versa, generally as a coincident indicator. Again, full definitions can be found in the Money Supply Special Report.
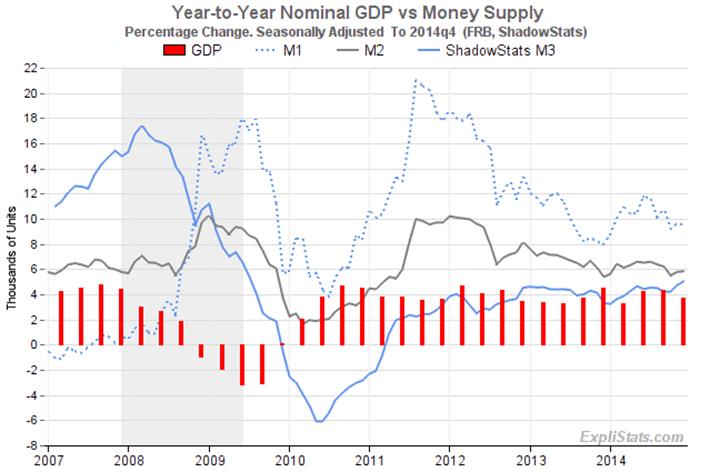
Comparative changes in year-to-year growth rates in nominal GDP and the nominal money supply that generate the relative changes in the velocity numbers are shown here in the preceding graph, courtesy of ShadowStats affiliate www.ExpliStats.com.
__________
REPORTING DETAIL
GROSS DOMESTIC PRODUCT—GDP (Fourth-Quarter 2014, First or "Advance" Estimate)
Headline GDP Reporting Still Is Not Credible, But Downside Revisions Likely Loom. Discussed recently, and in the pending Special Report, headline GDP reporting is not been credible. Second- and third-quarter growth estimates were the strongest in more than a decade. The headline growth for fourth-quarter 2014, although slower than the boom in the two prior quarters, was not credible, either, as suggested by a quick review of contributing factors in the Growth-Distribution section in the Opening Comments. While downside revisions to earlier periods await the July 30, 2015 annual GDP revisions, the headline fourth-quarter growth estimate likely will revise lower in the next two months of reporting.
[Note: The next six paragraphs largely are repeated from the Opening Comments.] Headline fourth-quarter GDP growth came in at 2.6%, shy of the expected 3.2% [Bloomberg], but still strong enough to support President Obama’s "risen from recession" comments in the State of the Union Address. Of some note, today’s (January 30th) headline "advance" reporting reversed the patterns seen with the reporting of the "advance" second- and third-quarter 2014 estimates. Then, the initial Bureau of Economic Analysis (BEA) guesstimates topped consensus expectations, meaningfully, and the initial estimates were revised successively higher. In contrast, the initial estimate of first-quarter 2014 GDP came in sharply below expectations, and it was revised successively lower, deeper into negative territory. The headline reporting for the fourth-quarter GDP, suggested that there are downside revisions ahead, perhaps into flat-to-minus territory by the March 27th revision.
As noted in Commentary No. 689, the BEA literally was guessing the fourth-quarter GDP growth rate with its initial estimate, where the Bureau still lacked full quarterly information on factors such as the trade deficit, inventories and construction spending. Unless it saw evidence for sharply higher or lower growth than the consensus outlook, it would tend to target the consensus outlook for the "advance" reporting. Accordingly, an initial estimate sharply above or below the consensus would tend to indicate where the BLS saw the revised reporting going, and would tend to signal the likely direction of the first revision. Again, this morning’s headline growth estimate was reported at 2.6%, versus a 3.2% consensus.
Of further note, recent BEA revisions to initial GDP estimates have been unusually volatile, signaling new instabilities in the reporting system. Beyond historical changes in reporting methodology that have built upside biases into headline GDP growth, a special-purpose political manipulation appears to have been a factor in recent and current reporting, likely tied to the impact of the Affordable Care Act (ACA). An economic depressant, not a stimulus, the ACA is not easily quantifiable, given the extremely poor-quality of the data available. Of the headline 2.6% growth just reported, roughly 0.8% of that was tied to the ACA in some manner.
Underlying economic reality and likely activity in the year ahead will be explored in some depth in the February 2nd Special Commentary. Otherwise, as discussed frequently by ShadowStats, GDP remains the most-worthless and the most-heavily modeled, massaged and politically-manipulated of government economic series. The headline GDP does not reflect properly or accurately the changes to the underlying fundamentals that drive the economy. Independent data generally support ShadowStats contentions that the U.S. economy never recovered from the recession, and that current business activity is stagnant and trending to the downside. Broad economy began to turn down in 2006 and 2007, plunged into 2009, entered a protracted period of stagnation thereafter—never recovering—and then began to turn down anew in recent quarters (see 2014 Hyperinflation Report—The End Game Begins – First Installment Revised, and 2014 Hyperinflation Report—Great Economic Tumble – Second Installment.
__________________
Notes on GDP-Related Nomenclature and Definitions
For purposes of clarity and the use of simplified language in the text of the GDP analysis, here are definitions of several key terms used related to GDP reporting:
Gross Domestic Product (GDP) is the headline number and the most widely followed broad measure of U.S. economic activity. It is published quarterly by the Bureau of Economic Analysis (BEA), with two successive monthly revisions, and with an annual revision in the following July.
Gross Domestic Income (GDI) is the theoretical equivalent to the GDP, but it generally is not followed by the popular press. Where GDP reflects the consumption side of the economy and GDI reflects the offsetting income side. When the series estimates do not equal each other, which almost always is the case, since the series are surveyed separately, the difference is added to or subtracted from the GDI as a “statistical discrepancy.” Although the BEA touts the GDP as the more accurate measure, the GDI is relatively free of the monthly political targeting the GDP goes through.
Gross National Product (GNP) is the broadest measure of the U.S. economy published by the BEA. Once the headline number, now it rarely is followed by the popular media. GDP is the GNP net of trade in factor income (interest and dividend payments). GNP growth usually is weaker than GDP growth for net-debtor nations. Games played with money flows between the United States and the rest of the world tend to mute that impact on the reporting of U.S. GDP growth.
Real (or Constant Dollars) means the data have been adjusted, or deflated, to reflect the effects of inflation.
Nominal (or Current Dollars) means growth or level has not been adjusted for inflation. This is the way a business normally records revenues or an individual views day-to-day income and expenses.
GDP Implicit Price Deflator (IPD) is the inflation measure used to convert GDP data from nominal to real. The adjusted numbers are based on “Chained 2009 Dollars,” as introduced with the 2013 comprehensive revisions, where 2009 is the base year for inflation. “Chained” refers to the substitution methodology which gimmicks the reported numbers so much that the aggregate of the deflated GDP sub-series missed adding to the theoretically-equivalent deflated total GDP series by $41.8 billion in “residual,” as of the initial estimate of second-quarter 2013.
Quarterly growth, unless otherwise stated, is in terms of seasonally-adjusted, annualized quarter-to-quarter growth, i.e., the growth rate of one quarter over the prior quarter, raised to the fourth power, a compounded annual rate of growth. While some might annualize a quarterly growth rate by multiplying it by four, the BEA uses the compounding method, raising the quarterly growth rate to the fourth power. So a one percent quarterly growth rate annualizes to 1.01 x 1.01 x 1.01 x 1.01 = 1.0406 or 4.1%, instead of 4 x 1% = 4%.
Annual growth refers to the year-to-year change of the referenced period versus the same period the year before.
__________________
Gross Domestic Product (GDP). Published today, January 30th, by the Bureau of Economic Analysis (BEA), the first estimate of fourth-quarter 2014 GDP reflected statistically-insignificant, real (inflation-adjusted), annualized, quarterly headline growth of 2.6% (2.64% at the second decimal point) +/- 3.5% (95% confidence interval). That followed headline annualized real growth of 4.97% in third-quarter 2014, 4.59% real growth in second-quarter 2014, and contraction of 2.11% (-2.11%) in first-quarter 2014. All these numbers face likely significant downside revisions in the annual benchmarking of July 30, 2015. Distribution of the headline quarterly GDP growth is detailed in the Opening Comments.
Shown in the accompanying graphs, headline year-to-year growth in real fourth-quarter 2014 GDP was 2.48%, versus 2.70% in third-quarter 2014, 2.59% annual growth in the second-quarter 2014, and 1.89% in the first-quarter 2014. Year-to-year growth in fourth-quarter 2013 was 3.13%.
The latest quarterly year-to-year growth remained below the near-term peak of 3.13% seen in fourth-quarter 2013. The current-cycle trough in annual change was in second-quarter 2009, at a 4.09% pace of decline (-4.09%). That was the deepest year-to-year contraction for any quarterly GDP in the history of the series, which began with first-quarter 1947.
In terms of annual average growth, average real 2014 GDP was up by 2.42 % over 2013, which, in turn was up by 2.22% over 2012. The annual decline in real activity of 2.78% (-2.78%) in 2009 was the deepest since the 11.58% (-11.58%) plunge in the 1946 post-war production shutdown. War disruptions excluded, the headline 2009 decline was the worst since the economic plunge of 3.31% (-3.31%) in 1938, the second down leg of the Great Depression.
The first graph following shows current year-to-year quarterly detail, from 2000-to-date, where the second graph shows the same series in terms of its full quarterly history. The third graph shows the plot of historical average annual real growth, also for the full history of the series.

Implicit Price Deflator (IPD). As general guidance, the weaker the inflation rate used in deflating an economic series, the stronger will be the resulting inflation-adjusted growth. The first estimate of fourth-quarter 2014 GDP inflation, or the implicit price deflator (IPD), was at an annualized quarter-to-quarter rate of contraction of 0.09% (-0.09%), versus annualized inflations of 1.38% in third-quarter 2014, 2.15% in second-quarter 2014, and 1.33% in first-quarter 2014.
The unusual fourth-quarter 2014 contraction in the IPD means that real fourth-quarter growth of 2.64% actually was higher than the nominal fourth-quarter growth of 2.55%.
Year-to-year, fourth-quarter 2014 IPD inflation was 1.19%, versus 1.57% in third-quarter 2014, 1.64% in second-quarter 2014, 1.37% in first-quarter 2014, and 1.40% in fourth-quarter 2013.
Annual average IPD inflation was 1.44% in 2014, versus 1.49% in 2013.
For comparison, on a seasonally-adjusted, annualized quarter-to-quarter basis, CPI-U inflation published by the Bureau of Labor Statistics (BLS) contracted by 1.20% (-1.20%) in fourth-quarter 2014, versus a gains of 1.10% in third-quarter 2014, 3.03% in second-quarter 2014, and 1.91% in first-quarter 2014.
Unadjusted, year-to-year quarterly inflation was 1.25% in fourth-quarter 2014, versus 1.78% in third-quarter 2014, 2.05% in second-quarter 2014, 1.41% in first-quarter 2014, and 1.23% in fourth-quarter 2013
Annual average CPI-U was 1.62% in 2014 versus 1.46% in 2013.
Gross National Product (GNP) and Gross Domestic Income (GDI) Reporting Delayed Due to Usual Lack of Meaningful Data. Given the poor-quality of broad economic data available, year-end reporting tradition has been to delay the initial fourth-quarter and annual estimates of Gross National Product (GNP) and Gross Domestic Income (GDI), until the second revision of the fourth-quarter GDP (March 27th, this year). Such a delay in GDP reporting would be of value, as well, given the usual lack of significance to the early headline reporting.
GNP is the broadest measure of U.S. economic activity, where GDP is GNP net of trade flows in factor income (interest and dividend payments). As a reporting gimmick aimed at boosting the headline reporting of economic growth for net-debtor nations such as Greece and the United States, international reporting standards were shifted some decades back to reporting headline GDP instead of GNP.
GDI is the theoretical income-side equivalent of the consumption-side GDP estimate. The GDP and GDI are made to equal each other, every quarter, with the addition of a “statistical discrepancy” to the GDI-side of the equation, but the discrepancy just as easily could be added to the GDP number.
ShadowStats-Alternate GDP. The ShadowStats-Alternate GDP estimate for fourth-quarter 2014 GDP was a year-to-year contraction of 1.6% (-1.6%) versus the headline fourth-quarter GDP gain of 2.5%. Those fourth-quarter 2014 estimates were against a ShadowStats estimated 1.7% (-1.7%) year-to-year contraction and a headline year-to-year gain of 2.7% in third-quarter 2014 GDP (see the Alternate Data tab).
While annualized real quarterly growth is not estimated formally on an alternate basis, the headline 2.6% annualized quarter-to-quarter initial gain for fourth-quarter 2014 likely was much weaker, flat-to-minus, net of all the regular reporting gimmicks. Some downside revision may follow in next month’s GDP reporting, but the July 30, 2015 annual benchmark revision remains the most likely vehicle for moving recent, gimmicked headline growth to more-reasonable levels. An actual quarterly contraction appears to have been a realistic possibility for the real GDP in most quarters since the official, second-quarter 2009 end to the 2007 recession.
Adjusted for understated inflation and other methodological changes—such as the inclusion of intellectual property, software and recent accounting for the largely not-measurable and questionable impact of the Affordable Care Act (ACA)—the business downturn that began in 2006/2007 is ongoing; there has been no meaningful economic rebound. The “corrected” real GDP graph, and the longer-term “corrected” graph updated from 2014 Hyperinflation Report—Great Economic Tumble – Second Installment (see the Opening Comments section) are based on the removal of the impact of hedonic quality adjustments that have reduced the reporting of official annual GDP inflation by roughly two-percentage points. It is not the same measure as the ShadowStats-Alternate GDP, which reflects reversing additional methodological distortions (“Pollyanna Creep”) of recent decades.
__________
WEEK AHEAD
Against Overly-Optimistic Expectations, Economic Releases and Revisions in the Months Ahead Should Trend Much Weaker; Inflation Releases Should Be Increasingly Stronger after the Impact of Temporary Oil-Price Declines. Shifting some to the upside, again, from the downside, amidst wide fluctuations in the numbers, market expectations for business activity remain overly optimistic in the extreme. They exceed any potential, underlying economic reality. Downside corrective revisions and an accelerating pace of downturn in broad-based headline economic reporting should hammer those expectations in the next several months. Recent GDP excesses, however, will not face downside revisions until the July 30, 2015 benchmark revision to that series (see today’s Opening Comments).
Headline consumer inflation—dominated by gasoline and other oil-price related commodities—should hit a near-term bottom in the next two months or. Significant upside inflation pressures should resume when oil prices begin their rebound, a process that should be accelerated rapidly by an eventual sharp downturn in the exchange-rate value of the U.S. dollar. These areas, the general economic outlook and longer range reporting trends are reviewed broadly in the pending Special Commentary.
A Note on Reporting-Quality Issues and Systemic-Reporting Biases. Significant reporting-quality problems remain with most major economic series. Beyond gimmicked changes to reporting methodologies of the last several decades, ongoing headline reporting issues are tied largely to systemic distortions of seasonal adjustments. Data instabilities were induced partially by the still-evolving economic turmoil of the last eight years, which has been without precedent in the post-World War II era of modern economic reporting. The severity and ongoing nature of the downturn provide particularly unstable headline economic results, when concurrent seasonal adjustments are used (as with retail sales, durable goods orders, employment, and unemployment data). Combined with recent allegations (see Commentary No. 669 of Census Bureau falsification of data in its monthly Current Population Survey (the source for the Bureau of Labor Statistics’ Household Survey), these issues have thrown into question the statistical-significance of the headline month-to-month reporting for many popular economic series.
PENDING RELEASES:
Construction Spending (December 2014). The Commerce Department will release its estimate of December 2014 construction spending on Monday, February 2nd. The detail will be covered by ShadowStats in Commentary No. 693 of Thursday, February 5th.
The headline monthly changes, as usual, should not be statistically significant, while previous data will be subject to large and unstable revisions. Most frequently, revisions here are to the downside. Irrespective of almost perpetually-positive market expectations for this series, the detail tends to be in down-trending stagnation, net of inflation.
U.S. Trade Balance (December 2014). The Commerce Department and Bureau of Economic Analysis (BEA) will release their estimate of the December 2014 trade deficit on Thursday, February 5th.
As noted in the Opening Comments, the net export account subtracted more from GDP growth than was suggested by November trade deficit reporting; the impact should have been about neutral. So, there could be some "surprise" widening in the real merchandise trade deficit in the pending December number. Otherwise the December trade shortfall and revisions to the November detail were likely to have set a sharply negative tone for the first revision (February 27th) to the initial growth estimate of fourth-quarter 2014 GDP. Next month’s trade revisions most likely will have negative GDP-revision impact, as well.
Trade-data implications for GDP revisions will be discussed along with the detail from headline release of the December trade numbers.
While there may be some continued narrowing of the nominal December trade deficit—before inflation adjustment—thanks to the continued decline in oil prices, the important consideration for the real, inflation-adjusted GDP impact is the change in the real merchandise-trade deficit. The effects of low oil prices are backed out of those calculations.
The general trend going forward should be for regular monthly and quarterly deteriorations in the real trade deficit, despite any short-lived narrowing of the nominal shortfall. The latter circumstance will end once the current downtrend in oil prices has run its course.
Employment and Unemployment (January 2015)—Headline Detail versus Payroll and Population Revisions. The Bureau of Labor Statistics (BLS) will release its January 2015 labor data on Friday, February 6th. The release will encompass the monthly payroll data in the context of the annual benchmark revision to payroll employment.
Annual revisions to population assumptions also will alter key household survey numbers (unemployment related), making them not comparable to December 2014 reporting. Such is in addition to the return of not-comparable reporting of the seasonally-adjusted, month-to-month household survey numbers, due to BLS reporting practices surrounding its use of concurrent seasonal factor adjustments (see Commentary No. 686).
Accordingly, almost anything can come out of the January headline reporting. Underlying economic fundamentals suggest ongoing deterioration in the broader unemployment rates such as U.6 and the ShadowStats Alternate Unemployment measure, as well slowing or negative month-to-month growth in headline payrolls.
Absolutely Meaningless Headline Changes in U.3. In terms of the unemployment rate, though, whatever is reported for the headline U.6 will have no consistency or comparable meaning with December’s 5.6% headline number. There will be no practical meaning—other than for market or political hype—of a headline monthly gain or decline (the early consensus) in the January U.6 rate versus December.
Benchmark Wildcard Always a Possibility with Payrolls. The preliminary announcement of the benchmark revision to March 2014 payrolls was for a relatively insignificant upside adjustment of 7,000 for that month [a gain of 47,000 in aggregate private payrolls versus a loss of 40,000 (-40,000) in aggregate government payrolls]. The net benchmark revision was the smallest in memory and was preliminary. The changes will be massaged into the aggregate payroll data from March 2013 through the January 2015, to be published on February 6th. The aggregate impact on historical payroll reporting should be close to nil, but surprises in how the benchmarking is applied have been seen over the years, particularly after seasonal adjustments.
The preliminary 7,000 jobs gain was the net balance of revisions across various employment categories, with gains seen in areas such as Construction (89,000), Information (65,000), Manufacturing (44,000) and Other (60,000), being offset by reductions in areas such as Professional and Business Services (-151,000), Education and Health Services (-72,000), Trade, Transportation and Utilities (-18,000) and Natural Resources and Mining (-16,000). The initial announcement was covered in Commentary No. 660.
With the benchmark revisions, published headline gains going back in time will be revised, but they still will not be consistent month-to-month. Potential surprises await not only in payroll levels, but also in patterns of monthly change in the payrolls.
Monthly Bias Is Outdated before the January Headline Reporting. As published previously by ShadowStats-affiliate www.ExpliStats.com, in its analysis of the biases built into the concurrent-seasonal-factor modeling of December 2014 payroll employment, the implied built-in bias trend was for a January 2015 headline jobs gain of 245,000, versus the near-consensus headline reporting of 252,000 in December. Although early-consensus for the January payroll gain appears to be below that trend number, the trend was based on pre-benchmark data and will be outdated against the benchmark estimates to be published. The new trend estimate for February will reflect the revamped system.
Both Unemployment and Payroll Employment Remain Open to Surprises. With anything possible in this January reporting, consider the underlying fundamentals, which will shine through eventually. Such would favor weaker-than-expected payrolls gains, and higher-than-expected unemployment rates.
If the headline January 2015 U.3 unemployment rate should decline month-to-month, there likely would be additional labor-force loss associated with those relative headline numbers. The broader U.6 and ShadowStats unemployment measures still would tend to hold, or increase anew, at their broader and higher respective levels. In general, again, all the Labor Department data will be unsettled this month and could come in anywhere.
__________