No. 698: Annual Revisions to Seasonally-Adjusted CPI
COMMENTARY NUMBER 698
Annual Revisions to Seasonally-Adjusted CPI
February 20, 2015
__________
Slower Real Economic Activity Signaled by
CPI Seasonal-Adjustment Revisions
Using Intervention Analysis, the Bureau of Labor Statistics
Shifted Some Gasoline Deflation from Fourth- to Second-Quarter 2014
Headline Drop in December CPI-U Narrowed in Revision to
Minus 0.3% (-0.3%) from Minus 0.4% (-0.4%)
___________
PLEASE NOTE: Today’s annual revisions to CPI seasonal adjustments had implications for next week’s reporting of real-retail sales and earnings and potentially for the first revision to fourth-quarter GDP. Accordingly, the new detail is covered briefly in this unplanned Commentary, rather than holding the analysis for the release of the January CPI on the 26th. Otherwise, the schedule has not changed.
The next regular Commentary, planned for Thursday, February 26th, will cover the January consumer price index (CPI), real-retail sales and earnings, new orders for durable goods and new- and existing-home sales, followed by Commentary on Friday, February 27th, covering the first revision, second estimate of fourth-quarter 2014 GDP.
The U.S. Treasury advises that its Financial Report of the United States Government, Fiscal Year 2014 is set to be released on February 26th at 3 p.m., Washington, D.C. time. If publication follows as planned—prior history has seen occasional, unannounced flexibility in the Treasury’s deadlines—initial ShadowStats observations should follow in the February 27th Commentary, with a more-complete assessment of the 2014 GAAP accounting likely in the first week of March. Specifics will follow, once the statements have been released.
Best wishes to all — John Williams
CONSUMER PRICE INDEX (CPI-U)
ANNUAL REVISIONS TO SEASONAL ADJUSTMENTS
Annualized Fourth-Quarter CPI-U Contraction Revised to 0.85% (-0.85%) from 1.20% (-1.20%). The Bureau of Labor Statistics (BLS) published its annual revisions today (February 20th) for the Consumer Price Index (CPI-U and CPI-W), restating monthly headline-inflation history from January 2010 through December 2014. The seasonally-adjusted series generates the both the headline month-to-month and annualized quarter-to-quarter changes for consumer inflation, while the annual or year-to-year inflation numbers standardly are taken from the not-seasonally-adjusted CPI-U and CPI-W series, which never are revised. The broader of the two main series is the CPI-U, as discussed regularly in the CPI Commentaries (see for example Commentary No. 688).
Reflected in the first graph, the seasonally-adjusted, annualized-quarterly pace of fourth-quarter 2014 CPI-U inflation was a relatively stronger (less negative) headline inflation number, in revision. What had been an annualized contraction of 1.20% (-1.20%), revised to a contraction of 0.85% (-0.85%). Relatively stronger CPI-U inflation yields relatively weaker real (inflation-adjusted) growth in those economic series deflated by the CPI-U.
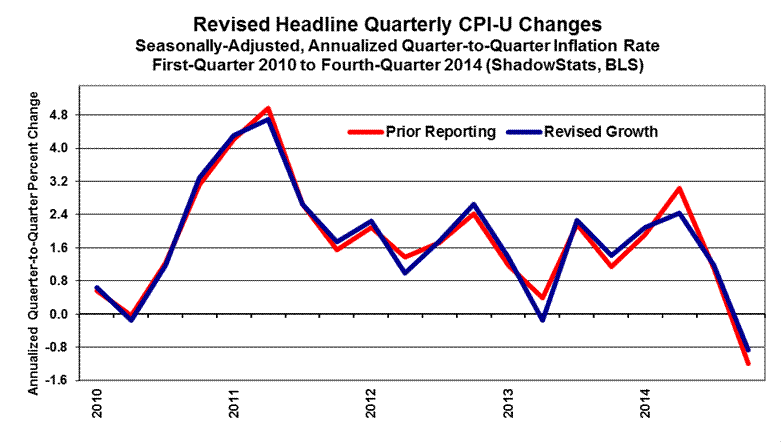
For example, what had been a headline annualized gain of 3.12% in fourth-quarter real-retail sales, slowed in revision to 2.76%, due to the CPI revision. A similar effect should be seen with real earnings (deflated by the CPI-W), which will be updated and revised along with real-retail sales for January 2015, coincident with the headline release of the January 2015 CPI numbers on Thursday, February 26th. In contrast, headline, annualized second-quarter 2014 inflation revised lower, from 3.03% to 2.44%, with the effect of boosting growth in revision in that quarter, for related deflated economic series.
The revised relative increase in fourth-quarter 2014 CPI should find some correlation with the implicit price deflator used in deflating the GDP. This has implications for a downside revision to headline fourth-quarter GDP growth. Where the CPI revisions affect more than one quarter, though, such is most likely to surface in the July 30th GDP benchmark revision, instead of the February 27th first-revision to fourth-quarter GDP.
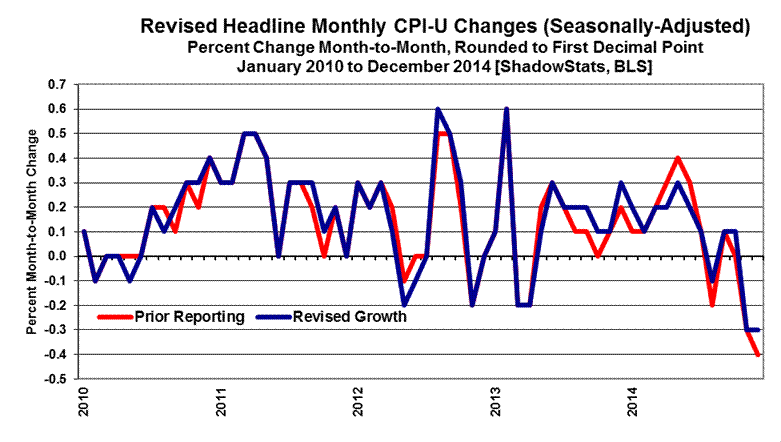

Shown in the preceding two graphs are the seasonally-adjusted headline CPI-U growth revisions, by month. An initial headline monthly contraction of 0.4% (-0.4%) in December 2014 was revised to a contraction of 0.3% (-0.3%). At the second decimal point, that was revised from a monthly contraction of 0.37% (-0.37%) to a decline of 0.33% (-0.33%). The BLS only headlines the single-decimal-point number, which is the basis for the first graph. The second graph shows the revisions without rounding.
The headline monthly CPI-U inflation changes in 2014 (at the first decimal point only) were revised up by 0.1% in January, unrevised in February and March, revised lower by 0.1% (-0.1%) in each of April, May and June, unrevised in July and August and November, and revised by up 0.1% in each of September October and December. The corresponding, annualized-quarterly inflation rates were revised gains of 2.09% (previously 1.91%) in first-quarter 2014, up by 2.44% (previously 3.03%) in the second-quarter, up by 1.18% (previously 1.10%) in the third-quarter, and a revised, annualized fourth-quarter contraction of 0.85% (-0.85%), which previously had been down by 1.20% (-1.20%).
BLS Used "Intervention Analysis" to Alter Headline Gasoline-Inflation Patterns. When market price swings become highly volatile in unusual circumstances, and normal seasonal-adjustment patterns may not be appropriate for adjusting the "seasonally adjusted" data, the BLS uses intervention analysis. This tool is an accommodation for trying to make sensible patterns out of extraordinary circumstances.

The BLS indicated today that it had used intervention analysis for gasoline prices (all grades) in late-2014 (and likely ongoing in January 2015) due to unusual price pressures from "weak global demand along with increased supply from continued growth in North American crude production." Such was the first use of the procedure for gasoline, since it was used to offset "… the response in crude oil markets to the worldwide economic downturn in 2008." The effects can be seen in the preceding graph.
Further detail will follow in the February 26th Commentary No. 699, covering the headline release of the January 2015 CPI.
The ShadowStats Alternate Inflation Measures are not affected by these revisions. As with the year-to-year inflation reported with the unadjusted CPI-U series, the ShadowStats measures are expressed in terms of year-to-year change, based on unadjusted data.
[Full detail on the CPI-U revisions and headline January 2015 detail, with various drill-down and graphics options, will be available to subscribers on February 26th, at ShadowStats affiliate: www.ExpliStats.com.]
__________
WEEK AHEAD
Headline Reporting and Revisions Should Trend Much Weaker versus an Overly-Optimistic Economic Consensus; Inflation Will Rise Anew, Following the Bottoming of Oil-Prices. Shifting some to the downside, again, amidst wide fluctuations in the numbers, market expectations for business activity remain overly optimistic in the extreme. They exceed any potential, underlying economic reality. Downside corrective revisions and an accelerating pace of downturn in broad-based, monthly headline economic reporting should hammer those expectations heavily through mid-year. Recent GDP excesses will not face downside revisions until the July 30, 2015 GDP benchmark revision, other than for the two monthly revisions still pending for fourth-quarter 2014 GDP.
Headline consumer inflation—recently driven lower by collapsing prices for gasoline and other oil-price related commodities—likely hit a near-term low in what will be headline January 2015 reporting. Significant upside inflation pressures should resume as oil prices begin to rebound, a process that already appears to be underway, and one that would accelerate rapidly with an eventual sharp downturn in the exchange-rate value of the U.S. dollar. These areas, the general economic outlook and longer range reporting trends are reviewed broadly in No. 692 Special Commentary: 2015 - A World Out of Balance.
A Note on Reporting-Quality Issues and Systemic-Reporting Biases. Significant reporting-quality problems remain with most major economic series. Beyond gimmicked changes to reporting methodologies of the last several decades, ongoing headline reporting issues are tied largely to systemic distortions of seasonal adjustments. Data instabilities were induced partially by the still-evolving economic turmoil of the last eight years, which has been without precedent in the post-World War II era of modern-economic reporting. The severity and ongoing nature of the downturn provide particularly unstable headline economic results, when concurrent seasonal adjustments are used (as with retail sales, durable goods orders, employment, and unemployment data, see Commentary No. 695). Combined with recent allegations of Census Bureau falsification of data in its monthly Current Population Survey (the source for the Bureau of Labor Statistics’ Household Survey), these issues have thrown into question the statistical-significance of the headline month-to-month reporting for many popular economic series (see Commentary No. 669).
PENDING RELEASES (Updated Text Is Underlined for the CPI and GDP):
Existing- and New-Home Sales (January 2015). January 2015 existing-home sales are due for release on Monday, February 23rd, from the National Association of Realtors, with the January 2015 new-home sales report due from the Census Bureau on Wednesday, February 25th. ShadowStats will cover both series in the planned February 26th regular Commentary No. 699.
Still impaired by the negative, fundamental pressures similar to those seen pummeling housing construction (see the related Housing Starts and Structural Liquidity Issues sections in this Commentary), the outlook for home-sales activity remains bleak.
Recent negative trends in headline monthly reporting of existing-home sales likely persisted in January, despite a minimal gain in December, with flat-to-downside month-to-month activity likely in headline reporting.
Smoothed for extreme and nonsensical monthly gyrations, a pattern of stagnation or intensifying downturn also appears to be in play for January new-home sales, following a statistically-insignificant headline gain in December. While monthly changes in activity rarely are statistically-significant for this series, still-unstable reporting and revisions (both likely to the downside) remain a fair bet for January sales. Both the new- and existing-home sales series increasingly should reflect downside instabilities in their respective headline activity.
Updated: Consumer Price Index—CPI (January 2015). The January 2015 CPI is scheduled for release on Thursday, February 26th, by the Bureau of Labor Statistics (BLS). The headline CPI-U should contract sharply month-to month, likely down by 0.6% (-0.6%) plus-or-minus, which would be enough to take annual CPI-U inflation into flat-to-minus territory. The downturn in inflation once again will reflect a heavy hit from dropping gasoline prices.
Early market expectations for the headline monthly contraction in the January 2015 CPI-U seem to range around minus 0.6% (-0.6%) to minus 0.8% (-0.8%), and such numbers easily could be seen. With oil and gasoline prices beginning to bottom out in February, however, so too should the heavily-negative impact of gasoline prices on the headline CPI-U begin to reverse in the month or two ahead.
Plunging again, average retail gasoline prices fell by 16.11% (-16.11%) month-to-month in January 2015, on a not-seasonally-adjusted basis, per the Department of Energy (DOE). While BLS seasonal adjustments to gasoline prices will be negative in January, the BLS also has indicated the recent use of "intervention analysis" (see earlier discussion), which could mitigate some of the headline downside pressure, minimally. By itself, the adjusted decline in gasoline prices would leave headline CPI-U down by roughly 0.7% (-0.7%).
Higher food and “core” (net of food and energy) inflation should offset some of the negative energy prices, again, favoring a headline monthly contraction of about 0.6% (-0.6%) in the January 2015 CPI-U.
Annual Inflation Rate. Year-to-year, CPI-U inflation would increase or decrease in January 2015 reporting, dependent on the seasonally-adjusted monthly change, versus a revised, adjusted 0.18% (previously 0.14%) monthly inflation gain reported for January 2014. The adjusted change is used here, since that is how consensus expectations are expressed. To approximate the annual unadjusted inflation rate for January 2015, the difference in January’s headline monthly change (or forecast of same), versus the year-ago monthly change, should be added to or subtracted directly from the December 2014 annual inflation rate of 0.76%. For example, if headline monthly CPI-U declined by 0.6% (-0.6%) in January 2015, annual CPI-U inflation likely would be close to "unchanged."
Pending Revisions and Redefinitions to various CPI Series. The BLS will redefine the CPI-U and the Chained-CPI-U series, and it published today (see earlier text) revised seasonal adjustments to CPI-U history back five years (the historical, unadjusted CPI-U series never gets revised). The seasonal-adjustment changes did not alter the broad, annual-inflation picture; they have no impact on the unadjusted numbers.
Discussed in the Opening Comments of Commentary No. 668, pending BLS changes to the calculation of consumer inflation seem to be designed to help set-up the C-CPI-U as an intensified, reduced-inflation measure. The new C-CPI-U is intended as a practical inflation measure to meet the political demands of those in Congress and the White House looking to reduce the cost-of-living-adjustment (COLA) for Social Security, etc., simply by defining away inflation as the average person looks at it (see these BLS links: CPI Changes, C-CPI-U Changes).
Enhancing the substitution effects of price changes on consumption patterns, the new C-CPI-U should measure even-greater reduced headline inflation. Changes include replacing "geometric weightings" with a more-aggressive and adjustable "constant elasticity of substitution," along with more-frequent weightings, all aimed at making the C-CPI-U the new low-cost cost of living adjustment (COLA) for government programs.
Where the changes are expected per the BLS "not to have significant effect" or where "impact of these changes on the All Items U.S. City Average [CPI-U] level is expected to be minimal," the BLS usually is more specific. The effect on the C-CPI-U likely will be meaningful, or the changes being made would not be made. As more detail becomes available, such will be updated in the regular CPI-related Commentaries and in the Public Commentary on Inflation Measurement.
New Orders for Durable Goods (January 2015). Reporting of January 2015 new orders for durable goods also is scheduled for Thursday, February 26th, by the Census Bureau. Net of the irregular activity in commercial aircraft orders, aggregate orders likely continued a pattern of stagnation.
Aircraft orders are booked for the long-term—years in advance—so they have only limited impact on near-term production. Further, by their nature, these types of orders do not lend themselves to seasonal adjustment. Accordingly, the durable goods measure that best serves as a leading indicator to broad production—a near-term leading indicator of economic activity—is the activity in new orders, ex-commercial aircraft. Net of extreme volatility in commercial-aircraft orders of recent months, new orders have been reasonably stagnant and, again, should remain stagnant-to-down in headline January reporting.
Updated: Gross Domestic Product—GDP (Fourth-Quarter 2014, First Revision, Second Estimate). The Bureau of Economic Analysis (BEA) will publish its second estimate of fourth-quarter 2014 GDP on Friday, February 27th. Market expectations keep slipping towards an ever-larger downside revision to the initial headline growth estimate of 2.6%. Not only is a downside revision a good bet, but also reporting risks should remain to the downside of wherever the consensus will settle, this time around. Specific elements related to the GDP revisions were discussed earlier in the CPI revisions detail, in the Opening Comments of prior Commentary No. 697, and in Commentary No. 696.
Where underlying fundamentals suggest a fourth-quarter growth rate something on the plus-side of flat, revisions down to that level may not be seen until the July 30th benchmark revision.
In recent reporting, BEA revisions to initial GDP estimates have been unusually volatile, signaling instabilities in the reporting system likely tied to the impact of the Affordable Care Act. The ACA is an economic depressant, not a stimulus, and it is not easily quantifiable, given the extremely poor-quality of the data available. Discussed frequently by ShadowStats, the GDP remains the most-worthless, guessed-at, politically-manipulated and heavily-massaged of the major economic series put out by the various U.S. statistical bureaus.
Separately, given the poor-quality of the broad economic data available, the year-end reporting tradition has been to delay the initial fourth-quarter estimates of Gross National Product (GNP) and Gross Domestic Income (GDI) until the second revision of the fourth-quarter GDP (March 27th). Those revisions usually are published with the first-revisions to other quarters. GDP is a component of the broader GNP measure, which includes the trade balance in factor income (interest and dividend payments), while GDP is the consumption-side equivalent to the income-side GDI.
__________