No. 705: February Housing Starts, Consumer Liquidity, GDP Outlook
COMMENTARY NUMBER 705
February Housing Starts, Consumer Liquidity, GDP Outlook
March 17, 2015
__________
First-Quarter GDP Outlook Weakened Further
February Housing Starts Continued a Pattern of Down-Trending Stagnation
Collapsing Headline Housing Starts Reflected a Weak Economy,
Horrible Weather and the Usual Monthly-Reporting Instabilities
Primary Economic Toxin Remains Lack of Healthy Consumer Liquidity
___________
PLEASE NOTE: The next regular Commentary, scheduled for Tuesday, March 24th, will cover the February CPI and related real retail sales and earnings, and new- and existing-home sales, followed by a Commentary on March 25th, covering new orders for durable goods, and a Commentary on March 27th, covering the third estimate of fourth-quarter 2014 GDP.
Best wishes to all — John Williams
OPENING COMMENTS AND EXECUTIVE SUMMARY
Outlook for First-Quarter GDP Growth Continued to Dim. Economic reporting of the next month increasingly should move the consensus economic outlook towards a contracting first-quarter 2015 GDP. With the exception of increasingly distorted and poor-quality labor data (see Commentary No. 702), underlying economic detail of the last month or two has turned ever-more negative. That pattern of deteriorating economic reporting should intensify, going forward, with the global markets eventually recognizing that the U.S. economy has fallen into a "new" recession. Such a circumstance has horrendous implications for the domestic and global financial markets and systems (see No. 692 Special Commentary: 2015 - A World Out of Balance).
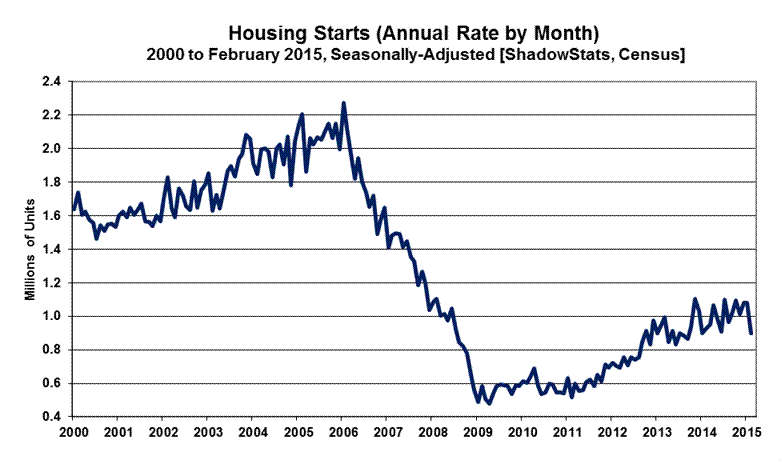
Headline monthly housing-starts reporting does not get much worse than it did in February 2015, but the series rarely is of substance in terms of headline monthly change, and the latest month’s activity was hit by unusually-severe weather. Nonetheless, the report was much weaker than consensus, a headline decline of 17.0% (-17.0%), versus an expected decline of 3.1% (-3.1%) [Bloomberg]. Reflecting generally weakening economic conditions, the stagnating, six-month moving averages for the various housing-starts series turned down with the new detail.
The trending, annualized-quarterly growth rate in the aggregate housing-starts numbers has moved from a positive 13.4% in fourth-quarter 2014, to a negative 25.0% (-25.0%) in first-quarter 2015 (based on January and February). Although that likely will moderate some with March reporting, real first-quarter construction growth still should contract, placing additional downside pressure on the outlook for real growth in first-quarter 2015 GDP ("advance" estimate due for release on April 29th).
The deteriorating construction picture is in conjunction with pending hits to first-quarter GDP from a widening trade deficit (see Commentary No. 702) and likely first-quarter contractions in real retail sales (see Commentary No. 703) and industrial production (see Commentary No. 704). Discussed separately in the Week Ahead section, there also is risk of potential further downside revision to headline fourth-quarter 2014 GDP growth in its "final" pre-July 30th benchmark revision, on March 27th.
Today’s Missive (March 17th). The balance of today’s Commentary concentrates on the specifics of the February 2015 housing starts and an updated review of consumer liquidity conditions. The Week Ahead section previews next week’s reporting of the February CPI, new- and existing home sales, new orders for durable goods and the third estimate of fourth-quarter 2014 GDP.
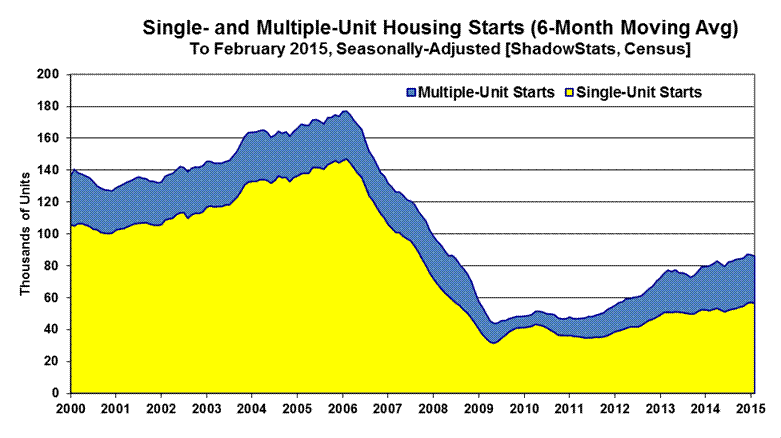
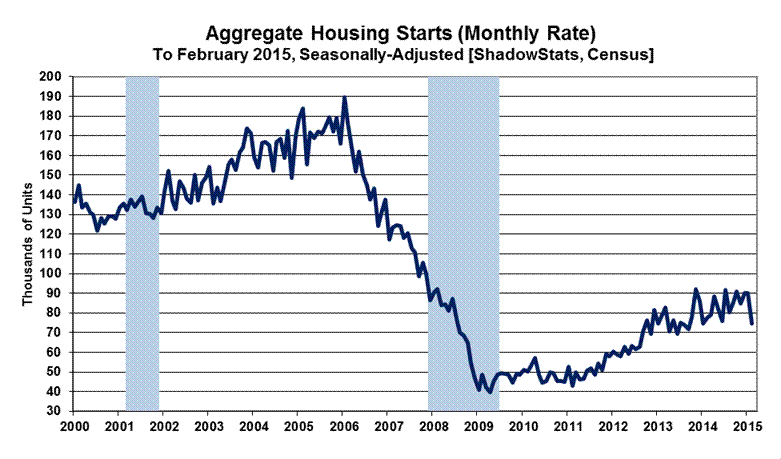
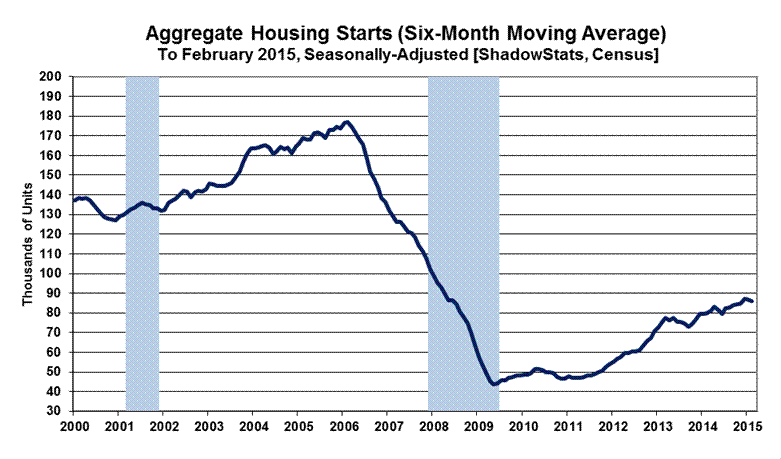
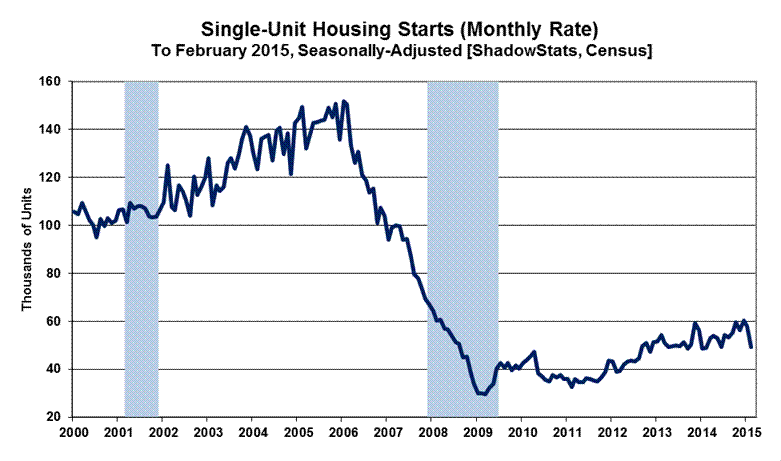
Housing Starts—February 2015—General Pattern of Weakening Stagnation Continued, as Headline Activity Plunged with Bad Weather and the Usual Bad Reporting. In the context of an upside revision to January activity and usual monthly reporting instabilities, and in the context of unusually-bad weather that hit much of the nation, headline housing starts plunged by a statistically-significant 17.0% (-17.0%) in February 2015. Nonetheless, a general pattern of weakening stagnation likely continued in this series, as best viewed in terms of the longer-range historical graph of aggregate activity in the Reporting Detail section, and in the context of the down-trending activity—smoothed by six-month moving averages—as shown in the accompanying graphs of this section.
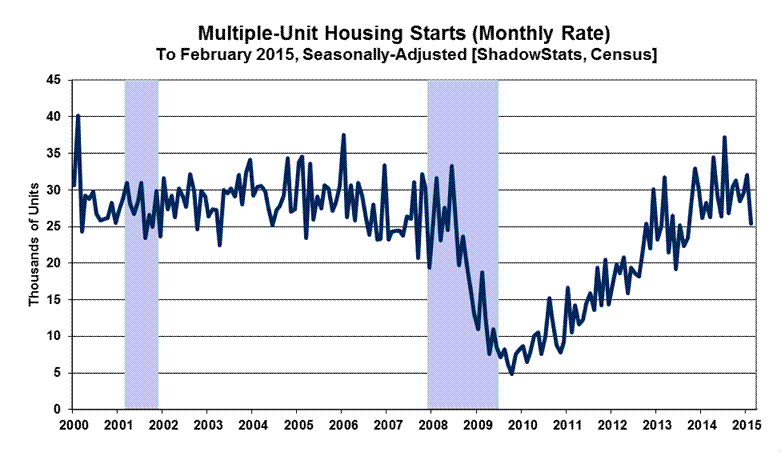
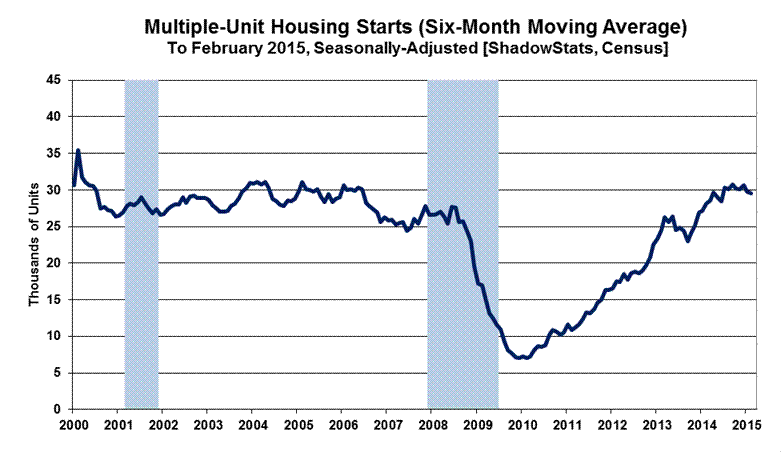
Reflected in those smoothed graphs, the aggregate housing-starts series continued in broad stagnation in February, dominated, as usual, by the personal housing sector (single-unit starts). Although there had been a minor upside trend in the aggregate series, total housing-starts activity has remained well below any recovery level. The bulk of the extreme reporting instability and the minimal uptrend in the aggregate series, over time, has been due largely to particularly-volatile reporting in the multiple-unit housing-starts category (apartments, etc.). Where activity in multiple-unit starts actually recovered in 2014 to the general range of pre-recession activity, that process appears to have topped out, with those starts now trending lower in monthly reporting, including on a six-month moving-average basis. Still, the recent recovery in multiple-unit activity largely was lost in the detail of total housing starts.
Structural Liquidity Issues Constrain Consumer Housing Activity. Again, on a per structure basis, activity in housing starts is dominated by the single-unit housing starts category, which has remained stagnant—at a low level of activity—since hitting bottom in early-2009. The private housing sector never recovered from the business collapse of 2006 into 2009. The fundamental problem here remains intense, underlying, structural-liquidity woes besetting the consumer, as updated in the Consumer Liquidity section, following, and detailed otherwise in No. 692 Special Commentary: 2015 - A World Out of Balance.
Quarterly Growth Has Turned Sharply Lower. Based on the latest revisions and February headline reporting, annualized fourth-quarter 2014 growth (same way GDP growth is reported) slowed from initial headline reporting of 18.7%, to 14.3% and now to 13.4%. Using January and February 2015 as a surrogate for first-quarter 2015 activity, annualized first-quarter 2015 growth is on track to contract at an annualized pace of 25.0% (-25.0%).
February 2015 Housing-Starts Headline Detail. February 2015 housing starts showed a statistically-significant, seasonally-adjusted headline monthly decline of 17.0% (-17.0%), following a revised monthly "unchanged" reading for January 2015 and a revised gain of 6.5% in December. Net of prior-period revisions, the headline February 2015 change was a still-significant decline of 15.8% (-15.8%).
Year-to-year change in the seasonally-adjusted, aggregate February 2015 housing-starts measure was a statistically-insignificant decline of 3.3% (-3.3%), versus a revised 20.5% gain in January 2015, and a revised 4.6% gain in December 2014.
The headline February 2015 monthly decline of 17.0% (-17.0%) was dominated by a headline monthly drop of 14.9% (-14.9%) in the "one unit" category, with a plunge of 21.6% (-21.6%) in the “five units or more” category, but only the changes in the aggregate and one-unit categories were statistically-significant.
By-Unit Category. Where the irregular housing starts series can show varying patterns, that partially is due to a reporting mix of residential construction products, with the largest physical-count category of one-unit structure housing starts—generally for individual consumption, resulting in new home sales—versus multi-unit structure starts that generally reflect the building of rental and apartment units.
Housing starts for single-unit structures in February 2015 fell month-to-month by a statistically-significant 14.9% (-14.9%), following revised January decline of 3.9% (-3.9%), and a revised December gain of 7.6%. February 2015 single-unit structures showed a statistically-insignificant year-to-year annual gain of 0.7%, following a revised annual gain of 19.6% in January 2015, and a revised 7.4% gain in December 2014.
Housing starts for apartment buildings (generally 5-units-or-more) in February 2015 fell-month-to-month by a statistically-insignificant 21.6% (-21.6%), following a revised gain of 12.8% in January, and a revised monthly gain of 1.2% in December. The February 2015 year-to-year decline of 9.5% (-9.5%) was statistically-insignificant, following a revised 23.9% gain in January 2015, and a revised year-to-year decline of 0.1% (-0.1%) in December 2014.
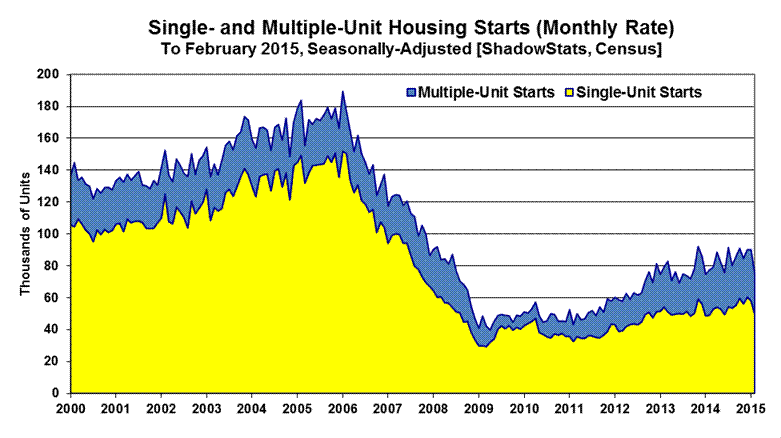
Expanding the multi-unit structure housing starts category to include 2-to-4-units plus 5-units-or-more usually reflects the bulk of rental- and apartment-unit activity. The Census Bureau does not publish estimates of the 2-to-4-units category, due to statistical significance problems (a general issue for the aggregate series). Nonetheless, the total multi-unit category can be calculated by subtracting the single-unit category from the total category.
Accordingly, the February 2015 monthly decline of 17.0% (-17.0%) in aggregate housing starts was composed of a decline of 14.9% (-14.9%) in one-unit structures, combined with a statistically-insignificant monthly drop of 20.8% (-20.8%) in the multiple-unit structures category (2-units-or-more, including the 5-units-or-more category). The two graphs preceding, and those that follow, all are related.
Graphs of Housing-Starts Activity. The following six graphs of monthly detail for the housing-starts series show starts activity for the aggregate series, for single-unit structures and for multiple-unit structures, both in terms of monthly detail and in terms of six-month moving averages of that detail.
Looking beyond the irregular and large month-to-month headline variations due to poor-quality surveying and occasional weather issues, the smoothed graphs (using six-month moving averages) generally show a broad pattern of economic plunge into 2009 followed by stagnation, not the purported economic recovery as shown with the GDP (see No. 692 Special Commentary: 2015 - A World Out of Balance). This is true of the aggregate housing starts series and its dominant component of single-unit housing starts. The more volatile multiple-unit housing starts series had recovered its pre-recession high, but it now appears to have topped out.
Headline reporting of housing starts activity is expressed by the Census Bureau as an annualized monthly pace of starts, which was 897,000 in February 2015, versus a revise 1,081,000 (previously 1,065,000) in January 2015, and a revised 1,081,000 (previously 1,087,000, initially 1,089,000) in December 2014. Those annualized numbers are reflected in the detail of the scales in the aggregate graphs at the end of the Reporting Detail section.
Nonetheless, given the nonsensical monthly volatility in reporting and the exaggerated effect of annualizing the monthly numbers in this unstable series, the magnitude of monthly activity and the changes in same, more realistically are reflected at the non-annualized monthly rate. Consider that the headline 184,000 month-to-month decline in housing starts, from January 2015 to February 2015, was larger than any actual total (non-annualized) monthly starts level for a single month, since before the recession.
Accordingly, the monthly rate of 74,750 units in February 2015, instead of the annualized 897,000-headline number, is used in the scaling of the series of graphs in these Opening Comments. With the use of either scale of units, however, appearances of the graphs and the relative monthly, quarterly and annual percentage changes are otherwise identical.
The record monthly low seen for the present aggregate series was in April 2009, where the annualized monthly pace of sales then was down 79% (-79%) from the January 2006 pre-recession peak. Against the downside-spiked low in April 2009, the February 2015 headline number was up by 88%, but it still was down by 61% (-61%) from the January 2006 series high. Shown in the historical perspective of the post-World War II era, current activity is trending stagnant at levels that otherwise have been at the historical troughs of recession activity of the last 70 years, as seen in the last graph of the Reporting Detail section.

Consumer Liquidity Problems—Toxic to Construction Activity and the Broad Economy. Discussed regularly in these Commentaries and in some detail in No. 692 Special Commentary: 2015 - A World Out of Balance, without real (inflation-adjusted) growth in income and without the ability or willingness to take on meaningful new debt, the consumer simply has not had the wherewithal to fuel sustainable economic growth. Impaired consumer liquidity and its direct restraints on consumption have dominated the last eight-plus years of economic turmoil, driving the housing-market collapse and ongoing stagnation in consumer-related real estate and construction activity, as well as constraining retail sales activity and the related, dominant personal-consumption-expenditures category of the GDP. Those sectors account for more than 70% of GDP activity.
Updated here are the consumer-sentiment and consumer-credit-outstanding detail, along with the most-recent consumer-sentiment and median household income series, published previously. Underlying economic fundamentals simply have not supported, and do not support a turnaround in broad economic activity. There has been no economic recovery, and there remains no chance of meaningful, broad economic growth, without a fundamental upturn in consumer- and banking-liquidity conditions.
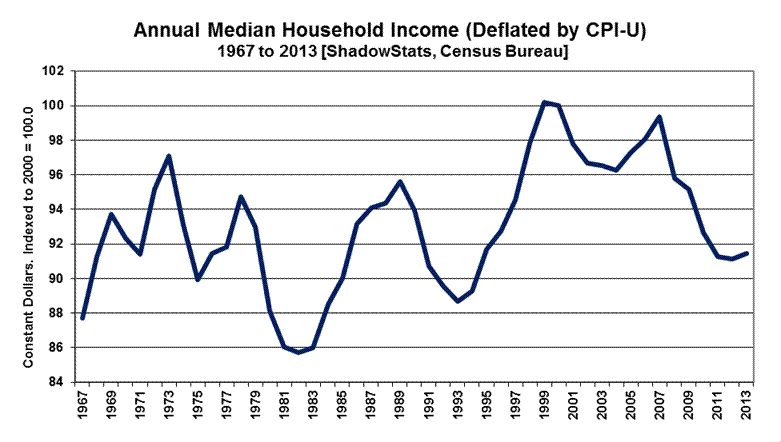
Consider the following charts. The first graph plots monthly real median household income through January 2015, as reported by www.SentierResearch.com. The series has continued in low-level stagnation, remaining near its cycle low, despite some recent up-trending in month-to-month volatility. The recent relative "strength" was boosted by temporary, gasoline-price-driven , headline month-to-month contractions in CPI-U reporting, culminating in a headline monthly drop in the January CPI of 0.7%, which accounted for the inflation-adjusted monthly increase in January 2015 real median income.
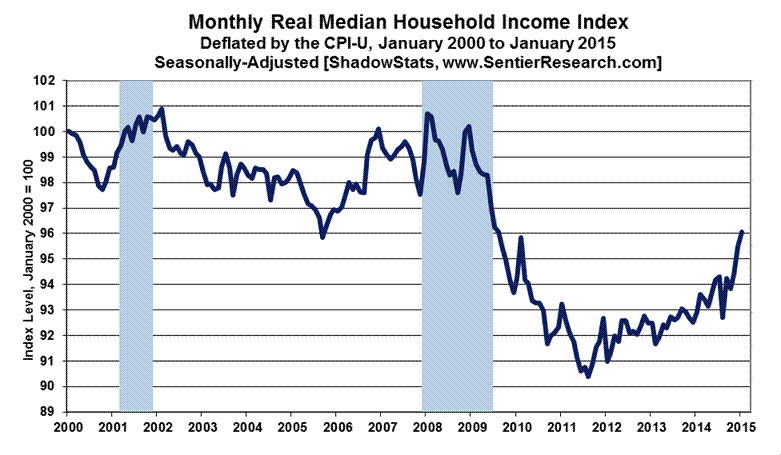
While lower gasoline prices have provided minimal liquidity relief to consumers, there is mounting evidence that any extra cash is being used to pay down unsustainable debt, not to fuel new consumption. Relief from low-priced gasoline likely will prove fleeting.
On a monthly basis, when headline GDP purportedly started its solid economic recovery in mid-2009, household income plunged to new lows and has yet to recover its recession or pre-recession highs either for the 2007 recession or the 2001 recession.
Shown in the second graph, the same series, published by the Census Bureau on an annual basis, deflated by headline CPI-U, confirmed that latest 2013 annual real median household income continued to hold at a low level of activity. In historical perspective, 2011, 2012 and 2013 income levels were below levels seen in the late-1960s and early-1970s. Such indicates the long-term nature of the evolution of the major structural changes squeezing consumer liquidity and impairing the current economy. Further discussion of these issues is found in No. 692 Special Commentary and in Commentary No. 658.
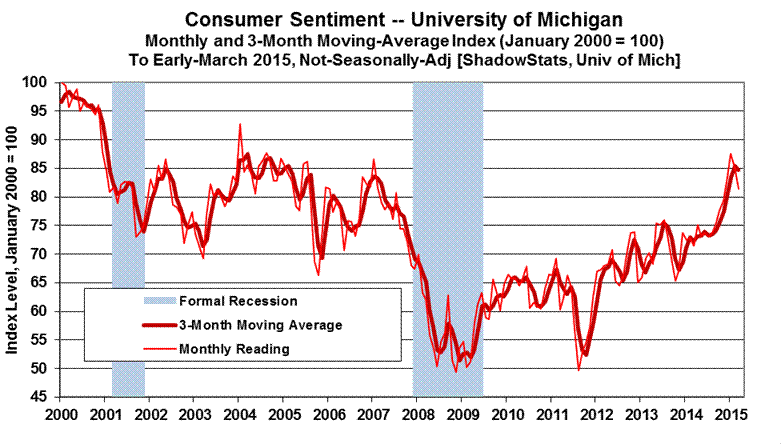
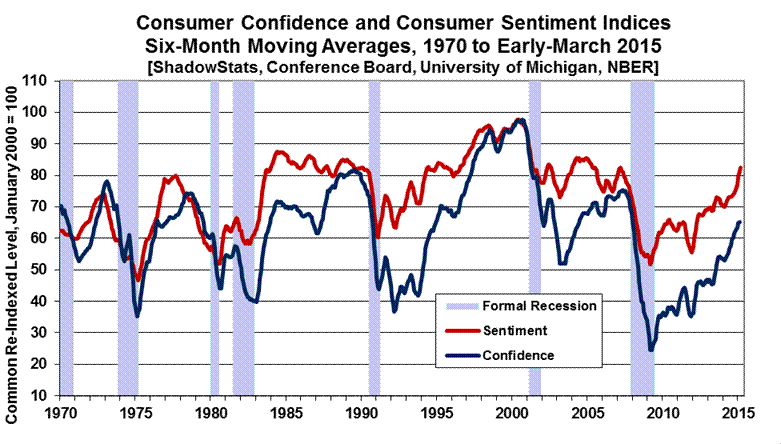
Shown in the next three graphs, both the Conference Board’s Consumer Confidence Index through February 2015, and the University of Michigan’s Consumer Sentiment Index through early-March 2015 (the early-month measure is of limited surveying scope), have moved lower in the latest reporting. Both series had jumped in headline, monthly reporting for January 2015, but both numbers pulled back with the February readings, and for the early-March reading on sentiment
The confidence and sentiment series tend to mimic the tone of headline economic reporting in the press, and often are highly volatile month-to-month, as a result. Smoothed for irregular, short-term volatility, however, they still remain at levels seen typically in recessions. As suggested in the third graph following, as plotted for the last 40 years, the latest readings of confidence and sentiment have not recovered levels that preceded any of the formal recessions of the last 40 years, and generally remain well below, or are inconsistent with, periods of historically-strong economic growth that would rival recent booming, headline GDP gains.

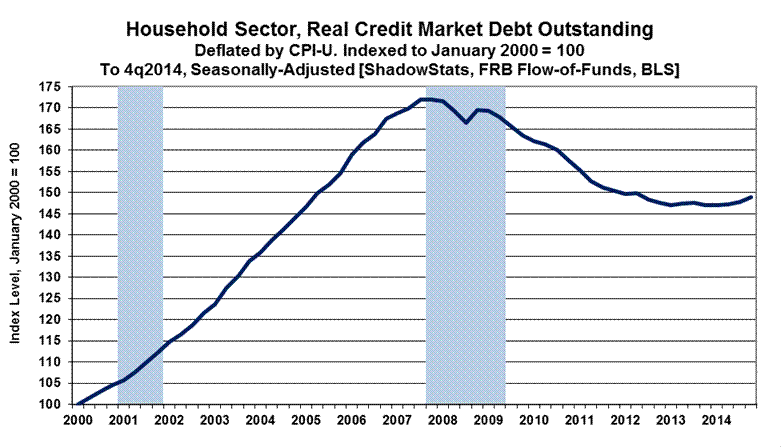
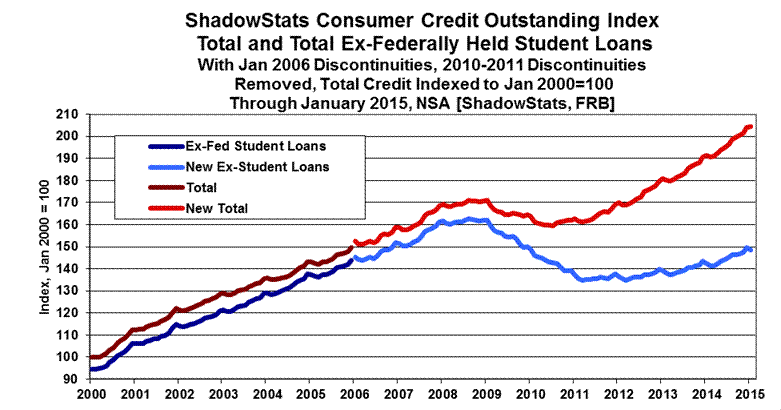
The final two graphs in this section address consumer borrowing. Debt expansion can help to make up for a shortfall in income growth. Shown in the first graph of Household Sector, Real Credit Market Debt Outstanding, household debt declined in the period following the Panic of 2008, and it has not recovered. The series includes mortgages, automobile and student loans, credit cards, secured and unsecured loans, etc., and is deflated by the headline CPI-U. The level of real debt outstanding has remained stagnant for several years, reflecting, among other issues, lack of normal lending by the banking system into the regular flow of commerce. The graph has been updated through fourth-quarter 2014, reflecting recently published flow-of-funds data from the Federal Reserve.
The second graph shows the regular plot of nominal consumer credit outstanding, updated through January 2015. Post-2008 Panic, it has continued to be dominated by growth in federally-held student loans, not in bank loans to consumers that otherwise would fuel broad consumption growth. Before any consideration for inflation, the nominal level of consumer credit outstanding (ex-student loans) has not rebounded or recovered since the onset of the recession. These disaggregated data are available and plotted only on a not-seasonally-adjusted basis.
Again, consumer liquidity woes remain the basic constraint on broad economic activity in the United States, which tends to be consumer oriented. Without real growth in income and/or debt expansion and willingness to take on new debt; and with consumer confidence and sentiment at levels consistent with a significant portion of consumers under financial stress; there has been no basis for a sustainable economic expansion since the Panic of 2008, and there are no prospects for a recovery in the near future.
[The Reporting Detail section contains further background material on February housing starts. Various drill-down and graphics options on the headline residential construction numbers are available to subscribers at our affiliate: www.ExpliStats.com.]
__________
HYPERINFLATION WATCH
HYPERINFLATION OUTLOOK SUMMARY
Economic and Inflation Outlooks Unchanged, Continuing to Unfold. [Note: The text in this section is as published in the prior Commentary, other than for possible updated internal links or references.]
No. 692 Special Commentary: 2015 - A World Out of Balance of February 2, 2015 updated the Hyperinflation 2014 reports and the broad economic outlook. Previously, the long-standing hyperinflation and economic outlooks were updated with the publication of 2014 Hyperinflation Report—The End Game Begins – First Installment Revised, on April 2, 2014, and publication of 2014 Hyperinflation Report—Great Economic Tumble – Second Installment, on April 8, 2014. The outlooks also are updated regularly in the weekly Commentaries. The Opening Comments of No. 692 should be considered in terms of recent circumstances and near-term, proximal triggers for massive dollar selling. The two 2014 Hyperinflation Report installments, however, remain the primary background material for the hyperinflation and economic analyses and forecasts.
Primary Summary. Current fiscal conditions show the effective long-term insolvency of the U.S. government, a circumstance that usually would be met by unfettered monetization of the national debt and obligations, leading to an eventual hyperinflation. The 2008 Panic and near-collapse of the financial system, and official (U.S. government and Federal Reserve) response to same, pulled the elements of the eventual hyperinflation crisis at the end of this decade into the current period. The primary and basic summary of the broad outlook and the story of how and why this fiscal, financial and economic crisis has unfolded and developed over the years—particularly in the last decade—is found in the Opening Comments and Overview and Executive Summary of that First Installment Revised (linked earlier). The following summarizes the underlying current circumstance and recent developments.
Consistent with the above Special Commentaries, the unfolding economic circumstance, in confluence with other fundamental issues, should place mounting and massive selling pressure on the U.S. dollar, as well as potentially resurrect elements of the 2008-Panic. Physical gold and silver, and holding assets outside the U.S. dollar, remain the primary hedges against the pending total loss of U.S. dollar purchasing power, despite sharp and generally ongoing rally in the U.S. dollar’s exchange rate since mid-2014 and broadly related selling pressures in the gold and silver markets.
Current relative U.S. economic strength and the relative virtuousness of Fed monetary policy versus major U.S. trading partners are seriously over-estimated (see Commentary No. 703). A crash back to recognition of realistic domestic-economic circumstances likely will be accompanied by a crash in the U.S. dollar versus major currencies, such as the Swiss franc, Canadian dollar and Australian dollar; related rallies in precious metals and oil; and related sell-offs in the domestic stock and bond markets. Further, a sharp deterioration in near-term domestic U.S. political stability continues to develop and is of meaningful near-term risk for triggering heavy selling of the dollar.
Current Economic Issues versus Underlying U.S. Dollar Fundamentals. U.S. economic activity is turning down anew, despite overstated growth in recent GDP reporting. GDP and other major economic series face heavy downside-benchmark revisions through the end of July. Weak, underlying economic reality also should become increasingly and painfully obvious to the financial markets in the reporting and revisions of the weeks and months ahead for series such as retail sales, production (see Opening Comments), the trade deficit and payroll employment.
As financial-market expectations shift towards renewed or deepening recession, that circumstance, in confluence with other fundamental issues, particularly deteriorating domestic political conditions, should reverse recent buying pressures, to mounting and massive selling pressures against the U.S. dollar, as well as potentially to resurrect elements of the Panic of 2008.
Unexpected economic weakness intensifies the known stresses on an already-impaired banking system, increasing the perceived need for expanded, not reduced, quantitative easing (see Commentary No. 703). The highly touted "tapering" by the FOMC ran its course. Future, constructive Fed behavior—purportedly moving towards normal monetary conditions in the currently unfolding, near-perfect economic environment—is pre-conditioned by a continued flow of "happy" economic news. Suggestions that all is right again with world are nonsense. The Panic of 2008 never has been resolved, and the Fed soon will find that it has no easy escape from its quantitative easing (QE3), which continues. Only overt expansion of QE3 ceased; QE4 will become the question.
The economy has not recovered; the banking system is far from stable and solvent; and the Federal Reserve and the federal government still have no way out. Significant banking-system and other systemic (i.e. U.S. Treasury) liquidity needs will be provided, as needed, by the Fed, under the ongoing political cover of a weakening economy—a renewed, deepening contraction in business activity. The Fed has no choice. Systemic collapse is not an option for the Board of Governors. This circumstance simply does not have a happy solution.
Accordingly, any renewed market speculation as to an added round of Federal Reserve quantitative easing, QE4, could become a major factor behind crashing the dollar and boosting the price of gold. The Fed has strung out its options for propping up the system as much as it could, with continual, negative impact on the U.S. economy. The easings to date, however, appear to have been largely a prop to the increasingly unstable equity markets.
In the event of a QE4, any resulting renewed boost to U.S. equities would be a fleeting illusion, at least in terms of real value (purchasing power of the dollar). Such gains would tend to be losses, in real terms, with the stocks valued in terms of Swiss francs, for example, or valued against what would become a rapidly-increasing pace of domestic U.S. inflation.
Unexpected economic weakness also savages projections of headline, cash-based, federal-budget deficits (particularly the 10-year versions) as well as projected funding needs for the U.S. Treasury. Current fiscal "good news" is from cash-based, not GAAP-based and accounting projections.
All these crises should combine against the U.S. dollar, likely in the very-near future. That said, recent faux market perceptions of domestic economic, financial-system and monetary tranquility have boosted the U.S. dollar’s strength significantly in global trading and have contributed to savaging the prices of oil and in weakening the prices of precious metals.
The recent shift in the Swiss franc due to the elimination of the effective pegging of the franc to the euro and, by default to the U.S. dollar, also had had the effect of allowing some upside movement in the dollar prices of gold and silver. Recent intensified weakness in the euro, however, has led to increasingly negative domestic Swiss interest rates and interventions aimed at depressing the franc. Such policies usually prove to be fleeting, due to significant undesired side effects on the domestic economy and in financial-market distortions.
Again, strength in the U.S. dollar should reverse, in the context of underlying reality outlined here and in the sections that follow. The actual fundamental problems threatening the U.S. dollar could not be worse. The broad outlook has not changed; it is just a matter of market perceptions shifting anew, against the U.S. currency. That process, again, started with the shift in Swiss National Bank policy. Key issues include, but are not limited to:
· A severely damaged U.S. economy, which never recovered post-2008, is turning down anew and shows no potential for recovery in the near-term. The circumstance includes a renewed widening in the trade deficit (see Commentary No. 702), as well as ongoing severe, structural-liquidity constraints on the consumer, which are preventing a normal economic rebound in the traditional, personal-consumption-driven U.S. economy (see Commentary No. 703). Sharply-negative economic reporting shocks, versus unrealistically-positive consensus forecasts, remain a heavily-favored, proximal trigger for the pending dollar debacle.
· U.S. government unwillingness to address its long-term solvency issues. Those controlling the U.S. government have demonstrated not only a lack of willingness to address long-term U.S. solvency issues, but also the current political impossibility of doing so. The shift in control of Congress does not appear to have altered the systemic unwillingness to address the underlying fundamental issues, specifically to bring the GAAP-based deficit into balance. Any current fiscal "good news" comes from cash-based, not GAAP-based accounting projections. The GAAP-based version continues to run around $5 trillion for the annual shortfall, while those in Washington continue to increase spending and to take on new, unfunded liabilities. The history and issues here are explored in the first installment of the Hyperinflation Report, as previously linked; the initial fiscal-2014 details were discussed in Commentary No. 672, and the official GAAP-based financial statements for 2014 will be discussed fully, soon (see Commentary No. 702).
· Monetary malfeasance by the Federal Reserve, as seen in central bank efforts to provide liquidity to a troubled banking system, and also to the U.S. Treasury. Despite the end of the Federal Reserve’s formal asset purchases, the U.S. central bank monetized 78% of the U.S. Treasury’s fiscal-2014 cash-based deficit (see Commentary No. 672). The quantitative easing QE3 asset purchase program effectively monetized 66% of the total net issuance of federal debt to be held by the public during the productive life of the program (beginning with the January 2013 expansion of QE3). The monetization process was completed with the Federal Reserve refunding the interest income it earned on the Treasury securities to the U.S. Treasury. With highly tenuous liquidity conditions for the banking system and the Treasury, it would not be surprising in this period of increasing instability to see covert Federal Reserve activities masked in the purchases of Treasury debt by nations or other entities financially friendly to or dependent upon the United States. Renewed expansion to quantitative easing remains likely, given ongoing banking-system stresses, vulnerable stock markets and weakening, actual U.S. economic activity. As has been commonplace, the Fed likely would seek political cover for new or expanded systemic accommodation in any "renewed" economic distress.
· Mounting domestic and global crises of confidence in a dysfunctional U.S. government. The positive rating by the public of the U.S. President tends to be an indicative measure of this circumstance, usually with a meaningful correlation with the foreign-exchange-rate strength of the U.S. dollar. The weaker the rating, the weaker tends to be the U.S. dollar. The positive rating for the President is off its historic low, but still at levels that traditionally are traumatic for the dollar. Chances of a meaningful shift towards constructive cooperation between the White House and the new Congress, in addressing fundamental issues appear to be nil. Issues such as non-recovered, faltering economic activity and the consumer liquidity crisis, and addressing the nation’s long-range solvency issues still could devolve rapidly into an extreme political crisis.
· Mounting global political pressures contrary to U.S. interests. Downside pressures on the U.S. currency generally are mounting, or sitting in place, in the context of global political and military developments contrary to U.S. strategic, financial and economic interests. Current conditions include the ongoing situation in Ukraine versus Russia and extremely-volatile circumstances in the Middle East. U.S. response to the Ukrainian situation may be behind part of the recent strength in the U.S. dollar and related weakness in oil prices, with U.S. actions aimed at causing financial distress for Russia. The situation has yet to run its full course, and it has the potential to reverse rapidly.
· Spreading global efforts to dislodge the U.S. dollar from its primary reserve-currency status. Active efforts or comments against the U.S. dollar continue to expand. In particular, anti-dollar rhetoric and actions have been seen with Russia, China, France, India and Iran, along with some regular rumblings in OPEC and elsewhere. Recent dollar strength may have bought some time versus those who have to hold dollars for various reasons. Nonetheless, any short-term instability and a quick reversal in the dollar’s strength could intensify the "dump-the-dollar" rhetoric rapidly.
When the selling pressure breaks massively against the U.S. currency, the renewed and intensifying weakness in the dollar will place upside pressure on oil prices and other commodities, boosting domestic inflation and inflation fears. Domestic willingness to hold U.S. dollars will tend to move in parallel with global willingness, or lack of willingness, to do the same. These circumstances will trigger the early stages of a hyperinflation, likely in the year ahead.
Both the renewed dollar weakness and the resulting inflation spike should boost the prices of gold and silver, where physical holding of those key precious metals remains the ultimate hedge against the pending inflation and financial crises. Investors need to preserve the purchasing power and liquidity of their wealth and assets during the hyperinflation crisis ahead. Again, see Chapter 10, 2014 Hyperinflation Report—Great Economic Tumble for detailed discussion on approaches to handing the hyperinflation crisis.
__________
REPORTING DETAIL
RESIDENTIAL CONSTRUCTION—HOUSING STARTS (February 2015)
A General Pattern of Weakening Stagnation Continued in February Starts, as Headline Activity Plunged with Bad Weather and the Usual Bad Reporting. In the context of an upside revision to January activity and usual monthly reporting instabilities, and in the context of unusually-bad weather that hit much of the nation, headline housing starts plunged by a statistically-significant 17.0% (-17.0%) in February 2015. Nonetheless, a general pattern of weakening stagnation likely continued in this series, as best viewed in terms of the longer-range historical graph of aggregate activity, seen at the end of this section, and in the context of the down-trending activity, smoothed by six-month moving averages, as shown in graphs of the Opening Comments section.
Reflected in those smoothed graphs, the aggregate housing-starts series continued in broad stagnation in February, dominated, as usual, by the personal housing sector (single-unit starts). Although there had been a minor upside trend in the aggregate series, total housing-starts activity has remained well below any recovery level. The bulk of the extreme reporting instability and the minimal uptrend in the aggregate series, over time, has been due largely to particularly-volatile reporting in the multiple-unit housing-starts category (apartments, etc.). Where recent activity in multiple-unit starts actually recovered into the general range of pre-recession activity, that process appears to have topped out, with those starts now trending lower in monthly reporting, including on a six-month moving-average basis. Still, the recent impact of the recovery in multiple-unit activity largely was lost in the detail of total housing starts.
Structural Liquidity Issues Constrain Consumer Housing Activity. Again, on a per structure basis, activity in housing starts is dominated by the single-unit housing starts category, which has remained stagnant—at a low level of activity—since hitting bottom in early-2009. The private housing sector never recovered from the business collapse of 2006 into 2009.
The underlying problem here remains intense, structural-liquidity woes besetting the consumer. That circumstance, during the last seven-plus years of economic collapse and stagnation, has continued to prevent a normal recovery in broad U.S. business activity, as updated in the Opening Comments and discussed and detailed in No. 692 Special Commentary: 2015 - A World Out of Balance.
Without real growth in income, and without the ability and/or willingness to offset declining purchasing power with debt expansion, the consumer lacks the ability to fuel traditional, consumption-based growth or recovery in U.S. economic activity, including not only residential investment and related construction spending, but also retail sales and the still-dominant personal-consumption account of the GDP.
Quarterly Growth Has Turned Sharply Lower. Based on the latest revisions and February headline reporting, annualized fourth-quarter 2014 growth (same way GDP growth is reported) slowed from initial headline reporting of 18.7%, to 14.3% and now to 13.4%. Using January and February 2015 as a surrogate for first-quarter 2015 activity, annualized first-quarter 2015 growth is on track to contract at an annualized pace of 25.0% (-25.0%). With initial January 2015 reporting, the first cut on annualized first-quarter growth had been for a gain of just 0.1%.
February 2015 Housing-Starts Headline Reporting. The Census Bureau reported today, March 17th, a statistically-significant, seasonally-adjusted headline monthly decline of 17.0% (-17.0%) +/- 11.1% (all such confidence intervals are at the 95% level) in February 2015 housing starts. The February drop followed a revised monthly "unchanged" reading for January 2015 [previously down by 2.0% (-2.0%)], and a revised gain of 6.5% [previously up by 7.1%, initially up by 4.4%] in December. Net of prior-period revisions, the headline February change was a statistically-significant decline of 15.8% (-15.8%).
Year-to-year change in the seasonally-adjusted, aggregate February 2015 housing-starts measure was a statistically-insignificant decline of 3.3% (-3.3%) +/- 14.6%, versus a revised 20.5% [previously 18.7%] gain in January, and a revised 4.6% [previously 5.1%, initially 5.3%] gain in December.
The headline February 2015 monthly decline of 17.0% (-17.0%) was dominated by a headline monthly drop of 14.9% (-14.9%) in the "one unit" category, with a plunge of 21.6% (-21.6%) in the “five units or more” category, but only the changes in the aggregate and "one unit" categories were statistically-significant.
By-Unit Category (See Graphs in the Opening Comments). Where the irregular housing starts series can show varying patterns, that partially is due to a reporting mix of residential construction products, with the largest physical-count category of one-unit structure housing starts—generally for individual consumption, resulting in new home sales—versus multi-unit structure starts that generally reflect the building of rental and apartment units.
Housing starts for single-unit structures in February 2015 fell month-to-month by a statistically-significant 14.9% (-14.9%) +/- 11.7%, following revised January decline of 3.9% (-3.9%) [previously down by 6.7% (-6.7%)], and a revised December gain of 7.6% [previously up by 7.9%, initially up by 7.2%]. February 2015 showed a statistically-insignificant year-to-year annual gain of 0.7% +/- 14.0%, following a revised annual gain of 19.6% [previously up by 16.3%] in January 2015, and a revised 7.4% gain [previously up by 7.7%, initially 7.9%] in December 2014.
Housing starts for apartment buildings (generally 5-units-or-more) in February 2015 fell-month-to-month by a statistically-insignificant 21.6% (-21.6%) +/- 24.6%, following a revised gain of 12.8% [previously up by 12.1%] in January, and a revised monthly gain of 1.2% [previously up by 2.4%, initially down by 4.2% (-4.2%)] in December. The February 2015 year-to-year decline of 9.5% (-9.5%) +/- 31.8% was statistically-insignificant, following a revised 23.9% [previously 24.5%] gain in January 2015, and a revised year-to-year decline of 0.1% (-0.1%) [previously and initially an annual gain of 0.3%] in December 2014.
Expanding the multi-unit structure housing starts category to include 2-to-4-units plus 5-units-or-more usually reflects the bulk of rental- and apartment-unit activity. The Census Bureau does not publish estimates of the 2-to-4-units category, due to statistical significance problems (a general issue for the aggregate series). Nonetheless, the total multi-unit category can be calculated by subtracting the single-unit category from the total category.
Accordingly, the statistically-significant February 2015 monthly decline of 17.0% (-17.0%) in aggregate housing starts was composed of a statistically-significant decline of 14.9% (-14.9%) in one-unit structures, combined with a statistically-insignificant monthly drop of 20.8% (-20.8%) in the multiple-unit structures category (2-units-or-more, including the 5-units-or-more category). Again, these series are graphed in the Opening Comments section.
Housing Starts Graphs. Headline reporting of housing starts activity is expressed by the Census Bureau as an annualized monthly pace of starts, which was 897,000 in February 2015, versus a revise 1,081,000 (previously 1,065,000) in January 2015, and a revised 1,081,000 (previously 1,087,000, initially 1,089,000) in December 2014. Those annualized numbers are reflected the scales of the accompanying aggregate graphs.
Nonetheless, given the nonsensical monthly volatility in reporting and the exaggerated effect of annualizing the monthly numbers in this unstable series, the magnitude of monthly activity and the changes in same, more realistically are reflected at the non-annualized monthly rate. Consider that the headline 184,000 month-to-month decline in housing starts, from January 2015 to February 2015, was larger than any actual total (non-annualized) monthly starts level for a single month, since before the recession.
Accordingly, the monthly rate of 74,750 units in February 2015, instead of the annualized 897,000-headline number, is used in the scaling of the series of graphs shown in the Opening Comments. With the use of either scale of units, however, appearances of the graphs and the relative monthly, quarterly and annual percentage changes are otherwise identical.
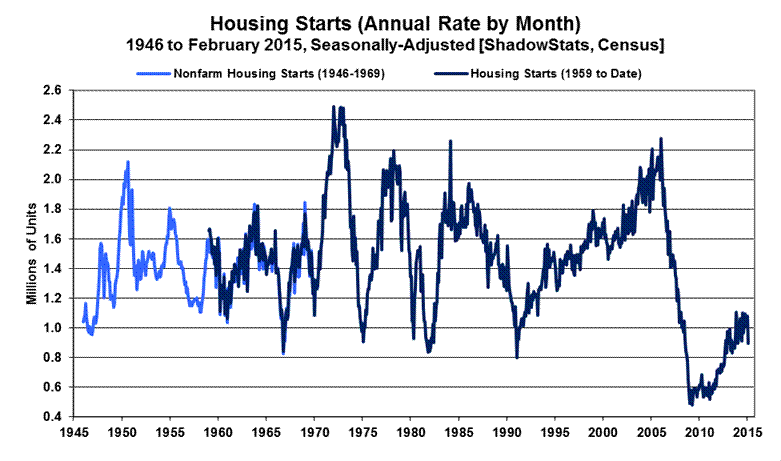
The record monthly low seen for the present aggregate series was in April 2009, where the annualized monthly pace of sales then was down 79% (-79%) from the January 2006 pre-recession peak. Against the downside-spiked low in April 2009, the February 2015 headline number was up by 88%, but it still was down by 61% (-61%) from the January 2006 series high. Shown in the historical perspective of the post-World War II era, current activity is trending stagnant at levels that otherwise have been at the historical troughs of recession activity of the last 70 years, see seen the second graph following.
__________
WEEK AHEAD
Headline Reporting and Revisions Should Trend Much Weaker versus an Overly-Optimistic Economic Consensus; Inflation Will Rise Anew, Following the Bottoming of Oil-Prices. Shifting some to the downside, again, amidst wide fluctuations in the numbers, market expectations for business activity remain overly optimistic in the extreme. They exceed any potential, underlying economic reality. Downside corrective revisions and an accelerating pace of downturn in broad-based, monthly headline economic reporting already have begun to hammer those expectations. Recent GDP excesses will not face downside revisions until the July 30, 2015 GDP benchmark revision, other than for the one monthly revision still pending for fourth-quarter 2014 GDP.
Headline consumer inflation—recently driven lower by collapsing prices for gasoline and other oil-price related commodities—likely hit or was close to a near-term low in January 2015 reporting. Significant upside inflation pressures should resume as oil prices rebound, a process that already appears to be underway, and one that would accelerate rapidly with an eventual sharp downturn in the exchange-rate value of the U.S. dollar. These areas, the general economic outlook and longer range reporting trends are reviewed broadly in No. 692 Special Commentary: 2015 - A World Out of Balance.
A Note on Reporting-Quality Issues and Systemic-Reporting Biases. Significant reporting-quality problems remain with most major economic series. Beyond gimmicked changes to reporting methodologies of the last several decades, ongoing headline reporting issues are tied largely to systemic distortions of seasonal adjustments. Data instabilities were induced partially by the still-evolving economic turmoil of the last eight years, which has been without precedent in the post-World War II era of modern-economic reporting. The severity and ongoing nature of the downturn provide particularly unstable headline economic results, when concurrent seasonal adjustments are used (as with retail sales, durable goods orders, employment, and unemployment data, see the prior labor data related Commentary No. 695). Combined with recent allegations of Census Bureau falsification of data in its monthly Current Population Survey (the source for the Bureau of Labor Statistics’ Household Survey), these issues have thrown into question the statistical-significance of the headline month-to-month reporting for many popular economic series (see Commentary No. 669).
PENDING RELEASES:
Existing- and New-Home Sales (February 2015). February 2015 existing-home sales are due for release on Monday, March 23rd, from the National Association of Realtors, with the February 2015 new-home sales report due from the Census Bureau on Tuesday, March 24th. ShadowStats will cover both series in the planned March 24th regular Commentary.
Still impaired by the negative, underlying fundamental pressures similar to those seen pummeling housing construction (see the related Housing Starts and Consumer Liquidity sections in this Commentary), the outlook for home-sales activity remains bleak.
Recent negative trends in headline monthly reporting of existing-home sales likely continued in February, with flat-to-downside month-to-month activity.
Smoothed for extreme and nonsensical monthly gyrations, an ongoing pattern of stagnation or downturn also should be in play for February new-home sales. While monthly changes in activity rarely are statistically-significant for this series, still-unstable reporting and revisions (both likely to the downside) remain a fair bet for February sales. Reflecting intensifying consumer issues, both the new- and existing- home sales series increasingly should reflect downside instabilities in their respective headline activity.
Consumer Price Index—CPI (February 2015). The February 2015 CPI is scheduled for release on Tuesday, March 24th, by the Bureau of Labor Statistics (BLS). The headline CPI-U should be flat, plus-or-minus, month-to month, reflecting some increase in gasoline prices, largely offset by negative seasonal-adjustment factors to those gasoline prices. Early-market expectations appear to for a headline monthly gain on the plus-side of flat.
Gasoline prices moved higher, on average, in February 2015, up by 4.21% for the month on a not-seasonally-adjusted basis, per the Department of Energy (DOE). Gasoline prices appear to be headed for an even stronger unadjusted gain of about 10% in March. BLS seasonal adjustments to gasoline prices in January traditionally are sharply negative, and, shy of BLS "intervention analysis" mitigating the downside adjustment pressures, seasonally-adjusted gasoline prices likely will have contracted in the month, pulling down headline monthly inflation to flat, plus-or-minus, with higher food and “core” (net of food and energy) inflation, offsetting some of the negative energy number.
Annual Inflation Rate. Year-to-year, CPI-U inflation would increase or decrease in February 2015 reporting, dependent on the seasonally-adjusted monthly change, versus an adjusted 0.10% monthly inflation gain reported for February 2014. The adjusted change is used here, since that is how consensus expectations are expressed. To approximate the annual unadjusted inflation rate for February 2015, the difference in February’s headline monthly change (or forecast of same), versus the year-ago monthly change, should be added to or subtracted directly from the January 2015 negative annual inflation rate of 0.09% (-0.09%). For example, if headline monthly CPI-U increased by 0.2% in February 2015, that would take the current minimally-negative annual CPI-U inflation to flat, close to "unchanged."
New Orders for Durable Goods (February 2015). Reporting of February 2015 new orders for durable goods is scheduled for Wednesday, March 25th, by the Census Bureau. Net of the irregular activity in commercial aircraft orders, aggregate orders likely continued a pattern of down-trending stagnation.
Aircraft orders are booked for the long-term—years in advance—so they have only limited impact on near-term production. Further, by their nature, these types of orders do not lend themselves to seasonal adjustment. Accordingly, the durable goods measure that best serves as a leading indicator to broad production—a near-term leading indicator of economic activity—is the activity in new orders, ex-commercial aircraft. Net of volatility in commercial-aircraft orders in recent months, new orders have been reasonably stagnant and, again, should remain stagnant-to-down in headline February reporting.
Gross Domestic Product—GDP (Fourth-Quarter 2014, Second Revision, Third Estimate). The Bureau of Economic Analysis (BEA) will publish its third estimate of fourth-quarter 2014 GDP on Friday, March 27th. Early-market expectations are for negligible revision, with the headline real growth rate holding at or close to the current headline 2.2%.
Where underlying fundamentals suggest that a fourth-quarter growth rate something on the plus-side of flat is realistic, revisions down to that level likely will not be seen until the July 30th benchmark revision. Yet, in recent quarters, BEA first and second revisions to GDP growth estimates have been unusually volatile, signaling instabilities in the reporting system. The most-recent trend suggested by current BEA activity has been to the downside. Accordingly, though not based on new underlying reporting, reporting risks still run to the downside of 2.2%.
Potential reporting surprises also could lurk in the reporting of headline activity closely related to the GDP. Delayed by the poor-quality of the broad economic data available, year-end initial reporting on fourth-quarter 2014 estimates of Gross National Product (GNP) and Gross Domestic Income (GDI) will accompany the March 27th report. GDP is a component of the broader GNP measure, which includes the trade balance in factor income (interest and dividend payments), while GDP is the consumption-side equivalent to the income-side GDI.
__________