No. 713: March CPI, Real Retail Sales and Earnings, Housing Starts, GDP Prospects
COMMENTARY NUMBER 713
March CPI, Real Retail Sales and Earnings, Housing Starts, GDP Prospects
April 17, 2015
__________
Housing Starts Plunged at Annualized Pace of 31.0% (-31.0%) in First-Quarter 2015
Real Retail Sales Contracted at 2.0% (-2.0%) Annualized Pace in First-Quarter,
Worst Showing Since Depths of Economic Collapse
Annual Real Sales Growth at Recession Level
Real Earnings Fell by 0.4% (-0.4%) in March
March Year-to-Year Inflation: -0.1% (CPI-U), -0.6% (CPI-W), 7.5% (ShadowStats)
First-Quarter 2015 Real GDP Headed for a Contraction
___________
PLEASE NOTE: The next regular Commentary, scheduled for Friday, April 24th, will cover March new orders for durable goods, existing- and new-home sales, and an update on pending GDP reporting.
Best wishes to all — John Williams
OPENING COMMENTS AND EXECUTIVE SUMMARY
Everything but the Consensus Is in Place for a First-Quarter GDP Contraction. Discussed in today’s Commentary, and in conjunction with discussions in Commentary No. 711 and Commentary No. 712, real (inflation-adjusted) retail sales and housing starts now have joined with industrial production, the trade deficit, real construction spending and real new orders for durable goods in signaling an outright contraction for first-quarter 2015 real GDP. What is missing, still, is market-consensus recognition of that circumstance.
The "advance" estimate of first-quarter GDP growth is due for release on April 29th, still some twelve days off. The Bureau of Economic Analysis (BEA) likely will lock-in its initial GDP estimate by Wednesday or Thursday of next week (April 22nd or 23rd) and, traditionally, the Bureau considers consensus forecasts in its first estimate. If the consensus has dropped well below 1.0%, by then, chances will be strong for a negative, initial headline number. If the consensus still is above 1.0%, the BEA likely will bring in a very weak, but still-positive number, much as it did with first-quarter 2014, before turning the growth negative in later revisions.
Given the extraordinarily negative tone of all the recent, underlying economic reporting, it would be highly unusual for the BEA not to be reporting a sharp, quarterly contraction for headline first-quarter 2015 GDP, by the first revision of the series on May 29th. This circumstance will be updated next week.
Today’s Missive (April 17th). The balance of today’s Commentary concentrates on the reporting detail related to nominal March housing starts and the consumer price index (CPI), and related real retail sales and earnings.
The Hyperinflation Outlook Summary has not been updated from No. 711, but the latest gold-related graphs (versus the Swiss franc, oil and silver), which usually accompany the CPI Commentaries, are included. The Week Ahead section previews the pending March reporting on new orders for durable goods and new- and existing-home sales.
Consumer Price Index (CPI)—March 2015—Headline CPI-U Inflation Rose by 0.2%, for Second Month; Annual Inflation Held on Downside of Unchanged. After seven months of ongoing selling pressure, oil and gasoline prices hit something of a bottom in January, with general prices and headline consumer inflation moving higher in February and March. Unadjusted, monthly retail gasoline prices jumped by 10.5% in March 2015 per the Bureau of Labor Statistics (BLS), and were up by 10.7% per the Department of Energy (DOE). The bulk of that increase, however, disappeared with negative seasonal adjustments to energy prices, leaving the headline CPI-U gain at a seasonally-adjusted 0.24%, up by 0.60% unadjusted, and down by 0.07% (-0.07%) unadjusted year-to-year.
The rally in oil prices had stalled in recent weeks, but it appears to be picking up anew. A sustained increase in energy prices would be needed to keep headline inflation in positive territory. Where supply and demand factors appear to favor continued, relatively low oil prices, industry economics are kicking-in, increasingly altering those circumstances. Separately, a likely massive decline the U.S. dollar still looms in the not-too-distant future. Such an event would spike oil prices and other inflationary pressures sharply.
CPI-U. The headline, seasonally-adjusted March 2015 CPI-U rose month-to-month by 0.24%, following a 0.22% gain in February. Adjusted headline March inflation was heavily constrained by seasonal factors. On a not-seasonally-adjusted basis, the March 2015 CPI-U rose by 0.60% month-to-month, following an unadjusted February 2015 CPI-U monthly gain of 0.43%. Not seasonally adjusted, March 2015 year-to-year inflation for the CPI-U was down by a headline 0.07% (-0.07%), versus an annual decline of 0.03% (-0.03%) in February 2015.
Major CPI-U Groups. Encompassed by the seasonally-adjusted gain of 0.24% in the March CPI-U [up by an unadjusted 0.60%], aggregate March energy inflation rose for the month by an adjusted 1.14% [up by an unadjusted 4.14%]. In the other major CPI sectors, adjusted food inflation fell by 0.18% (-0.18%) [down by 0.24% (-0.24%) unadjusted], while adjusted "core" inflation was up by 0.23% [up by 0.41% unadjusted] for the month. Separately, core CPI-U inflation showed unadjusted year-to-year inflation of 1.75% in March 2015, versus 1.69% in February 2015.
CPI-W. The March 2015 seasonally-adjusted, headline CPI-W, which is a narrower series and has greater weighting for gasoline than does the CPI-U, rose by 0.29% month-to-month (up by 0.71% unadjusted), versus a gain of 0.26% (up by 0.49% unadjusted) in February. Unadjusted, annual March 2015 CPI-W inflation fell by 0.65% (-0.65%), versus a decline of 0.63% (-0.63%) in February 2015.
Chained-CPI-U. Initial reporting of unadjusted year-to-year inflation for the March 2015 C-CPI-U was an annual contraction of 0.41% (-0.41%), versus a year-to-year decline of 0.50% (-0.50%) in February 2015.
Alternate Consumer Inflation Measures. The ShadowStats-Alternate Consumer Inflation Measure (1990-Base)—year-to-year annual inflation was roughly 3.5% in March 2015, versus 3.6% in February 2015. The March 2015 ShadowStats-Alternate Consumer Inflation Measure (1980-Base), which reverses gimmicked changes to official CPI reporting methodologies back to 1980, was at about 7.5% (7.51% for those using a second decimal point) year-to-year, versus 7.6% in February 2015.
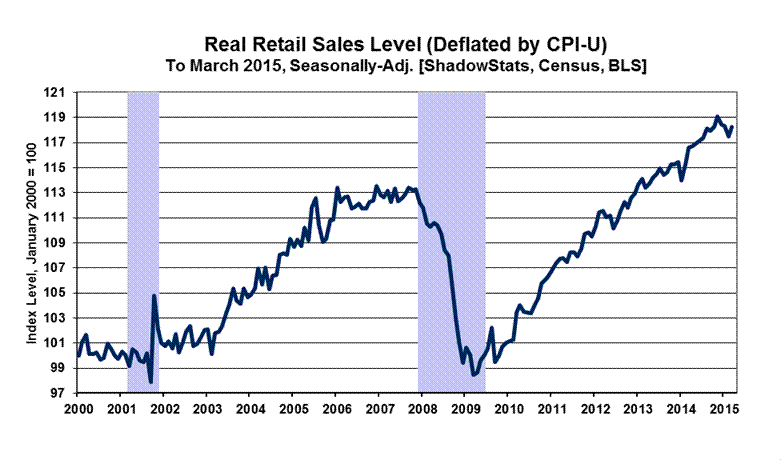
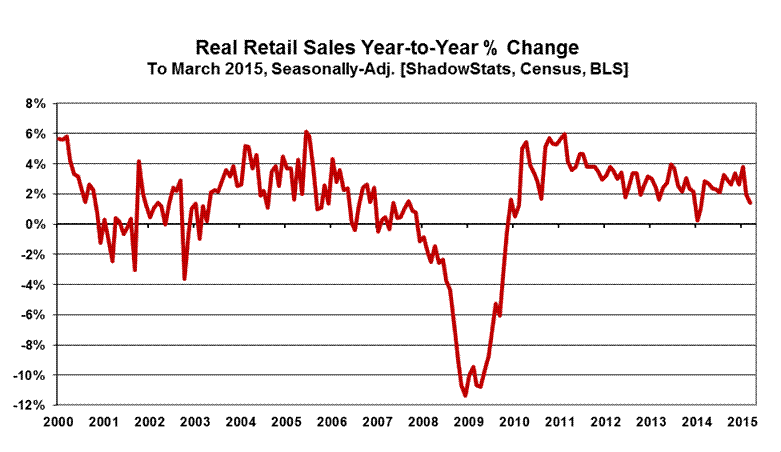
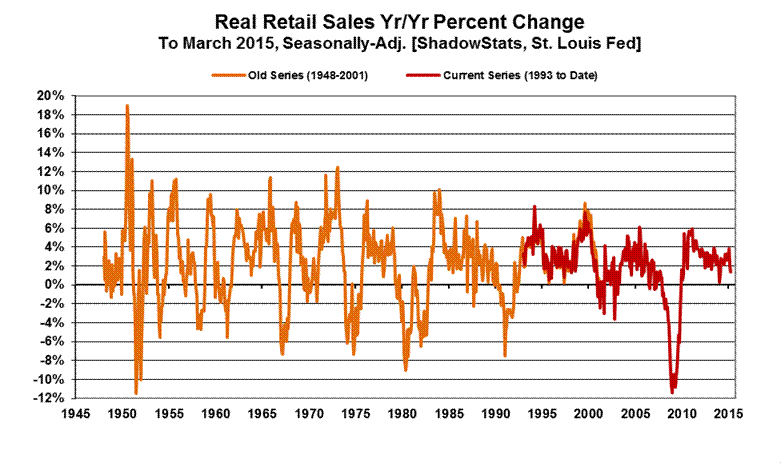
Real Retail Sales—March 2015—Annualized First-Quarter Contraction of 2.0%. In nominal terms, before adjustment for inflation, headline monthly retail sales rose by a statistically-significant, seasonally-adjusted 0.86% in March 2015, following a revised decline of 0.46% (-0.46%) in February 2015, discussed in Commentary No. 712.
Headline Reporting of Real Retail Sales. Adjusted for the headline monthly gain of 0.24% in the March 2015 CPI-U, and in the context of a gain of 0.22% in February CPI-U, real retail sales rose by a headline 0.63% in March 2015, and declined by a revised 0.68% (-0.68%) in February. Those numbers set first-quarter 2015 real retail sales at an annualized 2.0% (-2.0%) quarterly pace of contraction versus fourth-quarter 2014 real activity.
First-Quarter Contraction Was Worst Since Economic Collapse. First-quarter 2015 real retail sales, based on full reporting, contracted at an annualized pace of 1.99% (-1.99%), versus fourth-quarter 2014 activity, which, in turn was up at an annualized pace of 2.72% from third-quarter 2014. The first-quarter 2015 contraction in real retail sales was the steepest since a 5.68% quarterly real sales plunge in first-quarter 2009, at the depths of the economic collapse.
The last time real retail sales contracted on a quarterly basis was first-quarter 2014, down then by an annualized 0.10% (-0.10%). With positive inflation at that time, nominal first-quarter 2014 retail sales rose at an annualized pace of 1.99% [first-quarter 2015 nominal retail sales contracted at an annualized pace of 4.99% (-4.99%)]. Nonetheless, headline real GDP also last contracted in first-quarter 2014, mirroring the real retail sales activity. A similar mirroring of contracting, quarterly activity has become increasingly likely for first-quarter 2015 real GDP, as noted earlier in these Opening Comments.
Real Year-to-Year Growth Slowed Markedly. Year-to-year change in March 2015 real retail sales slowed to 1.40%, versus a revised 1.96% in February 2015. In normal economic times, annual real growth at or below 2.0% would signal an imminent recession. That signal was just renewed and had been given otherwise, recently. The signal remains in play and likely will serve as an indicator of renewed downturn in broad economic activity. The levels of real retail sales activity and year-to-year growth are plotted in the Reporting Detail section.
Separately, discussed and detailed in Commentary No. 711, the underlying issue with current retail sales activity remains intense, structural-liquidity woes besetting the consumer. That circumstance—in the last seven-plus years of economic collapse and stagnation—has continued to prevent a normal recovery in broad U.S. economic activity.
As official consumer inflation continues its upturn in the months ahead, and as overall retail sales continue to suffer from the ongoing consumer liquidity squeeze—reflected partially by the general pattern of real earnings difficulties seen anew in the next section—these data should continue to trend meaningfully lower, in what should gain recognition as a formal new or double-dip recession.
Corrected Real Retail Sales—March 2015. The apparent “recovery” in headline real retail sales generally continued through late-2014, although headline reporting turned down in December 2014, and in January and February 2015. Nonetheless, headline real growth in retail sales continues to be overstated heavily, due to the understatement of the rate of inflation used in deflating the retail sales series. As discussed more fully in Chapter 9 of 2014 Hyperinflation Report—Great Economic Tumble – Second Installment, deflation by too-low an inflation number (such as the CPI-U) results in the deflated series overstating inflation-adjusted economic growth.
Both graphs following are indexed to January 2000=100.0 to maintain consistency in the series of graphs related to corrected inflation-adjustment (including industrial production, new orders for durable goods and GDP). The first graph reflects the official real retail sales series, except that it is indexed, instead of being expressed in dollars. The plotted patterns of activity and rates of growth are exactly same for the official series, whether the series is indexed or expressed in dollars, as can be seen in the comparison with the first plot of real retail sales in the Reporting Detail section.
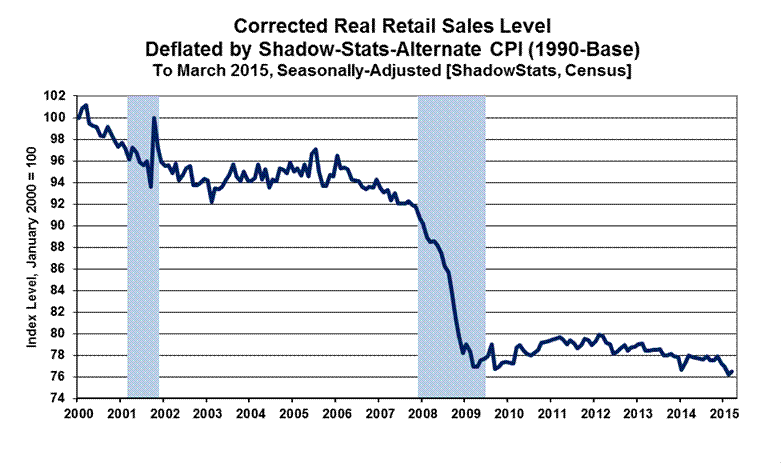
Instead of being deflated by the CPI-U, the "corrected" real retail sales numbers—in the second graph (preceding)—use the ShadowStats-Alternate Inflation Measure (1990-Base) for deflation. With the higher inflation of the ShadowStats measure, the revamped numbers show a pattern of plunge and stagnation and renewed downturn, consistent with patterns seen in consumer indicators like real median household income, consumer confidence, broad unemployment and in most housing statistics. A topping out in late-2011 and early-2012 reverted to renewed decline in second-quarter 2012 in this series, which had been bottom-bouncing at a low-level plateau of economic activity since the economic collapse from 2006 into 2009. The renewed contraction has trended into and deepened in first-quarter 2015, allowing for the occasional and temporary upside blip.
Real Average Weekly Earnings—March 2015—Fell by 0.4% (0.4%) in the Month. Reflecting headline, seasonally-adjusted monthly gain of 0.29% in the March 2015 CPI-W, versus the prior monthly gain of 0.26% in the February CPI-W, real average weekly earnings fell month-to-month in March 2015.
In the production and nonsupervisory employees category—the only series for which there is a meaningful history—headline real average weekly earnings dropped by 0.40% (-0.40%) in March. That followed a revised headline monthly gain of 0.09% [previously down by 0.26% (-0.26%)] in February, and a revised 1.08% gain [previously up by 1.33%, initially up by 0.98%] in January. The monthly revisions fully reflected regular BLS surveying instabilities as to earnings. Before inflation adjustment, March earnings fell by 0.1% (-0.1%) for the month, with monthly gains of 0.3% and 0.1% in February and January.
Year-to-year and seasonally-adjusted, March 2015 real average weekly earnings eased back to a gain of 2.35%, from a revised 3.28% in February 2015, and a revised 3.54% in January 2015. Unadjusted year-to-year changes were 2.06% in March 2015, 2.01% in February 2015, and 0.43% in January 2015. Both the monthly and annual fluctuations here are irregular, but current reporting remains well within the normal bounds of volatility, with the exception of the unusual recent inflation patterns.
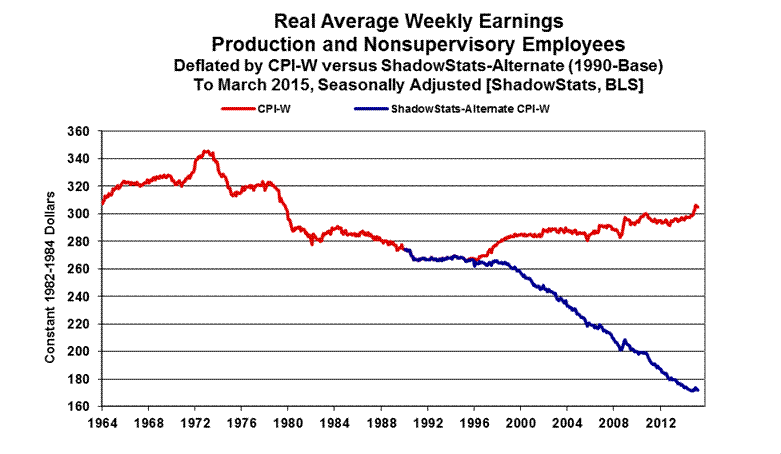
The accompanying graph plots earnings as officially deflated by the BLS (red-line), and as adjusted for the ShadowStats-Alternate CPI Measure, 1990-Base (blue-line). When inflation-depressing methodologies of the 1990s began to kick-in, the artificially-weakened CPI-W (also used in calculating Social Security cost-of-living adjustments) helped to prop up the reported real earnings. Official real earnings today still have not recovered their inflation-adjusted levels of the early-1970s, and, at best, have been flat for the last decade. Deflated by the ShadowStats measure, real earnings have been in fairly-regular decline for the last four decades, which is much closer to common experience than the pattern suggested by the CPI-W. See Public Commentary on Inflation Measurement for further detail.
That said, the recent decline in headline monthly inflation generated a temporary, but visible spike in the real-earnings levels of December and January, now pulling back with the February and March detail.
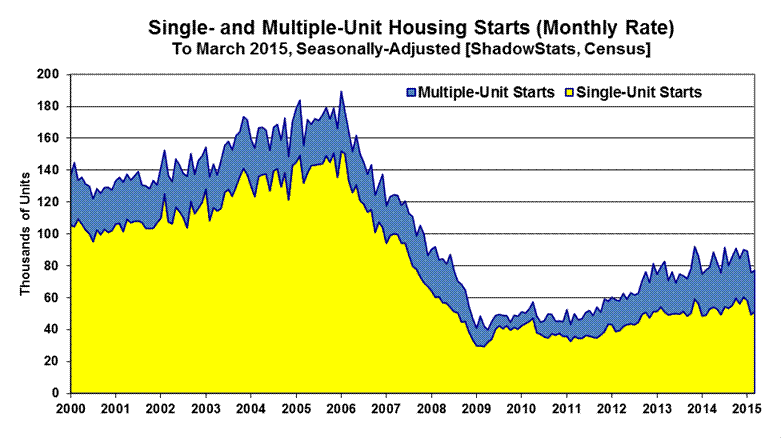
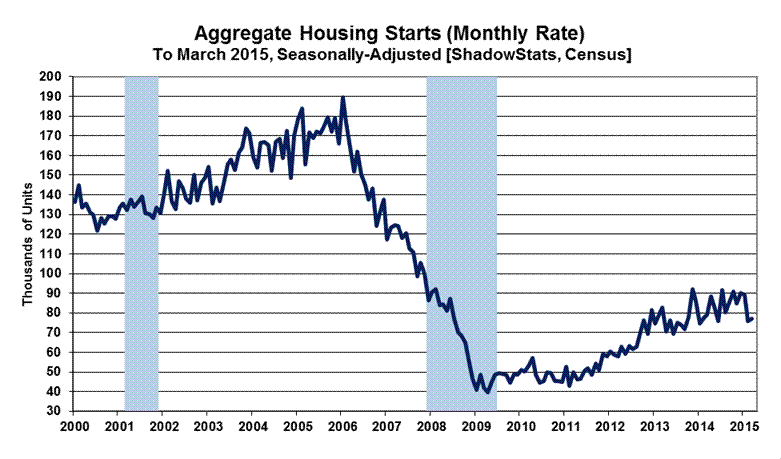
Housing Starts—March 2015—Starts Have Moved from Down-Trending Stagnation to Quarterly Contraction. In the context of a small upside revision to February activity, and the usual monthly reporting instabilities, headline housing starts rose by a statistically-insignificant 2.0% in March 2015, confounding market expectations for a recuperative monthly surge of 15.9% [Bloomberg]—an expected rebound—following the purported sharp dampening effects of bad weather that still would have contributed to February’s revised headline monthly contraction of 15.3% (-15.3%) [previously down by 17.0% (-17.0%)]. As often is the case, none of the headline March 2015 housing starts monthly changes by category (mixed) and annual changes (all negative) came close to being statistically-significant.
Sharp Quarterly Contractions in Varied, Housing-Starts Activity. What had been a smoothed, down-trending stagnation in the housing-starts series has turned to renewed contraction, with first-quarter 2015 activity plunging versus activity in fourth-quarter 2014 pressuring the initial, April 29th estimate of first-quarter 2015 GDP growth to the downside (see the earlier GDP discussion).
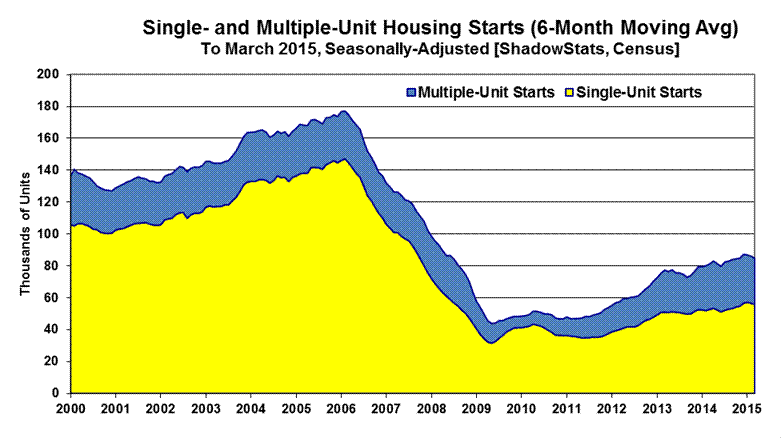
By category, total housing starts fell at annualized pace of 31.0% (-31.0%) in first-quarter 2015, following an annualized gain of 13.4% in fourth-quarter 2014, and an annualized gain of 19.2% in third-quarter 2014.
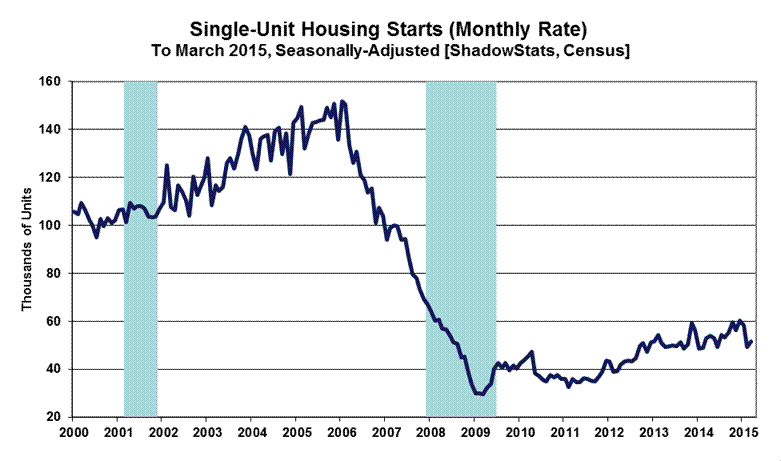
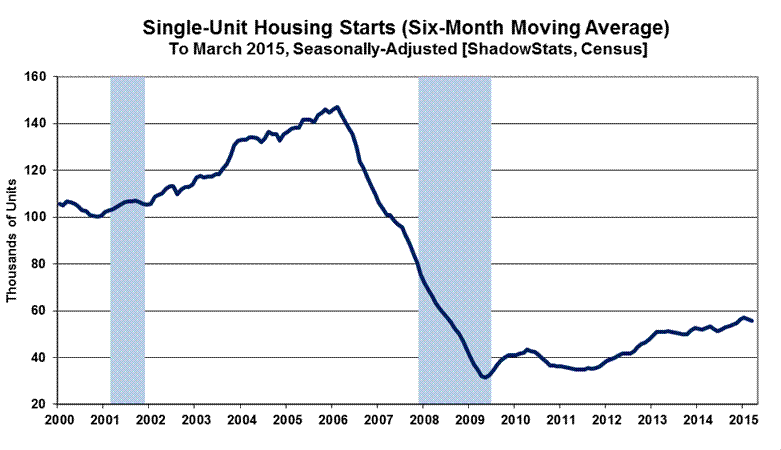
Single-unit housing starts fell at annualized pace of 33.8% (-33.8%) in first-quarter 2015, following an annualized gain of 36.7% in fourth-quarter 2014, and an annualized gain of 18.2% in third-quarter 2014.
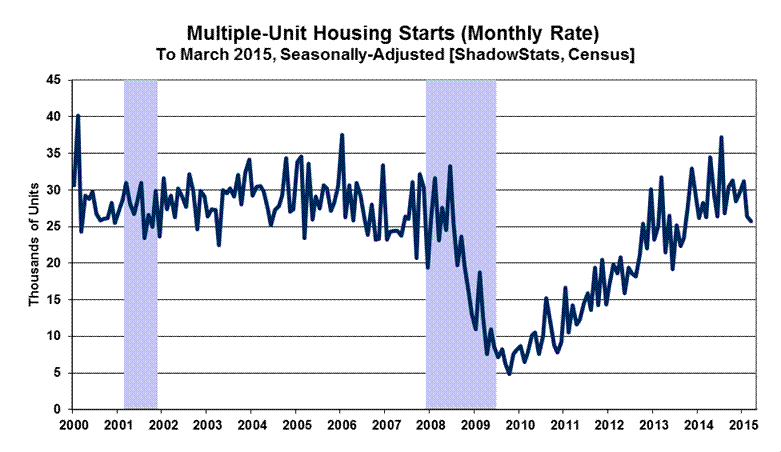
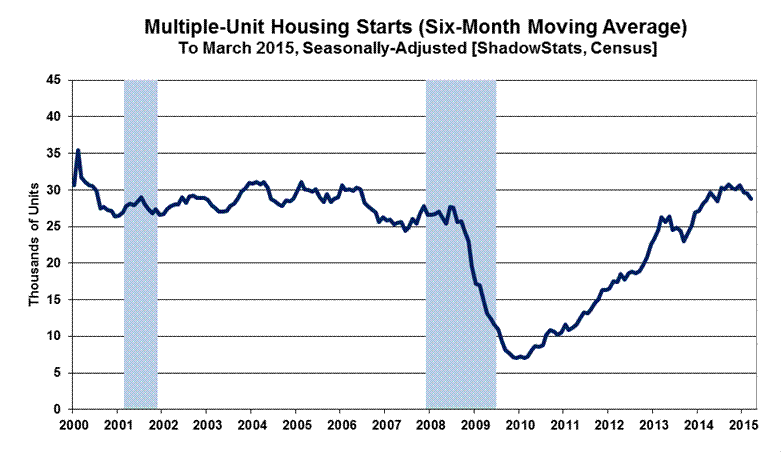
Multiple-unit housing starts (two-or-more units, primarily apartment buildings) fell at annualized pace of 25.2% (-25.2%) in first-quarter 2015, following an annualized decline of 19.6% (-19.6%) in fourth-quarter 2014, and an annualized gain of 21.1% in third-quarter 2014.
All three categories last fell together in first-quarter 2014, which also was the last time headline GDP contracted, at least as indicated in current headline GDP reporting (pre-July 30th GDP benchmark).
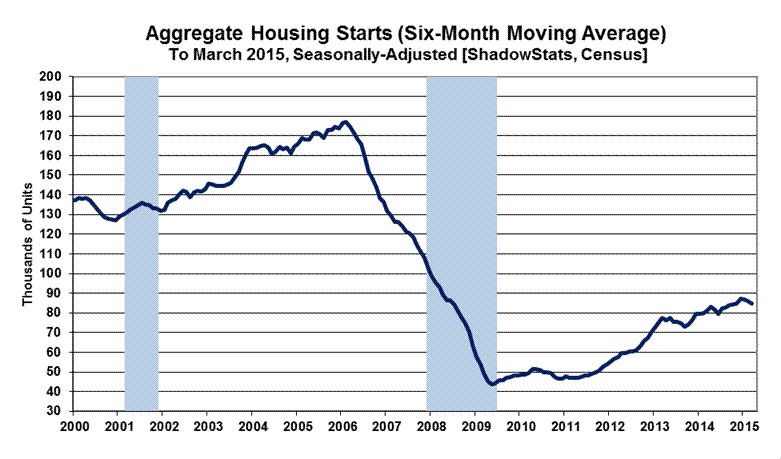
Smoothed Numbers. Nonetheless, a general pattern of weakening stagnation continued in this series, as best viewed in terms of the longer-range historical graph of aggregate activity (see Reporting Detail section), and in the context of the down-trending activity—a renewed downturn—smoothed by six-month moving averages, as shown in graphs of these Opening Comments.
Reflected in those smoothed graphs, the aggregate housing-starts series continued to weaken in March, dominated, as usual, by the personal housing sector (single-unit starts). Although there had been a minor upside trend in the aggregate series into the latter part of 2014, total housing-starts activity remained well below any recovery level and now has turned down anew. The bulk of the extreme reporting instability and the minimal uptrend in the aggregate series, over time, had been due largely to particularly-volatile reporting in the multiple-unit housing-starts category (apartments, etc.). Where recent activity in multiple-unit starts actually recovered into the general range of pre-recession activity, that process topped out in third-quarter 2014, with those starts now trending lower in monthly reporting, including on a six-month moving-average basis. Still, the recent impact of the temporary recovery in multiple-unit activity largely was lost in the detail of total housing starts.
Structural Liquidity Issues Constrain Consumer Housing Activity. On a per structure basis, activity in housing starts is dominated by the single-unit housing starts category, which has remained stagnant—at a low level of activity—since hitting bottom in early-2009. The private housing sector never recovered from the business collapse of 2006 into 2009.
The underlying problem here remains intense, structural-liquidity woes besetting the consumer. That circumstance, during the last eight-plus years of economic collapse and stagnation, has continued to prevent a normal recovery in broad U.S. business activity, as updated in Commentary No. 711 and discussed and detailed in No. 692 Special Commentary: 2015 - A World Out of Balance.
Without real growth in income, and without the ability and/or willingness to offset declining purchasing power with debt expansion, the consumer lacks the wherewithal to fuel sustainable, consumption-based growth or recovery in U.S. economic activity. That includes not only residential investment and related construction spending, but also retail sales and the still-dominant personal-consumption account of the GDP, as further noted in the Real Retail Sales section of the March CPI discussion.
March 2015 Housing-Starts Headline Reporting. Headline March 2015 housing starts showed a statistically-insignificant, seasonally-adjusted headline monthly gain of 2.0%. That followed a revised monthly contraction in February of 15.3% (-15.3%), and a revised monthly decline of 0.8% (-0.8%) in January. Net of prior-period revisions, the headline March change was a statistically-insignificant gain of 3.2%.
Year-to-year change in the seasonally-adjusted, aggregate March 2015 housing-starts measure was a statistically-insignificant decline of 2.5% (-2.5%), versus a revised annual contraction of 2.2% (-2.2%) in February 2015, and a revised 19.5% gain in January 2015.
The headline March 2015 monthly gain of 2.0% for total housing starts was dominated by a headline monthly increase of 4.4% in the "one unit" category, with a drop of 7.1% (-7.1%) in the “five units or more” category, but with none of those headline changes coming close to being statistically-significant.
By-Unit Category. Where the irregular housing starts series can show varying patterns, that partially is due to a reporting mix of residential construction products, with the largest physical-count category of one-unit structure housing starts—generally for individual consumption, resulting in new home sales—versus multi-unit structure starts that generally reflect the building of rental and apartment units.
Housing starts for single-unit structures in March 2015 rose month-to-month by a statistically-insignificant 4.4%, following a revised February decline of 15.2% (-15.2%) and a revised January decline of 3.7% (-3.7%). Single-unit starts for March 2015 showed a statistically-insignificant year-to-year annual decline of 2.7% (-2.7%), following a revised annual gain of 0.5% in February 2015, and a revised annual gain of 19.7% in January 2015.
Housing starts for apartment buildings (generally 5-units-or-more) in February 2015 fell month-to-month by a statistically-insignificant 7.1% (-7.1%), following a revised headline decline of 16.0% (-16.0%) in February, and a revised headline January gain of 9.5%. The statistically-insignificant March 2015 year-to-year decline of 4.7% (-4.7%) followed a revised annual decline of 5.8% (-5.8%) in February 2015, and a revised 20.3% gain in January 2015.
Expanding the multi-unit structure housing starts category to include 2-to-4-units plus 5-units-or-more usually reflects the bulk of rental- and apartment-unit activity. The Census Bureau does not publish estimates of the 2-to-4-units category, due to statistical significance problems (a general issue for the aggregate series). Nonetheless, the total multi-unit category can be calculated by subtracting the single-unit category from the total category.
Accordingly, the statistically-insignificant March 2015 gain of 2.0% in aggregate housing starts was composed of a statistically-insignificant gain of 4.4% in one-unit structures, combined with a statistically-insignificant monthly drop of 2.5% (-2.5%) in the multiple-unit structures category (2-units-or-more, including the 5-units-or-more category). The two graphs preceding, and those that follow, all are related.
Graphs of Housing-Starts Activity. The following six graphs of monthly detail for the housing-starts series show starts activity for the aggregate series, for single-unit structures and for multiple-unit structures, both in terms of monthly detail and in terms of six-month moving averages of that detail.
Looking beyond the irregular and large month-to-month headline variations due to poor-quality surveying and occasional weather issues, the smoothed graphs (using six-month moving averages) generally show a broad pattern of economic plunge into 2009 followed by stagnation, not the purported economic recovery as shown with the GDP (see No. 692 Special Commentary: 2015 - A World Out of Balance). This is true of the aggregate housing starts series and its dominant component of single-unit housing starts. The more volatile multiple-unit housing starts series had recovered its pre-recession high, but it now has topped out.
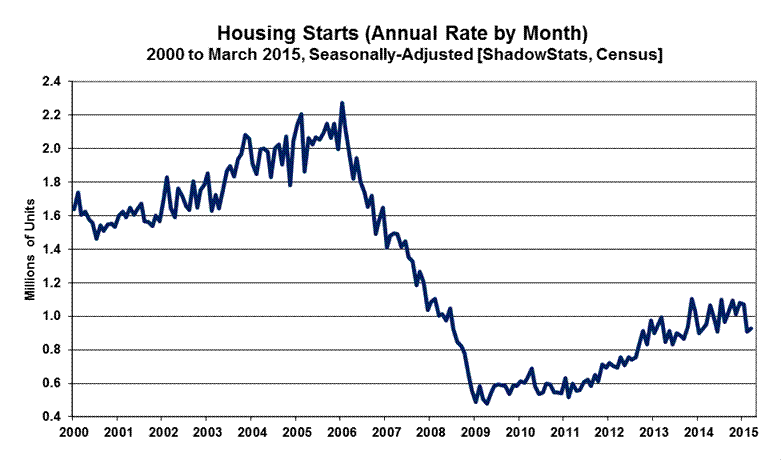
Housing Starts Graphs. Headline reporting of housing starts activity is expressed by the Census Bureau as an annualized monthly pace of starts, which was 926,000 in March 2015, versus a revised 908,000 (previously 897,000) in February 2015, and a revised 1,072,000 (previously 1,081,000, initially 1,065,000) in January 2015. Those annualized numbers are reflected in the detail of the scales in the aggregate graphs at the end of the Reporting Detail section.
Nonetheless, given the nonsensical monthly volatility in reporting and the exaggerated effect of annualizing the monthly numbers in this unstable series, the magnitude of monthly activity and the changes in same, more realistically are reflected at the non-annualized monthly rate. Consider that the revised headline 164,000 month-to-month decline in housing starts, from January 2015 to February 2015, was larger than any actual total (non-annualized) monthly starts level for a single month, since before the recession.
Accordingly, the monthly rate of 77,167 units in March 2015, instead of the annualized 926,000-headline number, is used in the scaling of the series of graphs shown in these Opening Comments. With the use of either scale of units, however, appearances of the graphs and the relative monthly, quarterly and annual percentage changes are otherwise identical.
The record monthly low seen for the present aggregate series was in April 2009, where the annualized monthly pace of sales then was down 79% (-79%) from the January 2006 pre-recession peak. Against the downside-spiked low in April 2009, the March 2015 headline number was up by 94%, but it still was down by 59% (-59%) from the January 2006 series high. Shown in the historical perspective of the post-World War II era, current activity is trending stagnant-to-lower at levels that otherwise have been at the historical troughs of recession activity of the last 70 years, as seen in the last graph of the Reporting Detail section.
[Further detail on the March CPI, related series such real retail sales and earnings, and housing starts is found in the Reporting Detail section.]
__________
HYPERINFLATION WATCH
HYPERINFLATION OUTLOOK SUMMARY
General Outlook Is Unchanged; Intensifying Economic Weakness Has Begun to Impact Market Perceptions of Fed Policy and U.S. Dollar Strength. The Hyperinflation Outlook Summary has not been revised from Commentary No. 711, other than for updated internal links or references.
No. 692 Special Commentary: 2015 - A World Out of Balance of February 2, 2015 updated the Hyperinflation 2014 reports and the broad economic outlook. Previously, the long-standing hyperinflation and economic outlooks were updated with the publication of 2014 Hyperinflation Report—The End Game Begins – First Installment Revised, on April 2, 2014, and publication of 2014 Hyperinflation Report—Great Economic Tumble – Second Installment, on April 8, 2014. The outlooks also are updated regularly in the weekly Commentaries. The Opening Comments of No. 692 should be considered in terms of recent circumstances and near-term, proximal triggers for massive dollar selling. The two 2014 Hyperinflation Report installments, however, remain the primary background material for the hyperinflation and economic analyses and forecasts. One other reference should be considered here, in terms of underlying economic reality, and that is the Public Commentary on Inflation Measurement.
Primary Summary. Current fiscal conditions show the effective long-term insolvency of the U.S. government, a circumstance that usually would be met by unfettered monetization of the national debt and obligations, leading to an eventual hyperinflation. The 2008 Panic and near-collapse of the financial system, and official (U.S. government and Federal Reserve) response to same, pulled the elements of the eventual hyperinflation crisis at the end of this decade into the current period.
The primary and basic summary of the broad outlook and the story of how and why this fiscal, financial and economic crisis has unfolded and developed over the years—particularly in the last decade—is found in the Opening Comments and Overview and Executive Summary of that First Installment Revised (linked earlier). The following summarizes the underlying current circumstance and recent developments.
Relative U.S. economic strength, and the relative virtuousness of Fed monetary policy versus major U.S. trading partners have been over-estimated heavily by the global markets, and structural faults have started to appear in the foundation underpinning recent U.S. dollar strength (see Commentary No. 711). Consistent with the above referenced Special Commentaries, the unfolding, weakening domestic-economic circumstance, in confluence with other fundamental issues, has begun to raise doubts in the markets as to the sustainability of the purported U.S. economic recovery, and as to the imminence of meaningful monetary tightening by the U.S. Federal Reserve. As result, the U.S. dollar has backed off its recent highs, with some related upside pressure having been seen on oil prices.
Domestic economic data should continue to falter, increasingly moving market expectations towards an imminent new recession, not only further pummeling expectations for a significant tightening in Fed policy, but also renewing expectations for a more-accommodative Fed. While such may help to fuel further stock-market mania, any resulting rallies in equity prices likely will be more than offset in real terms, by percentage declines in the exchange-rate value of the U.S. dollar or in the eventual increases in headline consumer inflation.
Faltering expectations on more-conservative Federal Reserve policies and on the direction of domestic economic activity, should place mounting and eventually massive selling pressure on the U.S. dollar, as well as potentially resurrect elements of the Panic of 2008. Physical gold and silver, and holding assets outside the U.S. dollar, remain the ultimate primary hedges against an eventual total loss of U.S. dollar purchasing power. Initially, these circumstances should unwind the sharp and generally ongoing rally in the U.S. dollar’s exchange rate since mid-2014, and broadly related selling pressures seen in the gold and silver markets.
A crash back to recognition of more-realistic domestic-economic circumstances appears to have begun, and it likely will be accompanied by a crash in the U.S. dollar versus major currencies, such as the Swiss franc, Canadian dollar and Australian dollar; related rallies in precious metals and oil. Further, a sharp deterioration in the near-term outlook for domestic and global political stability continues and is of meaningful near-term risk for providing further fuel to heavy selling of the dollar.
Current Economic Issues versus Underlying U.S. Dollar Fundamentals. U.S. economic activity is turning down anew, despite overstated growth in recent GDP reporting. GDP and other major economic series face heavy downside-benchmark revisions through the end of July. Weak, underlying economic reality has begun to surface in headline reporting and should become increasingly and painfully obvious to the financial markets in the headline detail and revisions of the weeks and months ahead, for series such as real retail sales, production, housing and construction, the trade deficit, payroll employment and increasingly the headline GDP.
As financial-market expectations shift towards renewed or deepening recession, that circumstance, in confluence with other fundamental issues, particularly deteriorating domestic political conditions, should intensify mounting and eventually massive selling pressures against the U.S. dollar, fully reversing the dollar’s gains of the last nine months, pushing the dollar once again to historic lows. Again, the nascent currency crisis also has meaningful potential to resurrect elements of the Panic of 2008.
Unexpected economic weakness intensifies the known stresses on an already-impaired banking system, increasing the perceived need for expanded, not reduced, quantitative easing. The highly touted "tapering" by the FOMC ran its course. Future, more-constructive Fed behavior—purportedly moving towards normal monetary conditions in what had been an unfolding, purportedly near-perfect economic environment—was pre-conditioned by a continued flow of "happy" economic news. Suggestions that all was right again with world were nonsense. The Panic of 2008 never was resolved, and the Fed increasingly is finding that it has no easy escape from its quantitative easing (QE3), which continues. Only overt expansion of QE3 ceased; QE4 will become the near-term question.
Unexpected economic weakness—a renewed downturn—also savages prospective federal budget deficit prognostications (particularly the 10-year versions). It also throws off estimates of U.S. Treasury funding needs and estimates as to how long the Treasury effectively can dodge the limits of the recently re-imposed debt ceiling. Current fiscal "good news" remains from cash-based, not GAAP-based and accounting projections and is heavily impacted by changes in business activity.
The economy has not recovered; the banking system is far from stable and solvent; and the Federal Reserve and the federal government still have no way out. Significant banking-system and other systemic (i.e. U.S. Treasury) liquidity needs will be provided, as needed, by the Fed, under the ongoing political cover of a weakening economy—a renewed, deepening contraction in business activity. The Fed has no choice. Systemic collapse is not an option for the Board of Governors. This circumstance simply does not have a happy solution.
Accordingly, any significant, renewed market speculation as to an added round of Federal Reserve quantitative easing, QE4, may become a major factor behind crashing the dollar and boosting the price of gold. The Fed has strung out its options for propping up the system as much as it thought it could, with continual, negative impact on the U.S. economy. The easings to date, however, appear to have been largely a prop to the increasingly unstable equity markets.
Again, in the event of a QE4, any resulting renewed boost to U.S. equities would be a fleeting illusion, at least in terms of real value (purchasing power of the dollar). Such gains would tend to be losses, in real terms, with the stocks valued in terms of Swiss francs, for example, or valued against what would become a rapidly-increasing pace of domestic U.S. inflation.
All these crises should combine against the U.S. dollar, likely in the very-near future, if they have not already begun to do so. That said, recent faux market perceptions of domestic economic, financial-system and monetary tranquility had boosted the U.S. dollar’s strength significantly in global trading and contributed to savaging the prices of oil and in weakening the prices of precious metals. That process appears to have begun to reverse.
Strength in the U.S. dollar should continue to reverse, sharply in the context of underlying reality outlined here and in the sections that follow. The actual fundamental problems threatening the U.S. dollar could not be worse. The broad outlook has not changed; it is just a matter of market perceptions shifting anew, against the U.S. currency. That process may have started with the shift in Swiss National Bank policy early in the year, but it has become dominated by increasingly-negative global perceptions of stability in U.S. economic activity and Federal Reserve monetary policy. Key issues include, but are not limited to:
· A severely damaged U.S. economy, which never recovered post-2008, is turning down anew, with no potential for recovery in the near-term. The circumstance includes a renewed widening in the trade deficit, as well as ongoing severe, structural-liquidity constraints on the consumer, which are preventing a normal economic rebound in the traditional, personal-consumption-driven U.S. economy (see Commentary No. 711). Sharply-negative economic reporting shocks, versus softening consensus forecasts, still remain a heavily-favored, proximal trigger for the intensifying the unfolding dollar debacle.
· U.S. government unwillingness to address its long-term solvency issues. Those controlling the U.S. government have demonstrated not only a lack of willingness to address long-term U.S. solvency issues, but also the current political impossibility of doing so. The shift in control of Congress did not alter the systemic unwillingness to address underlying fundamental issues, specifically to bring the GAAP-based deficit into balance. Any current fiscal "good news" comes from cash-based, not GAAP-based accounting projections. The GAAP-based version continues to run around $5 trillion for the annual shortfall, while many in Washington look to continue increasing spending and to take on new, unfunded liabilities. The history and issues here are explored in the first installment of the Hyperinflation Report, as previously linked; the initial fiscal-2014 details were discussed in Commentary No. 672, and the official GAAP-based financial statements for 2014 will be discussed fully, soon (see Commentary No. 702). This circumstance now is operating in the context of the formal constraint of a renewed debt ceiling.
· Monetary malfeasance by the Federal Reserve, as seen in central bank efforts to provide liquidity to a troubled banking system, and also to the U.S. Treasury. Despite the end of the Federal Reserve’s formal asset purchases, the U.S. central bank monetized 78% of the U.S. Treasury’s fiscal-2014 cash-based deficit (see Commentary No. 672). The quantitative easing QE3 asset purchase program effectively monetized 66% of the total net issuance of federal debt to be held by the public during the productive life of the program (beginning with the January 2013 expansion of QE3). The monetization process was completed with the Federal Reserve refunding the interest income it earned on the Treasury securities to the U.S. Treasury. With highly tenuous liquidity conditions for the banking system and the Treasury, it would not be surprising in this period of increasing instability to see covert Federal Reserve activities masked in the purchases of Treasury debt by nations or other entities financially friendly to or dependent upon the United States. Renewed expansion to quantitative easing remains likely, given ongoing banking-system stresses, vulnerable stock markets and weakening, actual U.S. economic activity. As has been commonplace, the Fed likely would seek political cover for new or expanded systemic accommodation in any "renewed" economic distress.
· Mounting domestic and global crises of confidence in a dysfunctional U.S. government. The positive rating by the public of the U.S. President tends to be an indicative measure of this circumstance, usually with a meaningful correlation with the foreign-exchange-rate strength of the U.S. dollar. The weaker the rating, the weaker tends to be the U.S. dollar. The positive rating for the President is off its historic low, but still at levels that traditionally are traumatic for the dollar. Chances of a meaningful shift towards constructive cooperation between the White House and the new Congress, in addressing fundamental issues are nil. Issues such as non-recovered, faltering economic activity and the consumer liquidity crisis, and addressing the nation’s long-range solvency issues should continue to devolve, into extreme political crisis.
· Mounting global political pressures contrary to U.S. interests. Downside pressures on the U.S. currency generally are mounting, or sitting in place, in the context of global political and military developments contrary to U.S. strategic, financial and economic interests. Current conditions include the ongoing situation versus Russia and extraordinarily-volatile circumstances in the Middle East. U.S. response to Russian activity in the Ukrainian situation likely was behind part of the recent strength in the U.S. dollar and related weakness in oil prices, with U.S. actions aimed at causing financial distress for Russia. These situations have yet to run their full courses, and they have the potential for rapid and massive negative impact on the financial and currency markets.
· Spreading global efforts to dislodge the U.S. dollar from its primary reserve-currency status. Active efforts or comments against the U.S. dollar continue to expand. In particular, anti-dollar rhetoric and actions have been seen with Russia, China, France, India and Iran, along with some regular rumblings in OPEC and elsewhere. Temporary, recent dollar strength may have bought some time versus those who have to hold dollars for various reasons. Nonetheless, developing short-term instabilities and a quick reversal in the dollar’s strength should intensify the "dump-the-dollar" rhetoric rapidly.
When the selling pressure breaks massively against the U.S. currency, the renewed and intensifying weakness in the dollar will place upside pressure on oil prices and other commodities, boosting domestic inflation and inflation fears. Domestic willingness to hold U.S. dollars will tend to move in parallel with global willingness, or lack of willingness, to do the same. These circumstances will trigger the early stages of a hyperinflation, likely in the year ahead.
Both the renewed dollar weakness and the resulting inflation spike should boost the prices of gold and silver, where physical holding of those key precious metals remains the ultimate hedge against the pending inflation and financial crises. Investors need to preserve the purchasing power and liquidity of their wealth and assets during the hyperinflation crisis ahead. Again, see Chapter 10, 2014 Hyperinflation Report—Great Economic Tumble for detailed discussion on approaches to handing the hyperinflation crisis and No. 692 Special Commentary: 2015 - A World Out of Balance, for other factors afoot in the current environment.
Monthly Gold Graphs and Related Comments. The following three graphs are from the traditional gold graphs that accompany the CPI Commentaries. The plots are updated through today, April 17th, reflecting late-afternoon New York prices for the "Latest April" points in the graphs. These basic graphs also update the Nominal Markets section of No. 692. As the developing sell-off in the U.S. dollar begins to gain some broadly-based pressure, offsetting sharp rallies should be seen on a coincident basis for gold and silver prices, as well as for oil prices.
Dollar Strength Distorts the Financial Markets. Discussed extensively in No. 692, continuing strength in the exchange-rate value of the U.S. dollar against other major Western currencies had been and tentatively still remains the primary distorting element in various financial markets. In the last month or two, however, U.S. dollar strength likely put in a top, as headline domestic economic activity pulled back, and as the Fed began to waffle on purportedly near-term interest rate hikes. Also, there have been stories of intervention aimed at providing some dollar support. At the same time, oil prices are off bottom, but fluctuating, perhaps resuming their upswing. Nonetheless, mixed selling pressure on the precious metals has continued in the last several weeks. These developments are reflected in the accompanying graphs. Physical gold and silver remain the primary hedges against all the financial and inflationary crises ahead.
__________
REPORTING DETAIL
CONSUMER PRICE INDEX—CPI (March 2015)
Headline March Inflation Rose by 0.2%, for Second Month; Annual Inflation Held on Downside of Unchanged. After seven months of ongoing selling pressure, oil and gasoline prices hit something of a bottom in January, with general prices and headline consumer inflation moving higher in February and March. Unadjusted, monthly retail gasoline prices jumped by 10.5% in March 2015 per the Bureau of Labor Statistics (BLS), up by 10.7% per the Department of Energy (DOE), but the bulk of that increase disappeared with negative seasonal adjustments to energy prices, leaving the headline CPI-U gain at a seasonally-adjusted 0.24%, up by 0.60% unadjusted, and down by 0.07% (-0.07%) unadjusted year-to-year.
The rally in oil prices had stalled in recent weeks, but appears to be picking up anew. A sustained increase in energy prices would be needed to keep headline inflation in positive territory. Where supply and demand factors appear to favor continued, relatively low oil prices, industry economics are kicking-in, increasingly altering those circumstances. Separately, a likely massive decline the U.S. dollar still looms in the not-too-distant future. Such an event would spike oil prices and other inflationary pressures sharply (see the Hyperinflation Summary Outlook).
Although the pace of annual CPI-U inflation also slowed with the recent decline in monthly oil prices, turning negative in January, formally flat in February and negative again in March, year-to-year inflation is not quite as soft as indicated by headline reporting, when considered in the context of traditional CPI reporting and common experience.
[The following two paragraphs are not changed from the prior Commentary, other than for a note on updating the Public Commentary on Inflation Measurement.]
Government Inflation Numbers Standardly Are Well Shy of Reality. Inflation as viewed from the standpoint of common experience—generally viewed by the public in terms of personal income or investment use—continues to run well above any of the government’s rigged price measures. CPI reporting methodologies in recent decades deliberately were changed so as to understate the government’s reporting of consumer inflation, and that inflation-understatement fraud is being expanded. The pace of inflation has been understated, through politically-orchestrated efforts to adjust for economic substitutions in the CPI surveying (i.e., hamburger being purchased in lieu of more-expensive steak), and by not reflecting actual out-of-pocket costs in its surveying, with generally downside hedonic-quality adjustments made to prices, all as detailed in the Public Commentary on Inflation Measurement, which will be updated in the near future for changing methodologies and continued exposition on the ShadowStats approaches for adjusting to same.
Contrary to its traditional structure, the CPI no longer reflects the cost of living of maintaining a constant standard of living. As a result, those who set or target their income or investment growth to the government’s faux headline CPI number simply cannot stay even with inflation, unless they massively exceed their targets. Allowing for the earlier CPI methodologies, actual year-to-year consumer inflation is not close to being flat, zero or minus (see the ShadowStats Alternate Inflation Measures).
Longer-Range Inflation Outlook. Going forward, as discussed generally in No. 692 and 2014 Hyperinflation Report—The End Game Begins – First Installment Revised, high risk of an intensifying massive flight from the U.S. dollar in the months ahead threatens to generate rapid, upside energy and global-commodity inflation, which would drive headline U.S. consumer inflation much higher. Nascent dollar problems appear to be surfacing and could accelerate at any time, with little further warning. Intensifying financial-market turmoil surrounding deteriorating global and domestic political, fiscal and monetary instabilities, and rapidly worsening economic activity, all should pummel the U.S. dollar, as discussed in the Hyperinflation Summary Outlook. Ongoing economic and financial-system-liquidity crises still threaten systemic instabilities that, as with their 2008 Panic precursors, cannot be contained without further, official actions that have serious inflation consequences.
__________________
Notes on Different Measures of the Consumer Price Index
The Consumer Price Index (CPI) is the broadest inflation measure published by the U.S. Government, through the Bureau of Labor Statistics (BLS), Department of Labor:
The CPI-U (Consumer Price Index for All Urban Consumers) is the monthly headline inflation number (seasonally adjusted) and is the broadest in its coverage, representing the buying patterns of all urban consumers. Its standard measure is not seasonally-adjusted, and it never is revised on that basis except for outright errors.
The CPI-W (CPI for Urban Wage Earners and Clerical Workers) covers the more-narrow universe of urban wage earners and clerical workers and is used in determining cost of living adjustments in government programs such as Social Security. Otherwise, its background is the same as the CPI-U.
The C-CPI-U (Chain-Weighted CPI-U) is an experimental measure, where the weighting of components is fully substitution based. It generally shows lower annual inflation rate than the CPI-U and CPI-W. The latter two measures once had fixed weightings—so as to measure the cost of living of maintaining a constant standard of living—but now are quasi-substitution-based. Since it is fully substitution based, the series tends to reflect lower inflation than the other CPI measures. Accordingly, the C-CPI-U is the "new inflation" measure being proffered by Congress and the White House as a tool for reducing Social Security cost-of-living adjustments by stealth. Moving to accommodate the Congress, the BLS introduced changes to the C-CPI-U estimation process with the February 26, 2015 reporting of January 2015 inflation, aimed at finalizing the C-CPI-U estimates on a more-timely basis, and enhancing its ability to produce lower headline inflation than the traditional CPI-U.
The ShadowStats Alternative CPI-U Measures are attempts at adjusting reported CPI-U inflation for the impact of methodological change of recent decades designed to move the concept of the CPI away from being a measure of the cost of living needed to maintain a constant standard of living. There are two measures, where the first is based on reporting methodologies in place as of 1980, and the second is based on reporting methodologies in place as of 1990.
__________________
CPI-U. The Bureau of Labor Statistics (BLS) reported this morning, April 17th, that headline, seasonally-adjusted March 2015 CPI-U rose month-to-month by 0.2%, up by 0.24% at the second decimal point, following a 0.2% headline gain, up by 0.22% at the second decimal point in February. Adjusted headline March inflation was heavily constrained by seasonal factors. On a not-seasonally-adjusted basis, the March 2015 CPI-U rose by 0.60% month-to-month, following an unadjusted February 2015 CPI-U monthly gain of 0.43%.
Major CPI-U Groups. Encompassed by the seasonally-adjusted gain of 0.24% in the March CPI-U [up by an unadjusted 0.60%], aggregate March energy inflation rose for the month by an adjusted 1.14% [up by an unadjusted 4.14%]. In the other major CPI sectors, adjusted March food inflation fell by 0.18% (-0.18%) [down by 0.24% (-0.24%) unadjusted], while adjusted "core" inflation was up by 0.23% [up by 0.41% unadjusted] for the month. Separately, core CPI-U inflation showed unadjusted year-to-year inflation of 1.75% in March 2015, versus 1.69% in February 2015.
Year-to-Year CPI-U. Not seasonally adjusted, March 2015 year-to-year inflation for the CPI-U was down by a headline 0.1% (-0.1%), down by 0.07% (-0.07%) at the second decimal point, versus a headline "unchanged" at 0.0%, down by 0.03% (-0.03%) at the second decimal point in February 2015.
Year-to-year, CPI-U inflation would increase or decrease in next month’s April 2015 reporting, dependent on the seasonally-adjusted monthly change, versus an adjusted 0.19% monthly inflation gain reported for April 2014. The adjusted change is used here, since that is how consensus expectations are expressed. To approximate the annual unadjusted inflation rate for April 2015, the difference in April’s headline monthly change (or forecast of same), versus the year-ago monthly change, should be added to or subtracted directly from the March 2015 negative annual inflation rate of 0.07% (-0.07%). Headline monthly inflation approaching roughly 0.3% would be needed in April 2015 in order to push the headline annual CPI-U inflation rate into positive territory at that time.
CPI-W. The March 2015 seasonally-adjusted, headline CPI-W, which is a narrower series and has greater weighting for gasoline than does the CPI-U, rose by 0.29% month-to-month (up by 0.71% unadjusted), versus a gain of 0.26% (up by 0.49% unadjusted) in February.
Year-to-Year CPI-W. Unadjusted, March 2015 year-to-year CPI-W inflation fell by 0.65% (-0.65%), versus a decline of 0.63% (-0.63%) in February 2015.
Chained-CPI-U. Initial reporting of unadjusted year-to-year inflation for the March 2015 C-CPI-U was an annual contraction of 0.41% (-0.41%), versus a year-to-year decline of 0.50% (-0.50%) in February 2015. See the opening notes in the CPI Section of Commentary No. 699 as to recent changes to C-CPI-U reporting.
Alternate Consumer Inflation Measures. Adjusted to pre-Clinton methodologies—the ShadowStats-Alternate Consumer Inflation Measure (1990-Base)—year-to-year annual inflation was roughly 3.5% in March 2015, versus 3.6% in February 2015.
The March 2015 ShadowStats-Alternate Consumer Inflation Measure (1980-Base), which reverses gimmicked changes to official CPI reporting methodologies back to 1980, was at about 7.5% (7.51% for those using a second decimal point) year-to-year, versus 7.6% in February 2015.
[The balance of the text in this Alternate Consumer Inflation Measures sub-section is unchanged from the prior CPI Commentary.]
Note: The ShadowStats-Alternate Consumer Inflation Measure largely has been reverse-engineered from the BLS’s CPI-U-RS series, which provides an official estimate of historical inflation, assuming that all current methodologies were in place going back in time. The ShadowStats estimates effectively are adjusted on an additive basis for the cumulative impact on the annual inflation rate of various methodological changes made by the BLS (the series is not recalculated).
Over the decades, the BLS has altered the meaning of the CPI from being a measure of the cost of living needed to maintain a constant standard of living, to something that neither reflects the constant-standard-of-living concept nor measures adequately what most consumers view as out-of-pocket expenditures. Roughly five percentage points of the additive ShadowStats adjustment reflect the BLS’s formal estimate of the annual impact of methodological changes; roughly two percentage points reflect changes by the BLS, where ShadowStats has estimated the impact not otherwise published by the BLS. (See Public Commentary on Inflation Measurement for further details.)

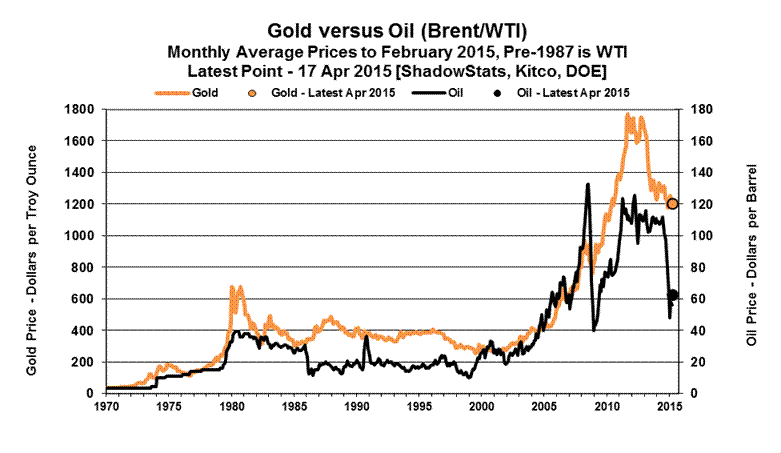
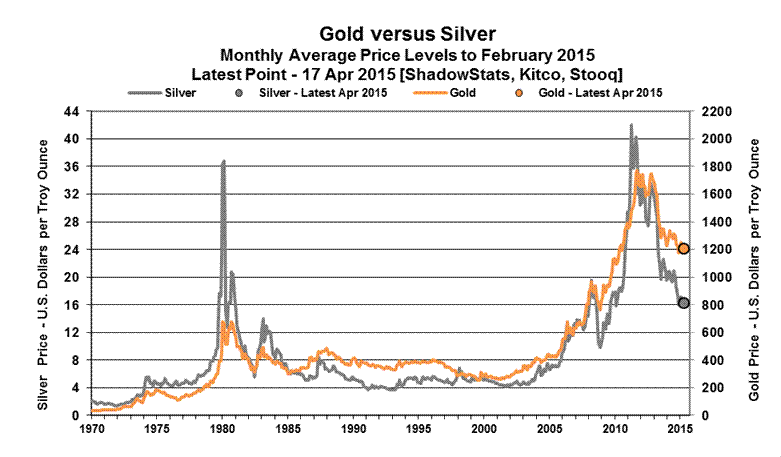
Gold and Silver Historic High Prices Adjusted for March 2015 CPI-U/ShadowStats Inflation—
CPI-U: GOLD at $2,580 per Troy Ounce, SILVER at $150 per Troy Ounce
ShadowStats: GOLD at $11,769 per Troy Ounce, SILVER at $685 per Troy Ounce
Despite the September 5, 2011 historic-high gold price of $1,895.00 per troy ounce (London afternoon fix), and despite the multi-decade-high silver price of $48.70 per troy ounce (London fix of April 28, 2011), gold and silver prices have yet to re-hit their 1980 historic levels, adjusted for inflation. The earlier all-time high of $850.00 (London afternoon fix, per Kitco.com) for gold on January 21, 1980 would be $2,580 per troy ounce, based on March 2015 CPI-U-adjusted dollars, and $11,769 per troy ounce, based on March 2015 ShadowStats-Alternate-CPI (1980-Base) adjusted dollars (all series not seasonally adjusted).
In like manner, the all-time high nominal price for silver in January 1980 of $49.45 per troy ounce (London afternoon fix, per silverinstitute.org)—although approached in 2011—still has not been hit since 1980, including in terms of inflation-adjusted dollars. Based on March 2015 CPI-U inflation, the 1980 silver-price peak would be $150 per troy ounce and would be $685 per troy ounce in terms of March 2015 ShadowStats-Alternate-CPI (1980-Base) adjusted dollars (again, all series not seasonally adjusted).
As shown in Table 1, on page 31 of 2014 Hyperinflation Report—The End Game Begins – First Installment Revised, over the decades, the increases in gold and silver prices have compensated for more than the loss of the purchasing power of the U.S. dollar as reflected by CPI inflation. They also effectively have come close to fully compensating for the loss of purchasing power of the dollar based on the ShadowStats-Alternate Consumer Price Measure (1980-Methodologies Base).
Real (Inflation-Adjusted) Retail Sales—March 2015—Annualized First-Quarter Contraction of 2.0%. In nominal terms, before adjustment for inflation, headline monthly retail sales rose by a statistically-significant, seasonally-adjusted 0.86% in March 2015, following a revised decline of 0.46% (-0.46%) [previously down by 0.58% (-0.58%)] in February 2015, discussed in Commentary No. 712.
Headline Reporting of Real Retail Sales. Based on today’s (April 17th) reporting of a headline monthly gain of 0.24% in the March 2015 CPI-U, and in the context of a gain of 0.22% in the February CPI-U, real retail sales rose by a headline 0.63% in March 2015, and declined by a revised 0.68% (-0.68%) [initially down by 0.80% (-0.80%)] in February. Those numbers set first-quarter 2015 real retail sales at an annualized 2.0% (-2.0%) quarterly pace of contraction versus fourth-quarter 2014 real activity.
First-Quarter Contraction Was Worst Since Economic Collapse. First-quarter 2015 real retail sales, based on full reporting, contracted at an annualized pace of 1.99% (-1.99%), versus fourth-quarter 2014 activity, which, in turn was up at an annualized pace of 2.72% from third-quarter 2014. The first-quarter 2015 contraction in real retail sales was the steepest since a 5.68% quarterly real sales plunge in first-quarter 2009, at the depths of the economic collapse.
The last time real retail sales contracted on a quarterly basis was first-quarter 2014, down then by an annualized 0.10% (-0.10%). With positive inflation at that time, nominal first-quarter 2014 retail sales rose at an annualized pace of 1.99% [first-quarter 2015 nominal retail sales contracted at an annualized pace of 4.99% (-4.99%)]. Nonetheless, headline real GDP also last contracted in first-quarter 2014, mirroring the real retail sales activity. A similar mirroring of contracting, quarterly activity has become increasingly likely for first-quarter 2015 real GDP, as noted in the Opening Comments.
Real Year-to-Year Growth Slowed Markedly. Year-to-year change in March 2015 real retail sales slowed to 1.40%, versus a revised 1.96% [previously up by 1.77%] in February 2015. In normal economic times, annual real growth at or below 2.0% would signal an imminent recession. That signal was just renewed and had been given otherwise, recently. The signal is in play and likely will serve as an indicator of renewed downturn in broad economic activity. The second and fourth graphs following show annual real growth in retail sales.
Separately, discussed and detailed in Commentary No. 711, the underlying issue with current retail sales activity remains intense, structural-liquidity woes besetting the consumer. That circumstance—in the last seven-plus years of economic collapse and stagnation—has continued to prevent a normal recovery in broad U.S. economic activity.
As official consumer inflation continues its upturn in the months ahead, and as overall retail sales continue to suffer from the ongoing consumer liquidity squeeze—reflected partially by the general pattern of real earnings difficulties seen anew in the next section—these data should continue to trend meaningfully lower, in what should gain recognition as a formal "new" or double-dip recession.
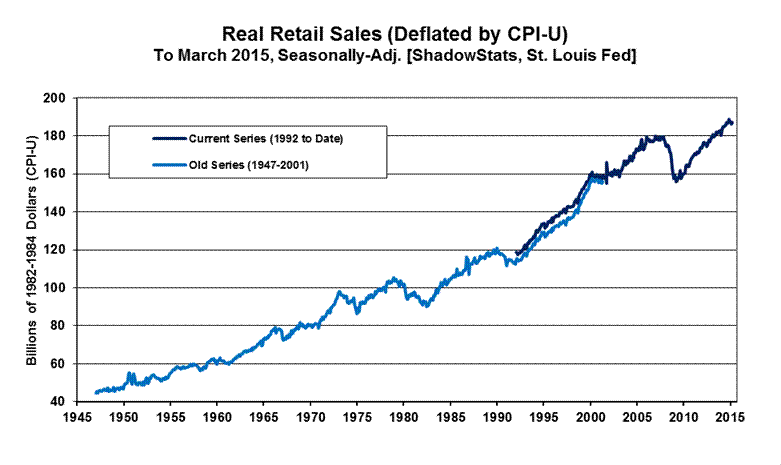
Real Retail Sales Graphs. The first of the four graphs following shows the level of real retail sales activity (deflated by the CPI-U) since 2000; the second graph shows year-to-year percent change for the same period. The level of headline monthly activity turned lower for the third month, in February 2015, showing signs of faltering sales. March showed some rebound, but the quarter remained in contraction. Year-to-year activity, which had plunged to a near-standstill in January and February 2014, had bounced back irregularly, hitting its recent high level in January 2015, spiked by negative inflation at the time, but it fell back below two-percent in February and March 2015. The third and fourth graphs show the level of, and annual growth in, real retail sales (and its predecessor series) in full post-World War II detail.
Irrespective of near-term reporting weakness and quarterly contractions, the apparent previous “recovery” in the real retail sales series and (and series such as industrial production and GDP) up through year-end 2014 was due to the understatement of the rate of inflation used in deflating retail sales and other series. As discussed more fully in Chapter 9 of 2014 Hyperinflation Report—Great Economic Tumble – Second Installment, deflation by too-low an inflation number (such as the CPI-U) results in the deflated series overstating inflation-adjusted economic growth.
As shown in the latest "corrected" real retail sales graph, in the Opening Comments section, with the deflation rates corrected for the understated inflation reporting of the CPI-U, the recent pattern of real sales activity has turned increasingly negative. The corrected graph shows that the post-2009 period of protracted stagnation ended, and a period of renewed and extended contraction began in second-quarter 2012. The corrected real retail sales numbers use the ShadowStats-Alternate Inflation Measure (1990-Base) for deflation instead of the CPI-U.

Real (Inflation-Adjusted) Average Weekly Earnings—March 2015—Down by 0.4% for the Month. Coincident with today’s (April 17th) reporting of a headline, seasonally-adjusted monthly gain of 0.29% in March 2015 CPI-W, the BLS also published real average weekly earnings for the month of March (deflated by CPI-W). The gain in the March CPI-W followed a headline monthly gain of 0.26% in the February 2015 inflation measure.
In the production and nonsupervisory employees category—the only series for which there is a meaningful history—headline real average weekly earnings fell by 0.40% (-0.40%) in March 2015. That followed a revised headline monthly gain of 0.09% [previously down by 0.26% (-0.26%)] in February and a revised 1.08% gain [previously up by 1.33%, initially up by 0.98%] in January. The revisions fully reflected regular surveying instabilities by the BLS as to earnings. Before inflation adjustment, March earnings fell by 0.1% (-0.1%) for the month, with monthly gains of 0.3% and 0.1% in February and January.
Year-to-year and seasonally-adjusted, March 2015 real average weekly earnings eased back to a gain of 2.35%, from a revised 3.28% (previously 3.18%) in February 2015, and a revised 3.54% (previously and initially 3.80%) in January 2015. Unadjusted, year-to-year changes were 2.06% in March 2015, 2.01% in February 2015, and 0.43% in January 2015. Both the monthly and annual fluctuations in this series are irregular, but current reporting remains well within the normal bounds of volatility, with the exception of the unusual recent inflation patterns.
The regular graph of this series is shown in the Opening Comments section, plotting earnings as officially deflated by the BLS (red-line), and as adjusted for the ShadowStats-Alternate CPI Measure, 1990-Base (blue-line). When inflation-depressing methodologies of the 1990s began to kick-in, the artificially-weakened CPI-W (also used in calculating Social Security cost-of-living adjustments) helped to prop up the reported real earnings. Official real earnings today still have not recovered their inflation-adjusted levels of the early-1970s, and, at best, have been flat for the last decade. Deflated by the ShadowStats measure, real earnings have been in fairly-regular decline for the last four decades, which is much closer to common experience than the pattern suggested by the CPI-W. See Public Commentary on Inflation Measurement for further detail.
That said, the recent sharp decline in headline monthly inflation generated a temporary, but visible spike in the real-earnings levels of December and January, now pulling back with the February and March detail.
Real (Inflation-Adjusted) Money Supply M3—March 2015. The signal for a double-dip, multiple-dip or simply protracted, ongoing recession, based on annual contraction in the real (inflation-adjusted) broad money supply (M3), remains in place and continues, despite real annual M3 growth having rallied in positive territory for several years. As shown in the accompanying graph—based on March 2015 CPI-U reporting and the latest ShadowStats-Ongoing M3 Estimate—annual inflation-adjusted growth in M3 for March 2015 annual growth eased back to 5.7%, from a revised 5.8% in February. Such reflected some slowing in the pace of nominal annual headline M3 growth, plus a small offsetting negative swing in the annual inflation rate.
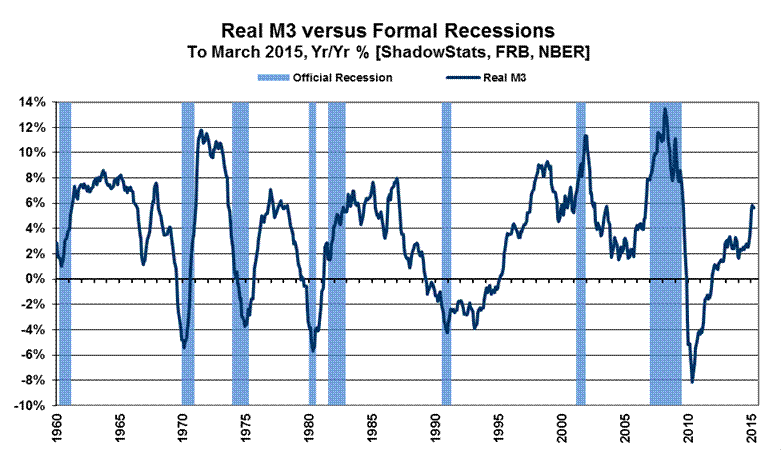
The signal for a downturn or an intensified downturn is generated when annual growth in real M3 first turns negative in a given cycle; the signal is not dependent on the depth of the downturn or its duration. Breaking into positive territory does not generate a meaningful signal one way or the other for the broad economy. The current downturn signal was generated in December 2009, even though there had been no upturn since the economy hit bottom in mid-2009. The broad economy tends to follow in downturn or renewed deterioration roughly six-to-nine months after the signal. Weaknesses in a number of series have continued to the present, with significant new softness in recent reporting. Actual post-2009 economic activity has remained at relatively low levels of activity—in protracted stagnation.
Despite purported recovery in headline GDP activity, a renewed downturn in official data is well underway, and eventually should lead to official recognition of a “new” or double-dip recession. Reality remains that the economic collapse into 2009 was followed by a plateau of low-level economic activity—no meaningful upturn, no recovery from or end to the official 2007 recession—and the unfolding renewed downturn remains nothing more than a continuation and re-intensification of the downturn that began unofficially in 2006. Further discussion of this issue is found in Chapter 8 of the 2014 Hyperinflation Report—Great Economic Tumble – Second Installment, as well as No. 692.
RESIDENTIAL CONSTRUCTION—HOUSING STARTS (March 2015)
Housing Starts Have Moved from Down-Trending Stagnation to Quarterly Contraction. In the context of a small upside revision to February activity, and the usual monthly reporting instabilities, headline housing starts rose by a statistically-insignificant 2.0% in March 2015, confounding market expectations for a recuperative monthly surge of 15.9% [Bloomberg]—an expected rebound—following the purported sharp dampening effects of bad weather that still contributed to February’s revised headline monthly contraction of 15.3% (-15.3%) [previously down by 17.0% (-17.0%)]. As often is the case, none of the headline March 2015 housing starts monthly changes by category (mixed) and annual changes (all negative) came close to being statistically-significant.
Sharp Quarterly Contractions in Varied, Housing-Starts Activity. What had been a smoothed, down-trending stagnation in the general series has turned to renewed downturn, with first-quarter 2015 activity plunging versus activity in fourth-quarter 2014, with resulting downside pressure to the initial, April 29th estimate of first-quarter 2015 GDP growth (see GDP discussion in the Opening Comments).
By category, total housing starts fell at annualized pace of 31.0% (-31.0%) in first-quarter 2015, following an annualized gain of 13.4% in fourth-quarter 2014, and an annualized gain of 19.2% in third-quarter 2014.
Single-unit housing starts fell at annualized pace of 33.8% (-33.8%) in first-quarter 2015, following an annualized gain of 36.7% in fourth-quarter 2014, and an annualized gain of 18.2% in third-quarter 2014.
Multiple-unit housing starts (two-or-more units, primarily apartment buildings) fell at annualized pace of 25.2% (-25.2%) in first-quarter 2015, following an annualized decline of 19.6% (-19.6%) in fourth-quarter 2014, and an annualized gain of 21.1% in third-quarter 2014.
All three categories last fell together in first-quarter 2014, which also was the last time headline GDP contracted, at least as indicated in current headline GDP reporting (pre-July 30th GDP benchmark).
Smoothed Numbers. Nonetheless, a general pattern of weakening stagnation continued in this series, as best viewed in terms of the longer-range historical graph of aggregate activity, seen at the end of this section, and in the context of the down-trending activity—a renewed downturn—smoothed by six-month moving averages, as shown in graphs of the Opening Comments section.
Reflected in those smoothed graphs, the aggregate housing-starts series continued to weaken in March, dominated, as usual, by the personal housing sector (single-unit starts). Although there had been a minor upside trend in the aggregate series into the latter part of 2014, total housing-starts activity remained well below any recovery level and now has turned down anew. The bulk of the extreme reporting instability and the minimal uptrend in the aggregate series, over time, had been due largely to particularly-volatile reporting in the multiple-unit housing-starts category (apartments, etc.). Where recent activity in multiple-unit starts actually recovered into the general range of pre-recession activity, that process topped out in third-quarter 2014, with those starts now trending lower in monthly reporting, including on a six-month moving-average basis. Still, the recent impact of the temporary recovery in multiple-unit activity largely was lost in the detail of total housing starts.
Structural Liquidity Issues Constrain Consumer Housing Activity. Again, on a per structure basis, activity in housing starts is dominated by the single-unit housing starts category, which has remained stagnant—at a low level of activity—since hitting bottom in early-2009. The private housing sector never recovered from the business collapse of 2006 into 2009.
The underlying problem here remains intense, structural-liquidity woes besetting the consumer. That circumstance, during the last eight-plus years of economic collapse and stagnation, has continued to prevent a normal recovery in broad U.S. business activity, as updated in Commentary No. 711 and discussed and detailed in No. 692 Special Commentary: 2015 - A World Out of Balance.
Without real growth in income, and without the ability and/or willingness to offset declining purchasing power with debt expansion, the consumer lacks the wherewithal to fuel sustainable, consumption-based growth or recovery in U.S. economic activity. That includes not only residential investment and related construction spending, but also retail sales and the still-dominant personal-consumption account of the GDP, as further noted in the Real Retail Sales section of the March CPI discussion.
March 2015 Housing-Starts Headline Reporting. The Census Bureau reported April 16th, a statistically-insignificant, seasonally-adjusted headline monthly gain of 2.0% +/- 15.2% (all confidence intervals are expressed at the 95% level) in March 2015 housing starts. That followed a revised monthly contraction in February of 15.3% (-15.3%) [previously down by 17.0% (-17.0%)], and a revised monthly decline of 0.8% (-0.8%) [previously "unchanged," initially down by 2.0% (-2.0%)] in January. Net of prior-period revisions, the headline March change was a statistically-insignificant gain of 3.2%.
Year-to-year change in the seasonally-adjusted, aggregate March 2015 housing-starts measure was a statistically-insignificant decline of 2.5% (-2.5%) +/- 13.5%, versus a revised annual contraction of 2.2% (-2.2%) [previously down by 3.3% (-3.3%)] in February 2015, and a revised 19.5% [previously 20.5%, initially 18.7%] gain in January 2015.
The headline March 2015 monthly gain of 2.0% for total housing starts was dominated by a headline monthly increase of 4.4% in the "one unit" category, with a drop of 7.1% (-7.1%) in the “five units or more” category, but with none of those headline changes coming close to being statistically-significant.
By-Unit Category (See Graphs in the Opening Comments). Where the irregular housing starts series can show varying patterns, that partially is due to a reporting mix of residential construction products, with the largest physical-count category of one-unit structure housing starts—generally for individual consumption, resulting in new home sales—versus multi-unit structure starts that generally reflect the building of rental and apartment units.
Housing starts for single-unit structures in March 2015 rose month-to-month by a statistically-insignificant 4.4% +/- 14.4%, following a revised February decline of 15.2% (-15.2%) [previously down by 14.9% (-14.9%)] and a revised January decline of 3.7% (-3.7%) [previously down by 3.9% (-3.9%), initially down by 6.7% (-6.7%)]. Single-unit starts for March 2015 showed a statistically-insignificant year-to-year annual decline of 2.7% (-2.7%) +/- 10.4%, following a revised annual gain of 0.5% [previously up by 0.7%] in February, and a revised annual gain of 19.7% [previously up by 19.6%, initially up by 16.3%] in January 2015.
Housing starts for apartment buildings (generally 5-units-or-more) in February 2015 fell month-to-month by a statistically-insignificant 7.1% (-7.1%) +/- 34.4%, following a revised February headline decline of 16.0% (-16.0%) [previously down by 21.6% (-21.6%)], and a revised headline January gain of 9.5% [previously up by 12.8%, initially up by 12.1%]. The statistically-insignificant March 2015 year-to-year decline of 4.7% (-4.7%) +/- 36.2% followed a revised annual decline of 5.8% (-5.8%) [previously down by 9.5% (-9.5%)] in February 2015, and a revised 20.3% [previously 23.9%, initially 24.5%] gain in January 2015.
Expanding the multi-unit structure housing starts category to include 2-to-4-units plus 5-units-or-more usually reflects the bulk of rental- and apartment-unit activity. The Census Bureau does not publish estimates of the 2-to-4-units category, due to statistical significance problems (a general issue for the aggregate series). Nonetheless, the total multi-unit category can be calculated by subtracting the single-unit category from the total category.
Accordingly, the statistically-insignificant March 2015 gain of 2.0% in aggregate housing starts was composed of a statistically-insignificant gain of 4.4% in one-unit structures, combined with a statistically-insignificant monthly drop of 2.5% (-2.5%) in the multiple-unit structures category (2-units-or-more, including the 5-units-or-more category). Again, these series are graphed in the Opening Comments section.
Housing Starts Graphs. Headline reporting of housing starts activity is expressed by the Census Bureau as an annualized monthly pace of starts, which was 926,000 in March 2015, versus a revised 908,000 (previously 897,000) in February 2015, and a revised 1,072,000 (previously 1,081,000, initially 1,065,000) in January 2015. Those annualized numbers are used in the scales of the accompanying aggregate graphs.
Nonetheless, given the nonsensical monthly volatility in reporting and the exaggerated effect of annualizing the monthly numbers in this unstable series, the magnitude of monthly activity and the changes in same, more realistically are reflected at the non-annualized monthly rate. Consider that the revised headline 164,000 month-to-month decline in housing starts, from January 2015 to February 2015, was larger than any actual total (non-annualized) monthly starts level for a single month, since before the recession.
Accordingly, the monthly rate of 77,167 units in March 2015, instead of the annualized 926,000-headline number, is used in the scaling of the series of graphs shown in the Opening Comments. With the use of either scale of units, however, appearances of the graphs and the relative monthly, quarterly and annual percentage changes are otherwise identical.
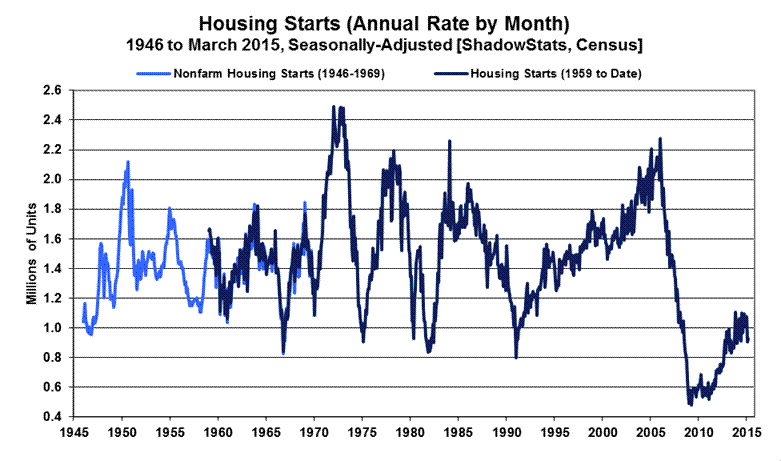
The record monthly low seen for the present aggregate series was in April 2009, where the annualized monthly pace of sales then was down 79% (-79%) from the January 2006 pre-recession peak. Against the downside-spiked low in April 2009, the March 2015 headline number was up by 94%, but it still was down by 59% (-59%) from the January 2006 series high. Shown in the historical perspective of the post-World War II era, in the preceding, current activity is trending stagnant-to-lower at levels that otherwise have been at the historical troughs of recession activity of the last 70 years.
__________
WEEK AHEAD
Headline Reporting and Revisions Should Trend Much Weaker versus a Still Overly-Optimistic Economic Consensus; Inflation Will Rise Anew, Following the Bottoming of Oil-Prices. Shifting more to the downside, amidst increasingly-negative fluctuations in the numbers, market expectations for business activity have been, and still remain, overly optimistic. They still exceed any potential, underlying economic reality, even though downside corrective revisions and an accelerating pace of downturn in broad-based, monthly headline economic reporting already have begun to hammer those expectations. Recent GDP excesses will not face downside revisions until the July 30, 2015 GDP benchmark revision, but expectations for headline growth estimates of first- and second-quarter 2015 increasing should shift quickly to the downside, into negative territory (see Commentary No. 711).
Headline CPI-U consumer inflation—recently driven lower by collapsing prices for gasoline and other oil-price related commodities—likely is close to its near-term, year-to-year low, having shown monthly declines in annual inflation of less than a full 0.1% (-0.1%) in the three months through March 2015. Significant upside inflation pressures should resume as oil prices rebound, a process that already may be underway, tentatively, and one that would accelerate rapidly with the eventual sharp downturn in the exchange-rate value of the U.S. dollar. These areas, the general economic outlook and longer range reporting trends are reviewed broadly in No. 692 Special Commentary: 2015 - A World Out of Balance.
A Note on Reporting-Quality Issues and Systemic-Reporting Biases. Significant reporting-quality problems remain with most major economic series. Beyond gimmicked changes to reporting methodologies of the last several decades, ongoing headline reporting issues are tied largely to systemic distortions of seasonal adjustments. Data instabilities were induced partially by the still-evolving economic turmoil of the last eight years, which has been without precedent in the post-World War II era of modern-economic reporting. The severity and ongoing nature of the downturn provide particularly unstable headline economic results, when concurrent seasonal adjustments are used (as with retail sales, durable goods orders, employment, and unemployment data, see the prior labor data related Commentary No. 695). Combined with recent allegations of Census Bureau falsification of data in its monthly Current Population Survey (the source for the Bureau of Labor Statistics’ Household Survey), these issues have thrown into question the statistical-significance of the headline month-to-month reporting for many popular economic series (see Commentary No. 669).
PENDING RELEASES:
Existing- and New-Home Sales (March 2015). March 2015 existing-home sales are due for release on Wednesday, April 22nd, from the National Association of Realtors, with the March 2015 new-home sales report due from the Census Bureau on Thursday, April 23rd. ShadowStats will cover both series in the planned April 24th regular Commentary. Still impaired by the negative, underlying fundamental pressures similar to those seen pummeling housing construction (see Housing Starts detail in Opening Comments and Commentary No. 711), the outlook for home-sales activity remains bleak.
Generally-negative trends in headline monthly reporting of existing-home sales likely continued in March, with flat-to-downside month-to-month activity.
Smoothed for extreme and nonsensical monthly gyrations, an ongoing pattern of stagnation or downturn also should be in play for March new-home sales. While monthly changes in activity rarely are statistically-significant for this series, still-unstable reporting and revisions (both likely to the downside) remain a fair bet for March sales. Reflecting intensifying consumer issues, both the new- and existing- home sales series increasingly should reflect downside volatility in headline activity.
New Orders for Durable Goods (March 2015). Reporting of March 2015 new orders for durable goods is scheduled for Friday, April 24th, by the Census Bureau. Net of the irregular activity in commercial aircraft orders, aggregate orders likely continued a pattern of down-trending stagnation. Real orders contracted quarterly as of the fourth-quarter 2014, and were on track for a second quarterly contraction in first-quarter 2015. Again, net of commercial aircraft, that should be confirmed in place.
Commercial aircraft orders are booked for the long-term—years in advance—so they have only limited impact on near-term production. Further, by their nature, these types of orders do not lend themselves to seasonal adjustment. Accordingly, the durable goods measure that best serves as a leading indicator to broad production—a near-term leading indicator of economic activity and GDP—is the activity in new orders, ex-commercial aircraft. Net of volatility in commercial-aircraft orders in recent months, real new orders had been trending lower, a pattern likely to continue with headline March reporting.
__________