No. 740: June Trade Deficit, Construction Spending and Consumer Conditions
COMMENTARY NUMBER 740
June Trade Deficit, Construction Spending and Consumer Conditions
August 5, 2015
__________
June Trade Deficit Deterioration Suggests
Small Downside Revision to Second-Quarter GDP Growth
"Soft" June Construction Spending
Was in Context of Upside Revisions and Rising Inflation
Consumer Conditions Appear to Be Weakening Anew
___________
PLEASE NOTE: The next regular Commentary, scheduled for Friday, August 7th, will cover July Employment and Unemployment, and July Money Supply M3.
Best wishes to all — John Williams
OPENING COMMENTS AND EXECUTIVE SUMMARY
Economic Outlook Remains Bleak. In the general scope of what was described in prior Commentary No. 739 as an unfolding, multiple-dip economic collapse, the June 2015 reporting on the trade deficit and construction spending offered little new in terms of the broad outlook. Where headline June construction spending was flat, after inflation adjustment, and despite volatile, upside revisions since March, the aggregate construction series continued in a pattern of low-level but up-trending stagnation. The series still has failed to regain its pre-recession high, holding at 29% below that benchmark.
Construction activity—tied to the residential sector—remains constrained by consumer liquidity issues. Discussed below, consumer income and confidence measures have been turning increasingly negative in the last month or two.
The June trade data were slightly more negative than had been indicated in last week’s "advance" report. With full quarterly detail now available, the second-quarter deficit already suggests a minor downside revision to the initial second-quarter GDP growth estimate.
Reporting of July employment and unemployment on Friday (July 7th) has a fair chance of confirming the intensifying, unfolding economic downturn. The ShadowStats Commentary covering that labor detail will offer a broad review of upcoming economic reporting, in the context of those new numbers.
Today’s Missive (August 5th). The balance of today’s Opening Comments addresses the headline detail on the June trade shortfall, June construction spending and the latest measures of consumer conditions.
A revised Hyperinflation Watch section is planned for Friday’s (June 7th) Commentary No. 741. Elements of the update have been discussed piecemeal in recent Opening Comments (see Commentary No. 737, Commentary No. 738 and Commentary No. 739, for example), but the basic outlook and underlying fundamentals have not changed. The most-recent version of the summary outlook remains available in Commentary No. 735.
The Week Ahead section previews Friday’s (August 7th) reporting of the July employment and unemployment reporting, updated for consensus expectations.
Consumer Conditions—July Confidence and Sentiment Turned Down. Updating Commentary No. 734 of July 14th, and as otherwise discussed regularly in these Commentaries (see detail in No. 692 Special Commentary: 2015 - A World Out of Balance), structural liquidity woes have constrained domestic economic activity, severely, since before the Panic of 2008. Never recovering in the post-Panic era, limited income, credit and a faltering consumer outlook have eviscerated and continue to impair business activity that feeds off the financial health and liquidity of consumers.
Without real (inflation-adjusted) growth in household income and without the ability or willingness to take on meaningful new debt, the consumer simply has not had the wherewithal to fuel sustainable economic growth. Impaired consumer liquidity and its direct restraints on consumption have been responsible for much of the economic turmoil of the last eight-plus years, driving the housing-market collapse and ongoing stagnation in consumer-related real estate and construction activity, as well as constraining real retail sales activity and the related, personal-consumption-expenditures category of the GDP. Together, those sectors account for more than 70% of total U.S. GDP activity.
Underlying economic fundamentals simply have not supported, and do not support a turnaround in broad economic activity. There has been no economic recovery, and there remains no chance of meaningful, broad economic growth, without a fundamental upturn in consumer- and banking-liquidity conditions.
Recently released July readings on the Conference Board’s Consumer-Confidence and the University of Michigan’s Consumer-Sentiment measures are updated in the accompanying graphs, along with the latest readings on various liquidity measures shown previously: June median real monthly household income, May consumer credit outstanding and real first-quarter household-sector credit-market debt outstanding.
The first graph shows monthly real median household income through June 2015, as reported by www.SentierResearch.com. This measure of real (inflation-adjusted) monthly median household income turned lower in June, reflecting flat, month-to-month nominal median income hit by rising consumer inflation. A similar circumstance generated a headline plunge in second-quarter 2015 real average weekly earnings, discussed in Commentary No. 736. The income series has been in low-level stagnation, with a recent uptrend boosted by dropping gasoline prices. Where negative inflation boosts the level of real growth relative to nominal growth, recent relative "strength" in the series largely reflected temporary, gasoline-price-driven, headline month-to-month contractions in CPI-U reporting, and flat-to-minus annual inflation. That monthly inflation issue reversed in May and June reporting.
Where lower gasoline prices have provided some minimal liquidity relief to the consumer, indications are that any effective extra cash has been used to pay down unsustainable debt, not to fuel new consumption. Despite recent, renewed downside pressure on oil prices, relief from low-priced gasoline should prove increasingly fleeting. As the U.S. dollar resumes its decline, petroleum prices spike anew.
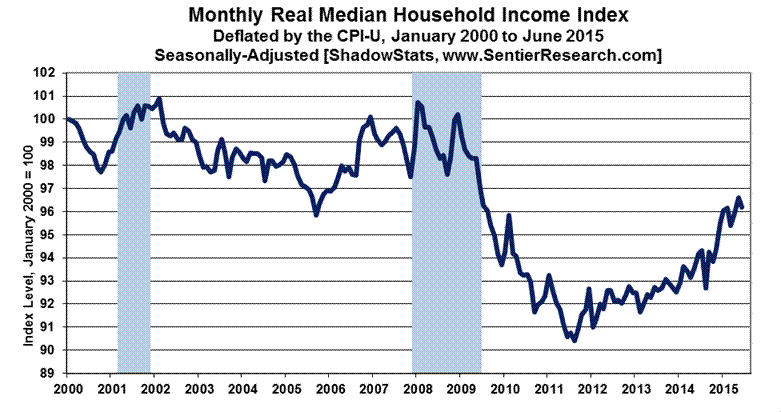
On a monthly basis, when headline GDP purportedly started its solid economic recovery in mid-2009, household income plunged to new lows and has yet to recover its level seen during the formal recession, or the pre-recession highs either for the 2007 recession or the 2001 recession.
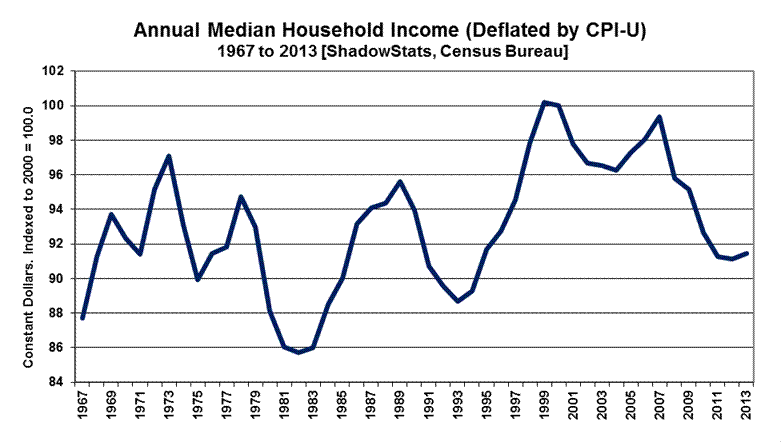
Shown in the second graph, the same series, published by the Census Bureau on an annual basis, deflated by headline CPI-U, confirmed that in 2013—the latest-available annual data—annual real median household income continued to hold at a low level of activity (2014 data will be released on September 16th). In historical perspective, 2011, 2012 and 2013 income levels were below levels seen in the late-1960s and early-1970s. Such indicates the long-term nature of the evolution of the major structural changes squeezing consumer liquidity and impairing the current economy. Further discussion of these issues is found in No. 692 Special Commentary, Commentary No. 658, and in 2014 Hyperinflation Report—The End Game Begins – First Installment Revised and 2014 Hyperinflation Report—Great Economic Tumble – Second Installment.
The next three graphs reflect the latest headline activity in consumer confidence and sentiment. The Conference Board’s Consumer-Confidence Index and the University of Michigan’s Consumer-Sentiment Index for July 2015 both fell in the month, with downturns also seen in their respective three-month and six-month moving-average readings. The confidence and sentiment series tend to mimic the tone of headline economic reporting in the press, and often are highly volatile month-to-month, as a result. With increasingly-negative, headline economic reporting ahead, negative hits to both the confidence and sentiment readings are likely to continue in the months ahead.


Smoothed for the irregular, short-term volatility, the two series remain at levels seen typically in recessions. Suggested in the third graph—plotted for the last 40 years—the latest readings of confidence and sentiment generally have not recovered levels seen preceding most formal recessions of the last four decades. Generally, the consumer measures remain well below, or are inconsistent with, periods of historically-strong economic growth seen in 2014 and ongoing positive GDP growth as recently reported.

The final two graphs in this section are unrevised, and address consumer borrowing. Debt expansion can help to make up for a shortfall in income growth. Shown in the first graph of Household Sector, Real Credit Market Debt Outstanding, household debt declined in the period following the Panic of 2008, and it has not recovered. The series includes mortgages, automobile and student loans, credit cards, secured and unsecured loans, etc., all deflated by the headline CPI-U. The level of real debt outstanding has remained stagnant for several years, reflecting, among other issues, lack of normal lending by the banking system into the regular flow of commerce. Updated through first-quarter 2015, the graph reflects the most-recent detail available from the Federal Reserve’s flow-of-funds data.
The slight upturn seen in the series in the two most-recent quarters, as with the median household income survey, was due partially to gasoline-price-driven, negative CPI inflation, which has begun to pass out of the system. It also reflected surging student loans, as shown in the next graph.
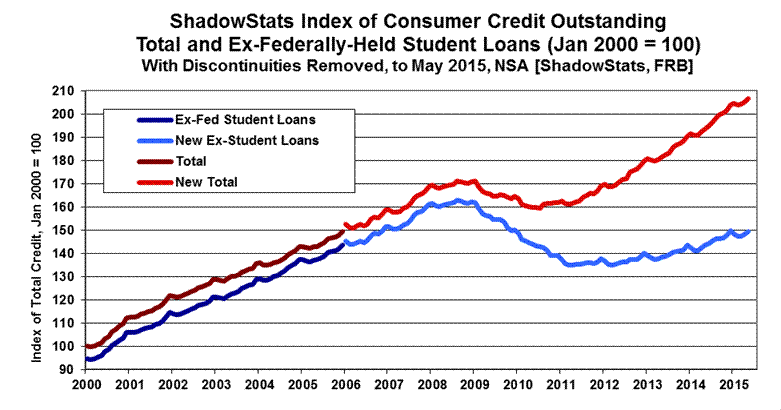
Through May 2015 reporting, the graph of monthly Consumer Credit Outstanding is a subcomponent of the prior graph on real household sector debt, but it is not adjusted for inflation. Post-2008 Panic, outstanding consumer credit has continued to be dominated by growth in federally-held student loans, not in bank loans to consumers that otherwise would fuel broad consumption growth. The nominal level of Consumer Credit Outstanding (ex-student loans) has not rebounded or recovered since the onset of the recession. These disaggregated data are available and plotted only on a not-seasonally-adjusted basis.
Again, consumer liquidity woes remain the basic constraint on broad economic activity in the United States, which remains heavily consumer oriented. Without real growth in income and/or debt expansion and willingness to take on new debt, and with consumer confidence and sentiment at levels consistent with a significant portion of consumers under financial stress, there has been no basis for a sustainable economic expansion since the Panic of 2008. There are no prospects for a recovery in the near term.

Trade Deficit—June 2015—Widened by Somewhat More Than Indicated in the "Advance" Reporting. The full detail of the June 2015 trade deficit reporting did not support the headline narrowing of the net-export-account deficit reflected in the "advance" estimate of second-quarter 2015 GDP (see Commentary No. 739). Instead, the underlying June trade detail indicated a net deterioration—a small widening—in the real quarterly deficit, with a suggestion of some minor downside revision for the August 27th second-estimate of second-quarter GDP.
In a related area, the headline widening in the June 2015 merchandise trade deficit was more than had been suggested by the July 30th "advance" estimate of the June trade detail. The early-headline estimation of the monthly deficit still appears to be of limited value, as discussed in Commentary No. 739. The "final" estimate of the June census-basis goods deficit was $62.639 billion, versus the "advance" estimate of $62.256 billion, but that was a net monthly deficit deterioration of $3.051 billion instead of the $1.132 billion deterioration suggested in the "advance" reporting, due to a narrowing of the headline May deficit, also in revision.
Nominal (Not-Adjusted-for-Inflation) June 2015 Trade Deficit. The nominal, seasonally-adjusted monthly trade deficit in goods and services for June 2015, on a balance-of-payments basis, widened by a headline $2.899 billion to $43.839 billion, versus a revised, narrower $40.940 billion in May 2015. The June 2015 nominal deficit also widened versus a $42.371 billion trade shortfall in June 2014.
In terms of month-to-month trade patterns, that headline $2.899 billion widening in the June deficit reflected a decline of $0.136 (-$0.136) billion in monthly exports, combined with a $2.762 billion increase in monthly imports [difference is in rounding]. The surge in imports reflected a $1.3 billion jump in pharmaceutical preparations and an increase of $0.9 billion in crude oil (in both higher oil prices and physical volume).
Real (Inflation-Adjusted) June 2015 Trade Deficit. Adjusted for seasonal factors, and net of oil-price swings and other inflation (2009 chain-weighted dollars, as used in GDP deflation), the June 2015 merchandise trade deficit (no services) widened to $59.339 billion, from a revised $57.589 billion in May 2015. The June 2015 real shortfall also deteriorated sharply versus a $49.756 billion deficit in June 2014.
The annualized quarterly real merchandise trade deficit stood at $554.8 billion for fourth-quarter 2013, $597.8 billion for first-quarter 2014, $613.4 billion for second-quarter 2014, $588.6 billion for third-quarter 2014, $605.5 billion for fourth-quarter 2014, and a revised $692.1 billion for first-quarter 2015. Widening quarter-to-quarter real trade deficits subtract growth from the quarterly real GDP estimates and vice versa.
With full second-quarter detail in place, the annualized quarterly real trade shortfall was $695.7 billion, a minimal widening versus first-quarter 2015. Consistent with that would be a small subtraction to second-quarter 2015 GDP growth, not the headline 0.13% contribution to the aggregate annualized real second-quarter GDP growth rate of 2.32% as headlined on July 30th.
Construction Spending—June 2015—Headline Gain of 0.1% Was in the Context of Volatile, Upside Revisions. The monthly construction-spending data usually are volatile and heavily revised, and such was the case, again, in June 2015, with May activity being revised higher by 2.7%. In that context, the headline 0.1% increase in June spending came in below consensus expectations [a 0.6% gain expected per Bloomberg]. With the headline detail in place, a jump of 1.6% in June public-construction spending more than offset a drop of 0.5% (-0.5%) in the private-construction spending sector.
The headline reporting here, however, is in current dollars, in nominal terms, before inflation adjustment. Net of inflation, real headline construction spending was unchanged for the month, with headline PPI construction inflation up by an offsetting 0.1% in the month. Even so, the patterns of real growth in construction spending still are running ahead of measures such as housing starts and production employment. That suggests that the government estimates of construction inflation are too low, as confirmed otherwise in private surveys and as discussed in the PPI Final Demand Construction Index section.
Reflecting all revisions and full quarterly reporting, second-quarter 2015 real construction spending (deflated by PPI construction inflation) showed an annualized 25.7% gain, versus a downwardly revised 4.1% gain in first-quarter 2015.
The four graphs following in these Opening Comments show both nominal and real construction activity for the aggregate series, as well as private residential- and nonresidential-construction and public construction spending. Seen after adjustment for inflation, the aggregate series had remained in low-level stagnation into first-quarter 2015. It spiked in recent months, but slowed in the most recent reporting, with the real series in June 2015 still holding at 29.1% (-29.1%) below its pre-recession peak of March 2006. The general pattern of real activity remains one of low-level, albeit up-trending stagnation for both aggregate and private-nonresidential spending.
PPI Final Demand Construction Index (FDCI). ShadowStats uses the Final Demand Construction Index (FDCI) component of the Producer Price Index (PPI) for deflating the current aggregate activity in the construction-spending series. The subsidiary private- and public-construction PPI series are used in deflating the subsidiary series.
The previously-used New Construction Index (NCI) was so far shy of reflecting construction costs as to be virtually useless. Although closely designed to match this construction-spending series, the FDCI and subsidiary numbers have two problems. First, the historical data only go back to November 2009. Second, they still understate actual construction inflation.
Private surveys tend to show higher construction-related inflation than is reported by the government. For example, year-to-year inflation reflected in the privately-published Building Cost Index [Dodge Data and Analytics (McGraw Hill) Engineering News-Record] is running about one-third above the headline pace of annual inflation in the PPI’s Final Demand Construction Index.
There is no perfect, publicly-available inflation measure for deflating construction. For the historical series in the accompanying graphs, the numbers are deflated by the NCI through November 2009, and by the FDCI and subsidiaries thereafter.
For June 2015, the seasonally-adjusted FDCI month-to-month inflation was a positive 0.09%, for the third consecutive month. In terms of year-to-year inflation, the June 2015 FDCI held at 1.81%, the same as in May 2015 and up from 1.72% in April 2015. Where the subsidiary series tend to track the aggregate inflation detail over time, June 2015 headline publicly-funded construction inflation gained 0.18% for the month, 1.81% year-to-year, with privately-funded construction inflation up by 0.09% for the month, up by 1.72% year-to-year.
Headline Reporting for June 2015. The headline, total value of construction put in place in the United States for June 2015 was $1,064.6 billion, on a seasonally-adjusted—but not-inflation-adjusted—annual-rate basis. That estimate was up month-to-month by a statistically-insignificant 0.1%, versus an upwardly revised $1,063.5 billion in May 2015. May spending was up by a revised 1.8% from an upwardly revised $1,044.6 billion in April, and April spending rose by a revised 3.8% versus an unrevised $1,006.4 billion level spending in March.
Adjusted for FDCI inflation, aggregate real spending in June 2015 was unchanged at 0.0%, following a revised May 2015 gain of 1.7%.
On a year-to-year or annual-growth basis, June 2015 nominal construction spending rose by a statistically-significant 12.0%, versus a revised annual gain of 11.1% in May 2015. Net of construction costs indicated by the FDCI, year-to-year change in spending was at 10.0% in June 2015, versus a revised 9.1% in May 2015.
The statistically-insignificant, headline monthly increase of 0.1% in nominal June 2015 aggregate construction spending, versus the 1.8% gain in May 2015 spending, included a monthly increase of 1.6% in June public spending, versus a 2.1% gain in May spending. Private spending declined by 0.5% (-0.5%) in June, versus a 1.7% increase in May. Within total private construction spending, the residential sector rose by 0.4% in June, versus a 0.9% gain in May, while the nonresidential sector fell by 1.3% (-1.3%) in June, versus a 2.5% gain in May. The graphs that follow here and in the Reporting Detail section show the latest extended detail.


[The Reporting Detail section includes further coverage of the
June trade deficit and construction spending.]
__________
HYPERINFLATION WATCH
HYPERINFLATION OUTLOOK SUMMARY
Broad Outlook Generally Is Unchanged: Economy Remains in Downturn; Dollar Faces Massive Decline with Ongoing Implications for Hyperinflation. The update to the Hyperinflation Outlook is planned for Friday’s (June 7th) Commentary No. 741. Although not fundamentally altered from its most-recent incarnation found in Commentary No. 735, the pending version will be updated to incorporate details on the economy, global systemic instabilities and the gold circumstance discussed in various recent missives, including Commentary No. 737, Commentary No. 738 and Commentary No. 739.
The U.S. economy remains in ongoing downturn, while the U.S. dollar still faces a massive decline, with implications for a meaningful upturn in inflation evolving into a great hyperinflationary crisis. Signs of systemic instability continue to mount.
Beyond the last summary version available at Commentary No. 735, the supporting documents for the general outlook remain No. 692 Special Commentary: 2015 - A World Out of Balance of February 2, 2015, which updated the Hyperinflation 2014 reports and the broad economic outlook. Previously, the long-standing hyperinflation and economic outlooks were updated with the publication of 2014 Hyperinflation Report—The End Game Begins – First Installment Revised, on April 2, 2014, and publication of 2014 Hyperinflation Report—Great Economic Tumble – Second Installment, on April 8, 2014. The outlooks also are updated regularly in the weekly Commentaries. The two 2014 Hyperinflation Report installments, however, remain the primary background material for the hyperinflation and economic analyses and forecasts. One other reference should be considered here, in terms of underlying economic reality, and that is the Public Commentary on Inflation Measurement.
__________
REPORTING DETAIL
U.S. TRADE BALANCE (June 2015)
June Trade Deficit Widened by Somewhat More Than Indicated in the "Advance" Reporting. The full detail of the June 2015 trade deficit reporting did not support the headline narrowing of the net-export-account deficit, as indicated in the "advance" estimate of second-quarter 2015 GDP (see Commentary No. 739). Instead, the underlying June trade detail indicated a net deterioration—a small widening—in the real quarterly deficit, with a suggestion of some minor downside revision for the August 27th second-estimate of second-quarter GDP.
In a related area, the headline widening in the June 2015 merchandise trade deficit was more than had been suggested by the July 30th "advance" estimate of the June deficit. The early-headline availability of the monthly deficit detail still appears to be of limited value, as discussed in Commentary No. 739. The "final" estimate of the June census-basis goods deficit was $62.639 billion, versus the "advance" estimate of $62.256 billion, but that was a net monthly deficit deterioration of $3.051 billion instead of the $1.132 billion deterioration suggested in the "advance" reporting, due to a narrowing of the headline May deficit, also in revision.
Nominal (Not-Adjusted-for-Inflation) June 2015 Trade Deficit. The BEA and the Census Bureau reported this morning, August 5th, that the nominal, seasonally-adjusted monthly trade deficit in goods and services for June 2015, on a balance-of-payments basis, widened by $2.899 billion to $43.839 billion, versus a revised $40.940 (previously $41.871) billion in May 2015. The June 2015 nominal deficit also widened versus a $42.371 billion trade shortfall in June 2014.
In terms of month-to-month trade patterns, that headline $2.899 billion widening in the June deficit reflected a decline of $0.136 (-$0.136) billion in monthly exports, combined with a $2.762 billion increase in monthly imports [difference is in rounding]. The surge in imports reflected a $1.3 billion jump in pharmaceutical preparations and an increase of $0.9 billion in crude oil (in both higher oil prices and physical volume).
Energy-Related Petroleum Products. For June 2015, the not-seasonally-adjusted average price of imported oil moved higher to $53.76 per barrel, versus $50.76 per barrel in May 2015, but down from $96.41 per barrel in June 2014. Also not-seasonally-adjusted, physical oil-import volume in June 2015 averaged 7.446 million barrels per day, up from 6.512 million in May 2015 and up from 7.131 million in June 2014.
Ongoing Cautions on Data Quality. Potentially heavy distortions in headline data continue from seasonal adjustments. Similar issues affect other economic releases, such as retail sales and payrolls, where the headline number reflects month-to-month change. Discussed frequently (see 2014 Hyperinflation Report—Great Economic Tumble – Second Installment for example), the extraordinary length and depth of the current business downturn have disrupted regular seasonality patterns. Accordingly, the markets should not rely too heavily on the accuracy of the monthly headline data.
Real (Inflation-Adjusted) June 2015 Trade Deficit. Adjusted for seasonal factors, and net of oil-price swings and other inflation (2009 chain-weighted dollars, as used in GDP deflation), the June 2015 merchandise trade deficit (no services) widened to $59.339 billion, from a revised $57.589 (previously $58.369) billion in May 2015. The June 2015 shortfall widened sharply versus a $49.756 billion real deficit in June 2014.
As currently reported, the annualized quarterly real merchandise trade deficit stood at $554.8 billion for fourth-quarter 2013, $597.8 billion for first-quarter 2014, $613.4 billion for second-quarter 2014, $588.6 billion for third-quarter 2014, $605.5 billion for fourth-quarter 2014, and $692.1 [previously $691.2] billion for first-quarter 2015. Widening quarter-to-quarter real trade deficits subtract growth from the quarterly real GDP estimates and vice versa.
With full second-quarter detail in place, the annualized quarterly real trade shortfall in second-quarter 2015 was $695.7 billion, a minimal widening versus first-quarter 2015. Consistent with that would be a small subtraction to second-quarter 2015 GDP growth, not the headline 0.13% contribution to the aggregate annualized real second-quarter GDP growth rate of 2.32%.
CONSTRUCTION SPENDING (June 2015)
June Construction Spending Gain of 0.1% Was in the Context of Volatile, Upside Revisions. The monthly construction-spending data usually are volatile and heavily revised, and such was the case in June 2015, with the level of May activity revised higher by 2.7%. In that context, the headline 0.1% increase in June spending came in below consensus expectations [0.6% gain expected per Bloomberg]. With the headline detail in place, a jump of 1.6% in June public construction spending more than offset a drop of 0.5% (-0.5%) in private construction spending.
The headline reporting here, however, is in current dollars, in nominal terms, before inflation adjustment. Net of inflation, real headline construction spending was unchanged for the month, with headline PPI construction inflation up by 0.1% in the month. Even so, the patterns of real growth still are running ahead of measures such as housing starts and production employment. That suggests that the government estimates of construction inflation are too low, as confirmed by private surveys and discussed in the PPI Final Demand Construction Index section.
Reflecting all revisions and full quarterly reporting, second-quarter 2015 real construction spending (deflated by PPI construction inflation) showed an annualized 25.7% gain [previously on track for a 13.8% gain based just on initial April and May reporting], versus a revised 4.1% [previously 4.3%] gain in first-quarter 2015.
Graphs of both nominal and real construction activity are shown in Opening Comments section, for the aggregate series as well as private residential- and nonresidential-construction and public construction spending. Seen after adjustment for inflation, the aggregate series had remained in low-level stagnation into first-quarter 2015. It spiked in recent months, but slowed in the most recent reporting, with the real series in June 2015 still holding at 29.1% (-29.1%) below its pre-recession peak of March 2006. The general pattern of real activity remains one of low-level, albeit up-trending stagnation.
The second graph following shows the real detail, with the nominal detail shown in the first graph.


PPI Final Demand Construction Index (FDCI). ShadowStats uses the Final Demand Construction Index (FDCI) component of the Producer Price Index (PPI) for deflating the current aggregate activity in the construction-spending series. The subsidiary private- and public-construction PPI series are used in deflating the subsidiary series graphed in the Opening Comments.
The previously-used New Construction Index (NCI) was so far shy of reflecting construction costs as to be virtually useless. Although closely designed to match this construction-spending series, the FDCI and subsidiary numbers have two problems. First, the historical data only go back to November 2009. Second, they still understate actual construction inflation.
Private surveys tend to show higher construction-related inflation than is reported by the government. For example, year-to-year inflation reflected in the privately-published Building Cost Index [Dodge Data and Analytics (McGraw Hill) Engineering News-Record] is running about one-third above the headline pace of annual inflation in the PPI’s Final Demand Construction Index.
There is no perfect, publicly-available inflation measure for deflating construction. For the historical series in the accompanying graphs, the numbers are deflated by the NCI through November 2009, and by the FDCI and subsidiaries thereafter.
For June 2015, the seasonally-adjusted FDCI month-to-month inflation was a positive 0.09%, for the third consecutive month. In terms of year-to-year inflation, the June 2015 FDCI held at 1.81%, the same as in May 2015, up from 1.72% in April 2015, and versus 2.00% in March 2015 and a revised 2.10% [previously 2.00%] in February 2015. Where the subsidiary series tend to track the aggregate inflation detail over time, June 2015 headline publicly-funded construction inflation gained 0.18% for the month, 1.81% year-to-year, with privately-funded construction inflation up by 0.09% for the month, up by 1.72% year-to-year.
Headline Reporting for June 2015. The Census Bureau reported August 3rd that the headline, total value of construction put in place in the United States for June 2015 was $1,064.6 billion, on a seasonally-adjusted—but not-inflation-adjusted—annual-rate basis. That estimate was up month-to-month by a statistically-insignificant 0.1% +/- 1.8% (all confidence intervals are at the 95% level), versus a revised $1,063.5 [previously $1,035.8] billion in May 2015. In turn May spending was up by a revised 1.8% [previously up by 0.8%] from a revised $1,044.6 [previously $1,027.0] billion in April. April spending rose by a revised 3.8% [previously up by 2.1%] versus an unrevised $1,006.4 billion level of annualized spending in March.
Adjusted for FDCI inflation, aggregate real spending in June 2015 was unchanged at 0.0%, following a revised May 2015 gain of 1.7%.
On a year-to-year or annual-growth basis, June 2015 nominal construction spending rose by a statistically-significant 12.0% +/- 2.5%, versus a revised annual gain of 11.1% [previously up by 8.2%] in May 2015.
Net of construction costs indicated by the FDCI, year-to-year change in spending was at 10.0% in June 2015, versus a revised 9.1% in May 2015.
The statistically-insignificant, headline monthly increase of 0.1% in nominal June 2015 aggregate construction spending, versus the 1.8% gain in May 2015 spending, included a monthly increase of 1.6% in June public spending, versus a 2.1% gain in May spending. Private spending declined by 0.5% (-0.5%) in June, versus a 1.7% increase in May. Within total private construction spending, the residential sector rose by 0.4% in June, versus a 0.9% gain in May, while the nonresidential sector fell by 1.3% (-1.3%) in June, versus a 2.5% gain in May. The graphs that follow show the latest extended detail.
Construction and Related Graphs. The earlier two graphs reflected total construction spending through June 2015, both in the headline nominal dollar terms, and in real terms, after inflation adjustment. The inflation-adjusted graph is on an index basis, with January 2000 = 100.0. Adjusted for the PPI’s NCI measure through October 2009 and the PPI’s Final Demand Construction Index thereafter, real aggregate construction spending showed the economy slowing in 2006, plunging into 2011, then turning minimally higher in an environment of low-level stagnation, trending lower from late-2013 into mid-2014 and in a low-level uptrend into 2015, with a recent spike.
Despite the recent uptrend, the pattern of inflation-adjusted activity here—net of government inflation estimates—does not confirm the economic recovery indicated by the headline GDP series (see Commentary No. 739 and No. 692 Special Commentary: 2015 - A World Out of Balance). To the contrary, the latest construction reporting, both before (nominal) and, more prominently, after (real) inflation adjustment, shows a pattern of low-level, variable stagnation, where activity never recovered pre-recession highs.
The following graph shows June 2015 construction employment, as detailed in the Commentary No 732. In theory, payroll levels should move more closely with the inflation-adjusted aggregate series, where the nominal series reflects the impact of costs and pricing, as well as a measure of the level of physical activity. The construction employment graph and detail will be updated for July payroll reporting in the next Commentary No. 741 on Friday, August 7th.


The graph preceding shows total nominal construction spending, broken out by the contributions from total-public (blue), private-nonresidential (yellow) and private-residential spending (red).
The next two graphs cover private residential construction along with housing starts (combined single- and multiple-unit starts) for June 2015 (see Commentary No. 736). Keep in mind that the construction spending series is in nominal (not-adjusted-for-inflation) dollars, while housing starts reflect unit volume, which should tend to be more parallel with the real (inflation-adjusted) series shown in the Opening Comments section.


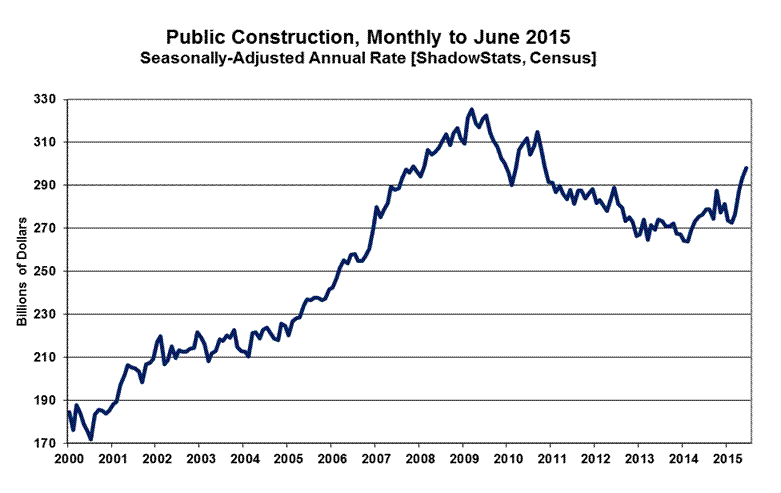
The final set of two graphs (following) shows the patterns of the monthly level of activity in private nonresidential-construction spending and in public-construction spending. The spending in private-nonresidential construction remains off its historic peak, but it recently has been moving sharply higher. Public construction spending, which is 98% nonresidential, had continued in a broad downtrend, with intermittent bouts of fluttering stagnation and then some growth in the last several months.

__________
WEEK AHEAD
Economic Reporting Should Trend Much Weaker than Expected; Inflation Will Rise Anew, Along with Higher Oil Prices. In a fluctuating trend to the downside, amidst mixed reporting in headline data, market expectations for business activity nonetheless tend to respond to the latest economic hype in the popular media. The general effect holds the market outlook at overly-optimistic levels, with current expectations still exceeding any potential, underlying economic reality.
Headline reporting of the regular monthly economic numbers increasingly should turn lower in the weeks and months ahead, along with significant downside revisions to second-quarter 2015 GDP and downside or otherwise much weaker than expected reporting for at least the next several quarters of GDP into 2016.
CPI-U consumer inflation—driven lower earlier this year by collapsing prices for gasoline and other oil-price related commodities—likely has seen its near-term, year-to-year low, having turned positive in June 2015, for the first time in six months. Early July indicators still are signaling higher inflation in the next monthly reporting. Separately, year-to-year CPI inflation for the balance of the year increasingly will be going against weak or negative year-ago numbers.
Upside inflation pressures should continue to build, as oil prices begin to rebound, once again, a process that should accelerate rapidly with the eventual sharp downturn in the exchange-rate value of the U.S. dollar. These areas, the general economic outlook and longer range reporting trends are reviewed broadly in No. 692 Special Commentary: 2015 - A World Out of Balance and will be updated soon in the Hyperinflation Watch section.
A Note on Reporting-Quality Issues and Systemic-Reporting Biases. Significant reporting-quality problems remain with most major economic series. Beyond the pre-announced gimmicked changes to reporting methodologies of the last several decades, which have tended to understate actual inflation and to overstate actual economic activity, ongoing headline reporting issues are tied largely to systemic distortions of monthly seasonal adjustments. Data instabilities—induced partially by the still-evolving economic turmoil of the last eight-to-ten years—have been without precedent in the post-World War II era of modern-economic reporting. The severity and ongoing nature of the downturn provide particularly unstable headline economic results, when concurrent seasonal adjustments are used (as with retail sales, durable goods orders, employment and unemployment data, discussed and explored in the labor-numbers related Commentary No. 695).
Combined with recent allegations of Census Bureau falsification of data in its monthly Current Population Survey (the source for the Bureau of Labor Statistics’ Household Survey), these issues have thrown into question the statistical-significance of the headline month-to-month reporting for many popular economic series (see Commentary No. 669).
PENDING RELEASE:
UPDATED (Consensus Outlook): Employment and Unemployment (July 2015). The Bureau of Labor Statistics (BLS) will publish its July 2015 labor data, on Friday, August 7th. Both employment and unemployment numbers remain due for heavily-negative, headline surprises, given the still ongoing, weak general tone of recent reporting of most other, regular economic series.
Established monthly distortions to payroll employment (excessive upside biases, and publishing irregularities with the concurrent-seasonal-factor process) continue, however, as do the regular monthly distortions to headline unemployment (definitional issues with "discouraged workers," and publishing irregularities with the concurrent-seasonal-factor process).
Expectations are for a slower pace of payroll growth in July 2015, up by 215,000 [MarketWatch] and by 212,000 [Bloomberg], versus the initial headline reported gain of 223,000 jobs in June. Those numbers were before this morning’s (August 5th) weaker-than-expected ADP reading on July growth in private-sector payrolls. July’s headline U.3 unemployment rate is expected to hold at 5.3%, versus the 5.3% reported in June.
As with the narrowing of the headline unemployment rate in recent months and years, any further narrowing of the July U.3 unemployment rate likely would encompass more employed being redefined off the unemployment rolls and out of the headline labor force, rather than gaining new employment.
Underlying economic fundamentals continue to suggest deterioration in the broader unemployment rates such as U.6 and the ShadowStats Alternate Unemployment measure, as well as slowing or negative month-to-month growth in headline payrolls.
July Payroll-Gain Expectations Are Well Below Implied Monthly Trend. As published previously by ShadowStats-affiliate www.ExpliStats.com, in its analysis of the biases built into the BLS’s concurrent-seasonal-factor modeling of the June 2015 payroll-employment reporting, the built-in-bias trend for July 2015 is for a headline monthly employment gain of 243,000 (see Commentary No. 732). Where consensus forecasts usually settle-in near the trend level, consensus expectations are around 30,000 jobs below trend, at present.
To the extent that underlying fundamentals will continue to shine through all the regular monthly volatility and distortions, headline activity should continue to favor much weaker-than-expected payroll gains, and higher-than-expected unemployment rates.
__________