No. 744: July Housing Starts
COMMENTARY NUMBER 744
July Housing Starts
August 18, 2015
__________
Housing Starts Activity Still Is Down 47% (-47%) from Its Pre-Recession High
July Starts Continued in a Smoothed Pattern of Low-Level Stagnation,
Despite Ongoing Volatile Reporting and Upside Revisions
Difficult to Support an Annualized Quarterly Housing-Starts Surge of 94.8%
With an Annualized Quarterly Decline of 3.5% (-3.5%) in
Related Residential-Construction Employment
___________
PLEASE NOTE: The next regular Commentary, tomorrow, August 19th, will cover the July CPI and related Real Retail Sales and Earnings.
Best wishes to all — John Williams
OPENING COMMENTS AND EXECUTIVE SUMMARY
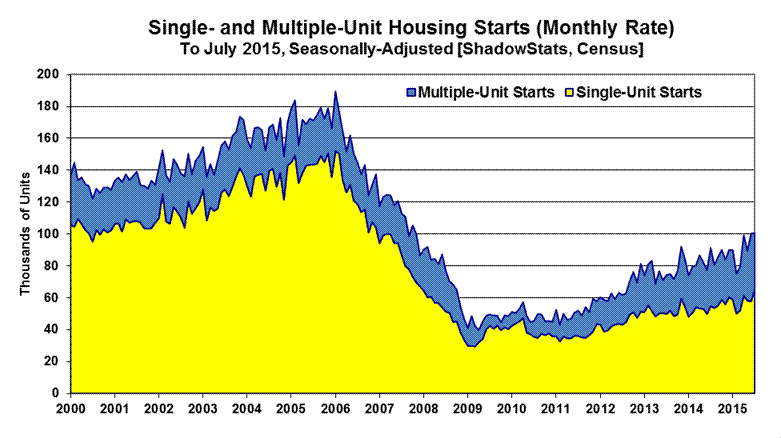
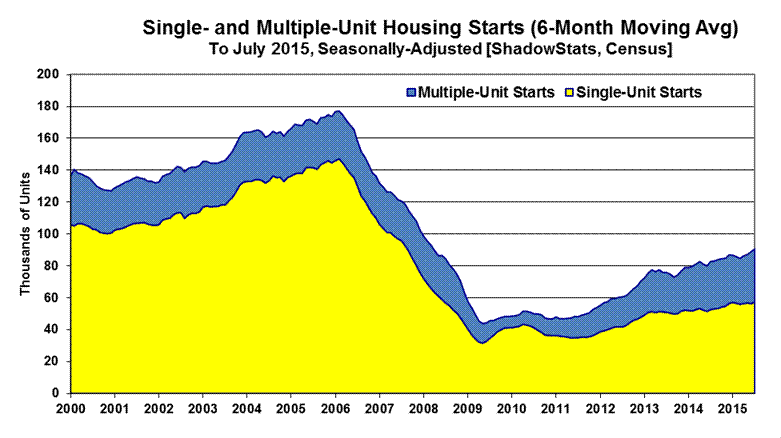
No Economic Recovery Here. At 47% below its pre-recession peak, housing-starts activity has not recovered from the economic collapse of 2006 into 2009. The series remains extremely volatile, unstable and subject to massive revisions. As a result, headline starts data rarely are significant, as was the case with today’s July 2015 headline reporting. Smoothed using a six-month moving average, the broad series and the dominant single-unit housing starts category remained stagnant at low levels of activity. Activity in multiple-unit housing starts, however, is at or above pre-recession levels, but such is overwhelmed and masked in the reporting of the aggregate numbers, by the single-unit housing starts activity.
Today’s Missive (August 18th). Today’s relatively brief Commentary covers the housing starts release. Tomorrow’s August 19th Commentary No. 745—covering the July 2015 CPI and related series—will review the broad economic outlook, with much of the monthly July reporting in hand. The balance of today’s Opening Comments addresses the headline detail on July Housing Starts.
Last week’s August 10th No. 742 Special Commentary: A World Increasingly Out of Balance, updated the general economic and inflation outlook. The Hyperinflation Watch and an updated Hyperinflation Outlook Summary will return shortly, excerpted from No. 742.
The Week Ahead section previews detail of the tomorrow’s July Consumer Price Index (CPI) release.
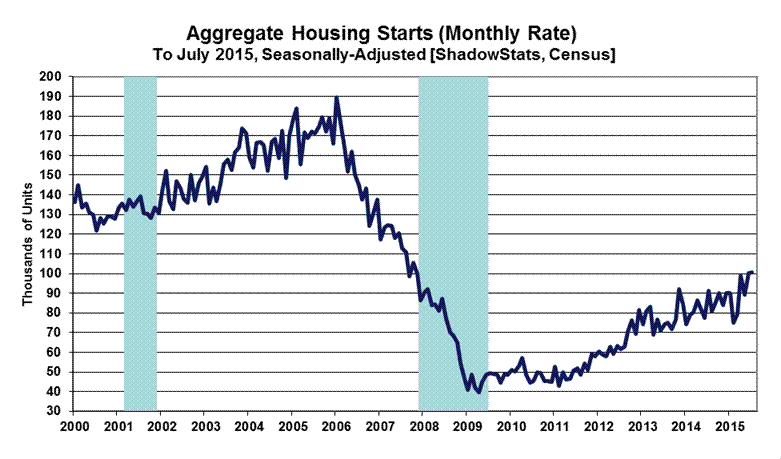
Housing Starts—July 2015—Broad Activity Remained in a Smoothed Pattern of Stagnation. The monthly detail of the aggregate housing-starts series continued to be of little meaning, other than as viewed in the context of a six-month moving average. The headline 0.2% gain in July 2015 housing starts was subdued by upside revisions to activity in prior months. Against the initial headline reporting of June 2015 activity, the July monthly gain would have been 2.7%. That minimally topped consensus expectations, which had been for a negligible headline gain of 0.5% versus June’s initial headline reporting [both MarketWatch and Bloomberg].
Nonetheless, with the current revisions and with the growth as spiked with revisions last month, the aggregate housing-starts count (these are actively-worked-on units) rose at a revised, annualized-quarterly pace of 94.8% (previously up by 87.4%) in second-quarter 2015. One difficulty with that number is that underlying growth in related construction employment does not support such activity. Second-quarter 2015 employment tied to new housing construction showed an annualized contraction of 3.51% (-3.51%), broken out as an annualized employment decline of 3.56% (-3.56%) for contractors on new single-family residences, and a drop of 2.97% (-2.97%) for contractors working on new multiple-family residences, all as reported by the Bureau of Labor Statistics (BLS). The BLS data are not yet available for these series in July. In the context of the cautions on limited meaning, the regular headline data and details follow.
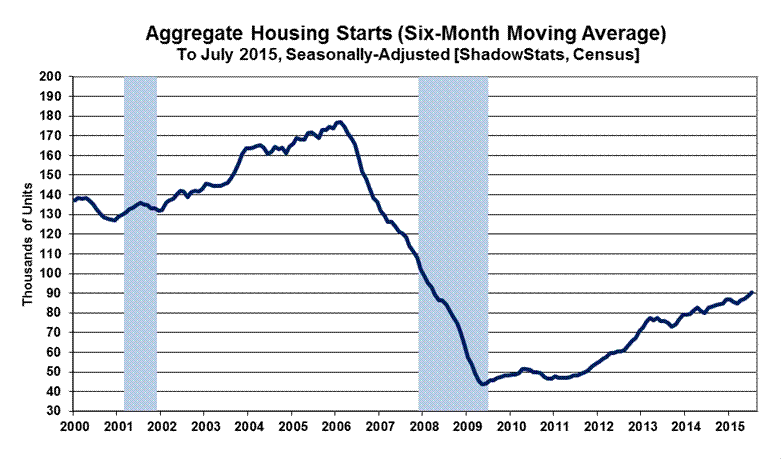
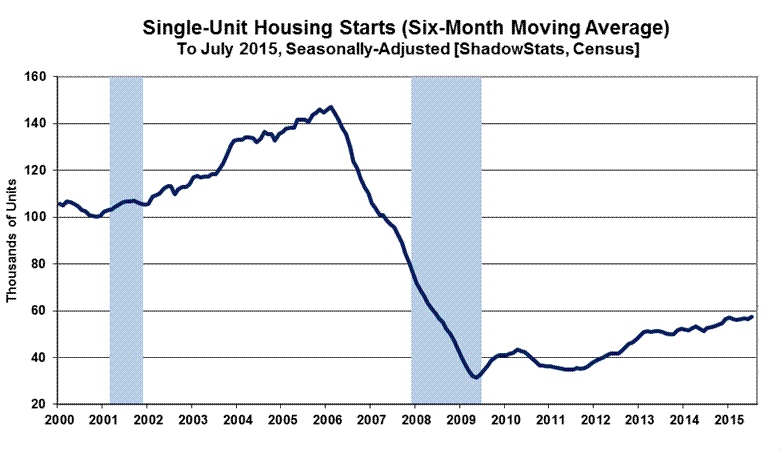
Smoothed Numbers. A general pattern of low-level stagnation continued in the broad series, as best viewed in terms of the longer-range historical graph of aggregate activity (Graph 10), at the end of the Reporting Detail section, and in the context of flat-trending activity, smoothed by six-month moving averages, as shown in following Graphs 2, 4 and 6.
Reflected in those smoothed graphs, the aggregate housing-starts series ticked minimally higher in July, reflecting an upside movement in both the smoothed single-unit and multiple-unit starts categories. Although there has been a minor upside trend in the broad stagnation of the aggregate series, total housing-starts activity has remained well below any recovery level.
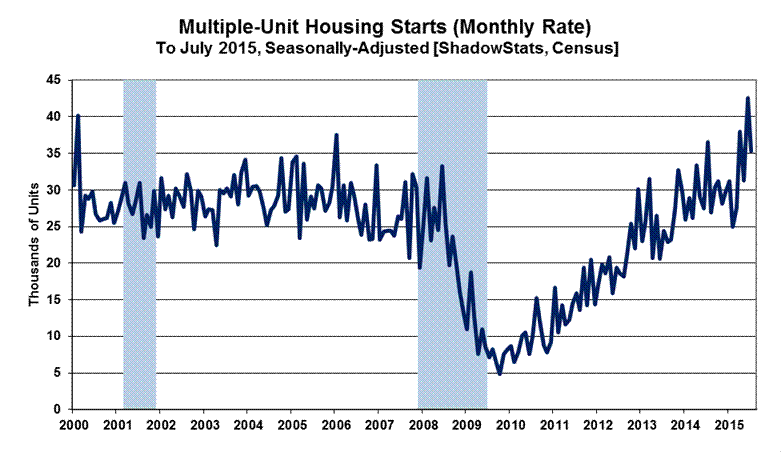
Over time, the bulk of the extreme, reporting instability and the minimal uptrend in the aggregate series has been due largely to particularly-volatile reporting in the multiple-unit, housing-starts category (apartments, etc.). Recent activity in multiple-unit starts actually has recovered to above pre-recession activity, again, in the context of extreme month-to-month volatility. Even so, the recent impact of that recovery largely has been lost in the detail of total housing starts.
Consumer Liquidity Problems Continues to Impair Housing Activity. On a per-structure basis, activity in housing starts is dominated by the single-unit housing starts category, which has remained broadly stagnant on a smoothed basis—at a low level of activity—since hitting bottom in early-2009. The private housing sector never recovered from the business collapse of 2006 into 2009 (see Graphs 5 and 6).
The primary, underlying difficulty for the housing market remains intense, structural-liquidity constraints on the consumer. That circumstance, during the last eight-plus years of economic collapse and stagnation, has continued to prevent a normal recovery in broad U.S. business activity, as discussed and updated in yesterday’s August 17th Commentary No. 743.
Without real (inflation-adjusted) growth in household income and without the ability or willingness to take on meaningful new debt, the consumer simply has not had the wherewithal to fuel sustainable economic growth. There remains no chance of a near-term, sustainable turnaround in the housing market, until there is a fundamental upturn in consumer and banking-liquidity conditions. That has not happened and still does not appear to be in the offing.
July 2015 Housing-Starts Headline Reporting. Headline July 2015 housing starts rose by a statistically-insignificant, seasonally-adjusted monthly gain of 0.2% (see Graphs 3 and 4). That followed an upwardly revised 12.3% gain in June, and a revised, narrowed decline of 9.9% (-9.9%) in May. Net of prior-period revisions, July 2015 housing starts rose by a still statistically-insignificant 2.7% for the month.
Year-to-year change in the seasonally-adjusted, aggregate July 2015 housing-starts measure was a statistically-insignificant gain of 10.1%, versus upwardly revised annual gains of 29.9% in June 2015 8.7% in May 2015.
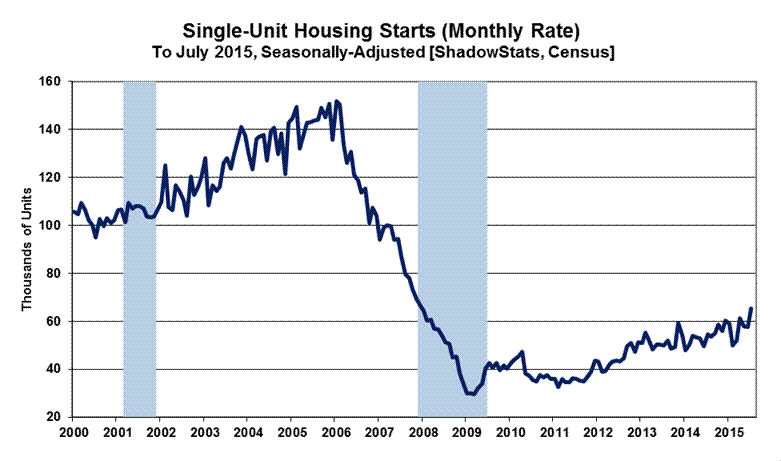
The headline July 2015 monthly gain of 0.2% for total housing starts reflected a monthly gain of 12.8% in the "one unit" category, and a decline of 17.1% (-17.1%) in the "five units or more" category. Only the headline gain in single-unit housing starts was statistically-significant.
By-Unit Category. Where the irregular housing starts series can show varying patterns, that partially is due to a reporting mix of residential construction products, with the largest physical-count category of one-unit structure housing starts—generally for individual consumption, resulting in new home sales—versus multi-unit structure starts that generally reflect the building of rental and apartment units.
Housing starts for single-unit structures in July 2015 rose month-to-month by a statistically-significant 12.8%, following revised, narrowed declines of 0.6% (-0.6%) in June and 5.2% (-5.2%) in May. Single-unit starts for June 2015 showed a statistically-significant year-to-year annual gain of 19.0%, versus upwardly revised gains of 16.1% in June 2015 and 9.4% in May 2015 (see Graphs 5 and 7).
Housing starts for apartment buildings (generally 5-units-or-more) in July 2015 fell month-to-month by a statistically-insignificant 17.1%, following an upwardly revised gain of 36.1% in June, and a downwardly revised contraction of 16.1% (-16.1%) in May. The statistically-insignificant year-to-year contraction of 2.1% (-2.1%) in July 2015, followed a revised annual gains of 62.2% in June 2015 and 8.6% in May 2015.
Graph 1: Single- and Multiple-Unit Housing Starts (Monthly Rate of Activity)
Graph 2: Single- and Multiple-Unit Housing Starts (Six-Month Moving Average, Monthly Rate of Activity)
Expanding the multi-unit housing starts category to include 2-to-4-units plus 5-units-or-more usually reflects the bulk of rental- and apartment-unit activity. The Census Bureau does not publish estimates of the 2-to-4-units category, due to statistical significance problems (a general issue for the aggregate series). Nonetheless, the total multi-unit category can be calculated by subtracting the single-unit category from the total category (see Graphs 1, 2, 7 and 8).
Accordingly, the statistically-insignificant July 2015 monthly gain of 0.2% in aggregate housing starts was composed of a statistically-significant increase of 12.8% in one-unit structures, combined with a statistically-insignificant monthly decline of 17.0% (-17.0%) in the multiple-unit structures category (2-units-or-more, including the 5-units-or-more category).
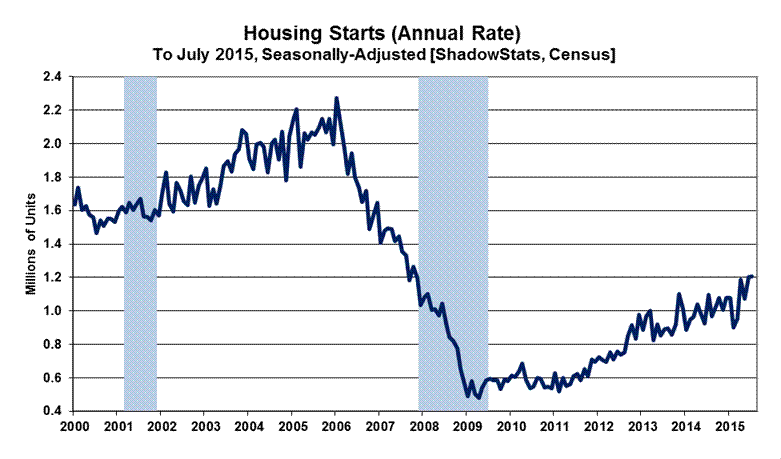
Housing Starts Graphs. Headline reporting of housing starts activity is expressed by the Census Bureau as an annualized monthly pace of starts, which was 1,206,000 in July 2015, versus a revised 1,204,000 (previously 1,174,000) in June 2015. The scaling detail in the aggregate graphs at the end of the Reporting Detail section reflects those annualized numbers.
Nonetheless, given the nonsensical monthly volatility in reporting and the exaggerated effect of annualizing the monthly numbers in this unstable series, the magnitude of monthly activity and the changes in same, more realistically are reflected at the non-annualized monthly rate. Consider that the revised headline 236,000 (previously 211,000, initially 191,000) month-to-month gain in the annualized April 2015 housing starts was larger than any actual total (non-annualized) level of monthly starts ever, for single month. That is since related starts detail was first published after World War II.
Accordingly, the monthly rate of 100,500 units in July 2015, instead of the annualized 1,206,000-headline number, is used in the scaling of the series of graphs shown in these Opening Comments. With the use of either scale of units, though, appearances of the graphs and the relative monthly, quarterly and annual percentage changes are otherwise identical.
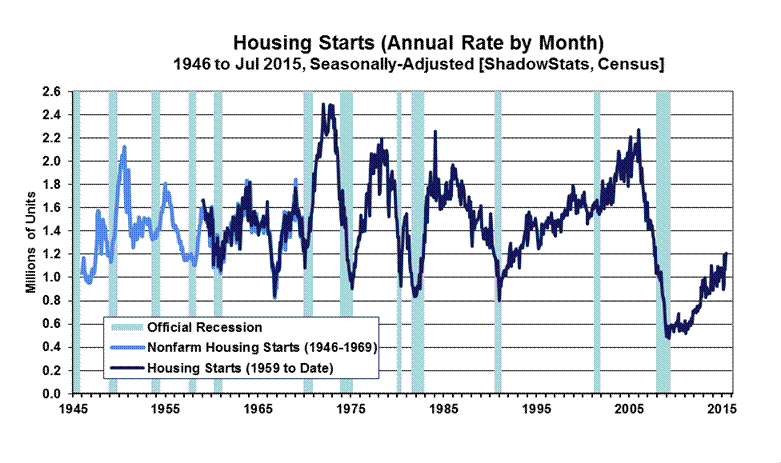
The record monthly low level of activity seen for the present aggregate series was in April 2009, where the annualized monthly pace of sales then was down 79% (-79%) from the January 2006 pre-recession peak. Against the downside-spiked low in April 2009, the July 2015 headline number was up by 152%, but it still was down by 47% (-47%) from the January 2006 pre-recession high. Shown in the historical perspective of the post-World War II era, current aggregate- and single-starts activity is trending stagnant at low levels that otherwise have been at the historical troughs of recession activity of the last 70 years, as seen in Graph 10 at the end of the Reporting Detail section.
Graph 3: Aggregate Housing Starts (Monthly Rate of Activity)
Graph 4: Aggregate Housing Starts (Six-Month Moving Average, Monthly Rate of Activity)
Graph 5: Single-Unit Housing Starts (Monthly Rate of Activity)
Graph 6: Single-Unit Housing Starts (Six-Month Moving Average, Monthly Rate of Activity)
Graph 7: Multiple-Unit Housing Starts (Monthly Rate of Activity)
Graph 8: Multiple-Unit Housing Starts (Six-Month Moving Average, Monthly Rate of Activity)

[The Reporting Detail section includes some expanded detail of the July 2015
Residential Investment – Housing Starts numbers.]
__________
REPORTING DETAIL
RESIDENTIAL CONSTRUCTION—HOUSING STARTS (July 2015)
Broad Activity Remained in a Smoothed Pattern of Stagnation. The monthly detail of the aggregate housing-starts series continues to be of little meaning, other than as viewed in the context of a six-month moving average. The headline 0.2% gain in July 2015 housing starts was subdued by upside revisions to prior months. The monthly gain was 2.7% versus the initial reporting of June 2015 activity. Consensus expectations had been for a negligible headline gain of 0.5% from June’s initial headline reporting [both MarketWatch and Bloomberg].
Nonetheless, with the current revisions and with the growth as spiked with revisions last month, the aggregate housing-starts count (these are actively-worked-on units) rose at a revised, annualized-quarterly pace of 94.8% (previously up by 87.4%) in second-quarter 2015. One difficulty with that number is that underlying growth in related construction employment does not support that activity. Second-quarter 2015 employment tied to new housing construction showed an annualized contraction of 3.51% (-3.51%), broken out as an annualized employment decline of 3.56% (-3.56%) for contractors on new single-family residences, and a drop of 2.97% (-2.97%) for contractors working on new multiple-family residences, all as reported by the Bureau of Labor Statistics (BLS). The BLS data in these series are not yet available for July. In the context of the cautions on limited-meaning, the regular headline data and details follow.
Smoothed Numbers. A general pattern of low-level stagnation continued in the broad series, as best viewed in terms of the longer-range historical graph of aggregate activity (Graph 10), at the end of this section, and in the context of flat- trending activity, smoothed by six-month moving averages, as shown in Graphs 2, 4 and 6 in the Opening Comments section.
Reflected in those smoothed graphs, the aggregate housing-starts series ticked minimally higher in July, reflecting an upside movement in both the smoothed single-unit and multiple-unit starts categories. Although there has been a minor upside trend in the broad stagnation of the aggregate series, total housing-starts activity has remained well below any recovery level.
Over time, the bulk of the extreme, reporting instability and the minimal uptrend in the aggregate series has been due largely to particularly-volatile reporting in the multiple-unit, housing-starts category (apartments, etc.). Recent activity in multiple-unit starts actually has recovered to above pre-recession activity, again, in the context of extreme month-to-month volatility. Even so, the recent impact of that recovery largely has been lost in the detail of total housing starts.
Consumer Liquidity Problems Continues to Impair Housing Activity. On a per-structure basis, activity in housing starts is dominated by the single-unit housing starts category, which has remained broadly stagnant on a smoothed basis—at a low level of activity—since hitting bottom in early-2009. The private housing sector never recovered from the business collapse of 2006 into 2009.
The primary, underlying difficulty for the housing market remains intense, structural-liquidity constraints on the consumer. That circumstance, during the last eight-plus years of economic collapse and stagnation, has continued to prevent a normal recovery in broad U.S. business activity, as discussed and updated in yesterday’s August 17th Commentary No. 743.
Without real (inflation-adjusted) growth in household income and without the ability or willingness to take on meaningful new debt, the consumer simply has not had the wherewithal to fuel sustainable economic growth. There remains no chance of a near-term, sustainable turnaround in the housing market, until there is a fundamental upturn in consumer and banking-liquidity conditions. That has not happened and still does not appear to be in the offing.
July 2015 Housing-Starts Headline Reporting. The Census Bureau reported this morning, August 18th, a statistically-insignificant, seasonally-adjusted headline monthly gain of 0.2% +/- 17.8% (all confidence intervals are expressed at the 95% level) in July 2015 housing starts (see Graphs 3 and 4). That followed a revised 12.3% [previously 9.8%] gain in June, versus a revised decline in May of 9.9% (-9.9%) [previously down by 10.2% (-10.2%), initially down by 11.1% (-11.1%)]. Net of prior-period revisions, July 2015 housing starts rose by a still statistically-insignificant 2.7% for the month, instead of the headline 0.2% gain.
Year-to-year change in the seasonally-adjusted, aggregate July 2015 housing-starts measure was a statistically-insignificant gain of 10.1% +/- 12.6%, versus a revised annual gain of 29.9% [previously up by 26.6%] in June 2015, and a revised annual gain of 8.7% [previously up by 8.4%, initially up by 5.1%] in May 2015.
The headline July 2015 monthly gain of 0.2% for total housing starts reflected a headline monthly gain of 12.8% in the "one unit" category, and a decline of 17.1% (-17.1%) in the "five units or more" category. Only the headline gain in single-unit housing starts was statistically-significant.
By-Unit Category (See Graphs in the Opening Comments). Where the irregular housing starts series can show varying patterns, that partially is due to a reporting mix of residential construction products, with the largest physical-count category of one-unit structure housing starts—generally for individual consumption, resulting in new home sales—versus multi-unit structure starts that generally reflect the building of rental and apartment units.
Housing starts for single-unit structures in July 2015 rose month-to-month by a statistically-significant 12.8% +/- 11.5%, following a revised decline of 0.6% (-0.6%) [previously down by 0.9% (-0.9%)] in June, and a revised decline in May of 5.2% (-5.2%) [previously down by 6.0% (-6.0%), initially down by 5.4% (-5.4%)]. Single-unit starts for June 2015 showed a statistically-significant year-to-year annual gain of 19.0% +/- 12.3%, versus a revised gain of 16.1% [previously up by 14.7%] in June 2015, and a revised annual gain of 9.4% [previously up by 8.5%, initially up by 6.8%] in May 2015 (see Graphs 5 and 7).
Housing starts for apartment buildings (generally 5-units-or-more) in July 2015 fell month-to-month by a statistically-insignificant 17.1% +/- 41.6%, following a revised gain of 36.1% [previously up by 28.6%] in June, and a revised decline of 16.1% (-16.1%) [previously down by 15.1% (-15.1%), initially down by 18.5% (-18.5%)] in May. The July 2015 year-to-year contraction of 2.1% (-2.1%) +/- 32.2%, which was statistically insignificant, followed a revised annual gain of 62.2% [previously up by 55.0%] in June 2015, and a revised annual gain of 8.6% [previously up by 9.8%, initially up by 2.6%] in May 2015.
Expanding the multi-unit housing starts category to include 2-to-4-units plus 5-units-or-more usually reflects the bulk of rental- and apartment-unit activity. The Census Bureau does not publish estimates of the 2-to-4-units category, due to statistical significance problems (a general issue for the aggregate series). Nonetheless, the total multi-unit category can be calculated by subtracting the single-unit category from the total category (see Graphs 1, 2, 7 and 8).
Accordingly, the statistically-insignificant July 2015 monthly gain of 0.2% in aggregate housing starts was composed of a statistically-significant increase of 12.8% in one-unit structures, combined with a statistically-insignificant monthly decline of 17.0% (-17.0%) in the multiple-unit structures category (2-units-or-more, including the 5-units-or-more category). Again, these series are graphed in the Opening Comments section.
Housing Starts Graphs. Headline reporting of housing starts activity is expressed by the Census Bureau as an annualized monthly pace of starts, which was 1,206,000 in July 2015, versus a revised 1,204,000 (previously 1,174,000) in June 2015. The scaling detail of Graphs 9 and 10 of the aggregate housing starts graphs, at the end of this section, reflects those annualized numbers.
Nonetheless, given the nonsensical monthly volatility in reporting and the exaggerated effect of annualizing the monthly numbers in this unstable series, the magnitude of monthly activity and the changes in same, more realistically are reflected at the non-annualized monthly rate. Consider that the revised headline 236,000 (previously 211,000, initially 191,000) month-to-month gain in the annualized April 2015 housing starts was larger than any actual total (non-annualized) level of monthly starts ever, for single month. That is since related starts detail was first published after World War II.
Accordingly, the monthly rate of 100,500 units in July 2015, instead of the annualized 1,206,000-headline number, is used in the scaling of the series of graphs (Graphs 1 to 8) in the Opening Comments section. With the use of either scale of units, though, appearances of the graphs and the relative monthly, quarterly and annual percentage changes are otherwise identical.
The record monthly low level of activity seen for the present aggregate series was in April 2009, where the annualized monthly pace of sales then was down 79% (-79%) from the January 2006 pre-recession peak. Against the downside-spiked low in April 2009, the July 2015 headline number was up by 142%, but it still was down by 47% (-47%) from the January 2006 pre-recession high. Shown in the historical perspective of the post-World War II era, current aggregate- and single-starts activity is trending stagnant at low levels that otherwise have been at the historical troughs of recession activity of the last 70 years, as evident in Graph 10, the final graph of this section.
Graph 9: Housing Starts (Annualized Monthly Rate of Activity), 2000 to Date
Graph 10: Housing Starts (Annualized Monthly Rate of Activity), 1946 to Date
__________
WEEK AHEAD
Economic Reporting Should Trend Much Weaker than Expected; Inflation Will Rise Anew, Along with Higher Oil Prices. In a fluctuating trend to the downside, amidst mixed reporting in headline data, market expectations for business activity nonetheless tend to respond to the latest economic hype in the popular media. That general effect holds the market outlook at overly-optimistic levels, with current expectations still exceeding any potential, underlying economic reality, yet the trend does continue to soften.
Headline reporting of the regular monthly economic numbers increasingly should turn lower in the weeks and months ahead, along with significant downside revisions to second-quarter 2015 GDP and downside or otherwise much weaker-than-expected reporting for at least the next several quarters of GDP into 2016.
CPI-U consumer inflation—driven lower earlier this year by collapsing prices for gasoline and other oil-price related commodities—likely has seen its near-term, year-to-year low, having turned positive in June 2015, for the first time in six months. July indicators suggest still higher CPI inflation in the week ahead. Separately, year-to-year CPI inflation for the balance of the year increasingly will be going against weak or negative year-ago numbers.
Upside inflation pressures should continue to build, particularly as oil prices begin to rebound, once again, a process that should accelerate rapidly with the eventual sharp downturn in the exchange-rate value of the U.S. dollar. These areas, the general economic outlook and longer range reporting trends are reviewed broadly in No. 742 Special Commentary: A World Increasingly Out of Balance and No. 692 Special Commentary: 2015 - A World Out of Balance.
A Note on Reporting-Quality Issues and Systemic-Reporting Biases. Significant reporting-quality problems remain with most major economic series. Beyond the pre-announced gimmicked changes to reporting methodologies of the last several decades, which have tended to understate actual inflation and to overstate actual economic activity, ongoing headline reporting issues are tied largely to systemic distortions of monthly seasonal adjustments. Data instabilities—induced partially by the still-evolving economic turmoil of the last eight-to-ten years—have been without precedent in the post-World War II era of modern-economic reporting. The severity and ongoing nature of the downturn provide particularly unstable headline economic results, when concurrent seasonal adjustments are used (as with retail sales, durable goods orders, employment and unemployment data, discussed and explored in the labor-numbers related Commentary No. 695).
Combined with recent allegations of Census Bureau falsification of data in its monthly Current Population Survey (the source for the Bureau of Labor Statistics’ Household Survey), these issues have thrown into question the statistical-significance of the headline month-to-month reporting for many popular economic series (see Commentary No. 669).
PENDING RELEASES:
[Not Updated] Consumer Price Index—CPI (July 2015). The Bureau of Labor Statistics (BLS) plans the July 2015 CPI for release for tomorrow, Wednesday, August 19th. The headline CPI-U should be on the plus-side, month-to-month, for the fifth straight month, with headline annual inflation turning increasingly positive for the second month.
The average gasoline price moved lower in July 2015, by 0.17% (-0.17%) for the month on a not-seasonally-adjusted basis, per the Department of Energy (DOE). BLS seasonal adjustments to gasoline prices in July traditionally move sharply to the plus-side, however, pushing the headline, unadjusted gain in gasoline prices enough higher to contribute 0.36% to the headline CPI-U monthly inflation rate. With higher food and “core” (net of food and energy) inflation, a headline gain above 0.3% is likely. Yet, the consensus headline expectation is for a 0.2% headline gain, as published by both Bloomberg and MarketWatch.
Annual Inflation Rate. Year-to-year, CPI-U inflation would increase or decrease in the July 2015 reporting, dependent on the seasonally-adjusted monthly change, versus the adjusted, minimal headline 0.01% monthly inflation gain for July 2014. The adjusted change is used here, since that is how consensus expectations are expressed. To approximate the annual unadjusted inflation rate for July 2015, the difference in July’s headline monthly change (or forecast of same), versus the year-ago monthly change, should be added to or subtracted directly from the June 2015 positive annual inflation rate of 0.12%. A headline month gain of 0.3% in the CPI-U, for example would take the annual inflation rate to roughly 0.4%.
__________