No. 788: January New Orders for Durable Goods, New- and Existing-Home Sales
COMMENTARY NUMBER 788
January New Orders for Durable Goods, New- and Existing-Home Sales
February 25, 2016
___________
Regularly-Volatile Durable Goods Orders Had a Positive Month,
Amidst Continuing Downside Trends and Recession Signals
New-Home Sales Activity Remained Unstable but
Held in Smoothed, Down-Trending, Low-Level Stagnation
Existing-Homes Sales Activity Remained Uncertain, Despite Revisions;
Smoothed Activity Held in Down-Trending, Low-Level Stagnation
___________
PLEASE NOTE: The next regular Commentary, tomorrow, Friday, February 26th will cover the second estimate of, first revision to fourth-quarter 2015.
Best wishes to all — John Williams
OPENING COMMENTS AND EXECUTIVE SUMMARY
No Relief for Faltering Economic Activity. Despite the headline monthly gain in January 2016 New Orders for Durable Goods, details there were within the normal bounds of variability for that regularly-volatile series. The trends and signals indicating economic contraction and formal recession continued.
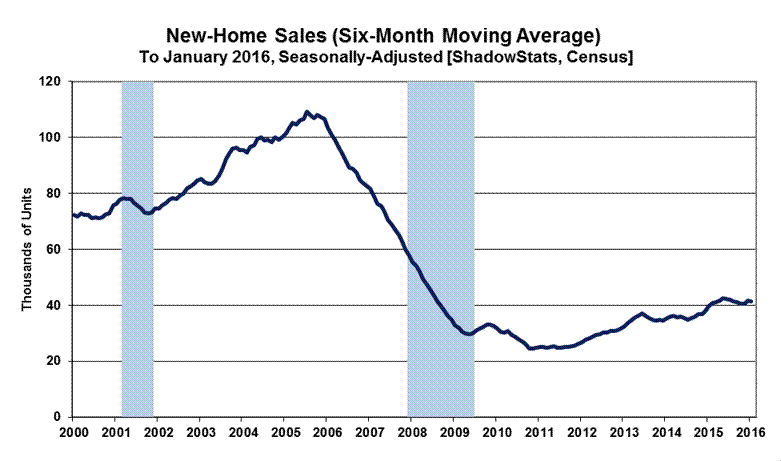
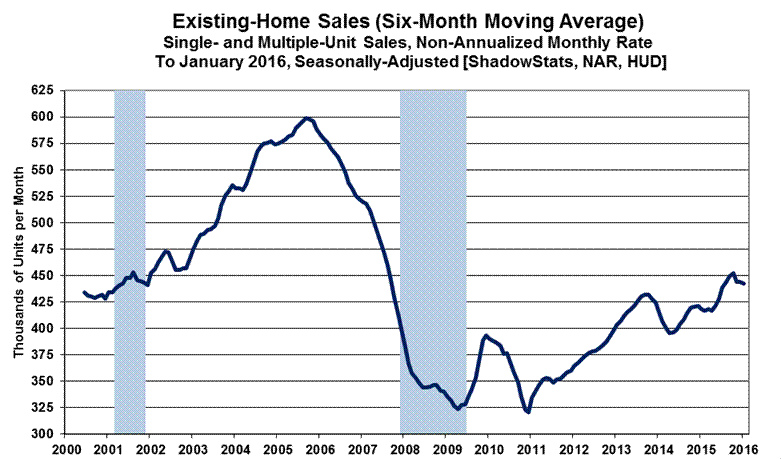
On the home-sales front, despite continuing issues with the quality of headline monthly reporting, both series are showing patterns of economic non-recovery—never having regained their pre-economic-collapse highs—with current smoothed headline detail showing ongoing patterns of low-level stagnation. While both Existing-Homes Sales (see the new Graph 13) and New-Home Sales (see Graph 9) had shown up-trending stagnation, both series recently shifted to down-trending, low-level stagnation.
The annual revisions to Existing-Home Sales are shown Graph 18 in the Reporting Detail section.
The outlook for broad U.S. economic activity will be reviewed in tomorrow’s Commentary No. 789, covering the first revision to fourth-quarter 2015 GDP (see the Week Ahead).
Fiscal-Year 2015 GAAP-Based Statements on the U.S. Government Should Be Available Today. Separately, the U.S. Treasury has advised that the “publication date for the FY 2015 Financial Report is to be February 25, 2016. We [Treasury] currently plan on having it available at the Fiscal Service website http://www.fiscal.treasury.gov/fsreports/rpt/finrep/fr/fr_index.htm after 3PM [ET].” This should be the 2015, not the 2014 report.
While the annual reports increasingly have become annual puff pieces on the fine handling of fiscal policy by the incumbent Administration, underlying reality usually can be found in the footnotes and in the Auditor’s Comments or Qualifications.
ShadowStats observations will follow in subsequent Commentaries, with a fully-updated table of annual comparison in a Special Commentary likely in March.
Today’s Commentary (February 25th). The balance of these Opening Comments provides summary coverage of January reporting on New Orders for Durable Goods, New- and Existing- Home Sales (and revisions) and a brief update to Consumer Liquidity Conditions (Consumer Confidence). The Week Ahead again previews tomorrow’s first revision to fourth-quarter 2015 Gross Domestic Product and initial reporting of Gross National Product and Gross Domestic Income for that quarter, as discussed in prior Commentary No. 787. The latest Hyperinflation Outlook Summary is found in Commentary No. 783.
New Orders for Durable Goods—January 2016—Downside Trends and Recession Signals Continued. Headline January 2016 durable goods orders gained 4.9%, somewhat above expectations and in the context of a 0.4% upside revision to the previously reported level of December activity [December’s monthly contraction was revised to 4.6% (-4.6%) from 5.1% (-5.1%)]. Somewhat shy of half the headline January gain came from surging commercial aircraft orders, with other gains broadly spread, particularly among orders for defense aircraft and motor vehicles. Inventories declined in January 2016, and more steeply in December 2015, which generally would have negative GDP implications, but that detail should be too late to affect tomorrow’s GDP revision.
This regularly-volatile series had a positive month, but all the trends remained negative. Given the patterns of general decline in the monthly, quarterly and annual activity of the last year, the broad signal for unfolding U.S. economic activity remained sharply negative, with the summary statistics and smoothed six-month trends still signaling a deepening and ongoing recession.
Quarterly Growth. Annualized quarterly declines in real new orders (ex-commercial aircraft) were 5.58% (-5.58%) in fourth-quarter 2014, and 7.73% (-7.73%) in first-quarter 2015. Following with appropriate one-quarter lags, both first- and second-quarter 2015 industrial production contracted.
Annualized real change for second-quarter 2015 orders was a gain of 2.10%, with third-quarter activity up at an annualized 10.38%. Fourth-quarter 2015, contracted at a revised annualized quarterly pace of 1.78% (-1.78%). Based solely on January 2016 reporting, this series was on an early track for real, annualized quarterly growth of 4.89%. The quarterly gains or muted real contractions here are due partially to highly-suspect, and increasingly-negative durable goods inflation in the PPI reporting, which has had the effect of boosting the real monthly-, quarterly- and annual-growth detail.
Third-quarter industrial production growth was on the plus-side, but fourth-quarter 2015 industrial production collapsed, as discussed in Commentary No. 786, and the current fourth-quarter durable goods orders are a negative indicator for first-quarter 2016 production and a solid signal for continuing and deepening recession.
On a nominal basis (before inflation adjustment), initial fourth-quarter 2015 orders growth—again, ex-commercial aircraft—fell at a revised annualized quarterly pace of 2.72% (-2.72%), versus a third-quarter 2015 unrevised annualized gain of 8.63%, second-quarter 2015 quarterly annualized growth of 0.57%, a first-quarter 2015 annualized contraction of 7.29% (-7.29%), and a decline of 4.36% (-4.36%) in fourth-quarter 2014. Based solely on January 2016 reporting, annualized first-quarter 2016 growth was on an early trend for 2.52%.
Headline Nominal (Not-Adjusted-for-Inflation) January 2016 Reporting. The regularly-volatile, seasonally-adjusted, nominal level of January 2016 new orders for durable goods rose month-to-month by 4.89%, versus a revised, narrower monthly decline of 4.63% (-4.63%) in December 2015 and a minimally-wider November decline of 0.52% (-0.52%). Net of the revisions to December, aggregate new orders in January rose in the month by 5.34%, instead of the headline 4.89%.
The year-to-year change in January 2016 durable goods orders was a gain of 1.75%, following a narrowed annual decline of 0.15% (-0.15%) in December 2015, and a somewhat smaller annual gain in revision of 0.61% for November 2015.
The headline January 2016 detail, again, was before consideration of volatility in commercial-aircraft orders. With the aircraft orders considered, headline changes in January were smaller but still positive. Nonetheless, allowing for the regular monthly volatility in the headline reporting of new orders, the smoothed trends of activity continue to be negative, consistent with a downturn in what had been a continuing pattern of broad stagnation. The inflation-adjusted real series, and that same series corrected for the understatement of official inflation, are discussed here shortly. The corrected series—net of commercial aircraft orders—has remained relatively flat, at a low-level and now down-trending pattern of stagnation, with the other plotted series still showing an unfolding downturn of a nature that usually precedes or coincides with a recession or a deepening business downturn.
Detail Net of Volatility in Commercial-Aircraft Orders. The reporting of extreme contractions and surges in commercial-aircraft orders is seen commonly in an irregularly-repeating process throughout the year, and that often may dominate changes in headline monthly durable goods orders. These extremely volatile aircraft orders are booked years into the future and are indicative more of longer-term, rather than shorter-term prospects for manufacturing activity. In the current circumstance, the monthly increase in January commercial aircraft orders accounted for roughly 43% of the headline monthly gain in the aggregate orders.
Net of a 54.16% headline gain in January 2016, and a revised decline of 29.10% (-29.10%) in December 2015 and an unrevised decline of 23.28% (-23.28%) in November 2015 commercial aircraft orders, aggregate new orders still rose by 2.75% in January 2016. In like manner, ex-commercial aircraft orders, net orders fell by a revised 3.18% (-3.18%) in December, and rose by a revised 1.26% in November.
Year-to-year and seasonally-adjusted, January 2016 new orders (net of commercial aircraft) rose by 1.54%, following a revised, narrowed annual decline in December 2015 of 1.88% (-1.88%), and a minimally reduced annual gain of 1.46% in November 2015.
Real (Inflation-Adjusted) Durable Goods Orders—January 2016. ShadowStats uses the PPI component inflation measure “Durable Manufactured Goods” for deflating the new orders for durable goods series (as described and detailed in the Reporting Detail).
Adjusted for “unchanged” headline monthly January 2016 inflation, and as reflected in the accompanying graphs, real month-to-month aggregate orders in January 2016 rose by 4.89%, where December 2015 orders fell by a revised 4.40% (-4.40%), and November real orders declined by a revised 0.34% (-0.34%). Ex-commercial aircraft, monthly real orders rose by 2.75% in January 2016, having declined by a revised 2.94% (-2.94%) in December 2015 and against a revised gain of 1.44% in November.
Real year-to-year aggregate orders in January 2016 rose by 3.11%, versus revised gains in December 2015 of 0.88% and in November 2015 of 1.53%. Ex-commercial aircraft, real orders rose by 2.89% in January 2016, having declined year-to-year by a revised 0.88% (-0.88%) in December 2015 and against a revised annual gain of 2.38% in November 2015.
Graphs of Inflation-Adjusted and “Corrected” Smoothed Durable Goods Orders. Following Graphs 1 and 2 show the headline monthly detail, as well as the six-month moving-average activity for both the aggregate new orders series and the series net of the unstable commercial-aircraft orders. The moving-average levels in both series had turned lower into year-end 2014 and after some uptick in mid-2015—some smoothed bounce-back—the smoothed trend turned down anew into late fourth-quarter 2015 and January 2016, despite the headline rebound in January 2016 new orders.
Graph 1: Real Total New Orders for Durable Goods to Date

Graph 2: Real New Orders for Durable Goods – Ex Commercial-Aircraft Orders to Date
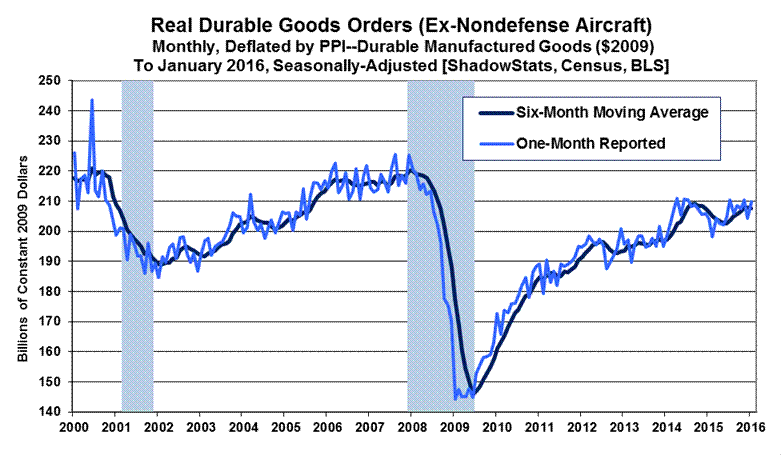
Broadly, there has been a general pattern in recent years of stagnation or bottom-bouncing evident in the orders—clearly not the booming recovery seen in official GDP reporting. The real (inflation-adjusted) monthly and six-month moving-average level of new orders in January 2016 remained below both the pre-2007 recession high, as well as the pre-2000 recession high for the series. The pattern of low-level stagnation and fluctuating downtrend in the annual inflation-adjusted series since mid-2014—net of the irregular aircraft-order effects—again is one that usually precedes or is coincident with a recession.
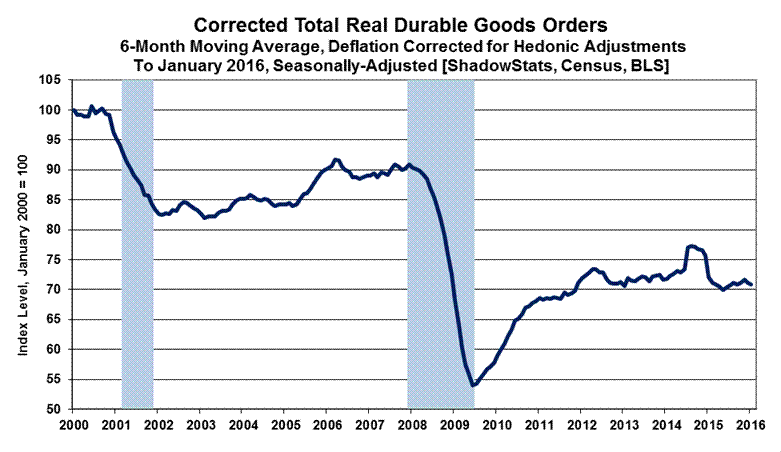
The Real New Orders Series Corrected for Inflation Understatement. As with other economic series deflated by official government inflation measures, estimates of inflation-adjusted growth in new orders for durable goods generally are overstated, due to the understatement of official inflation. That understatement here comes from the government’s use of hedonic-quality adjustments—quality issues usually not perceived by users or consumers of the involved products—in justifying a reduced pace of headline inflation (see Public Commentary on Inflation Measurement).
As done for other series such as the GDP, real retail sales and industrial production, ShadowStats publishes an experimental corrected version of the inflation-adjusted graph of real new orders for durable goods, corrected for the understatement of the related headline PPI inflation.
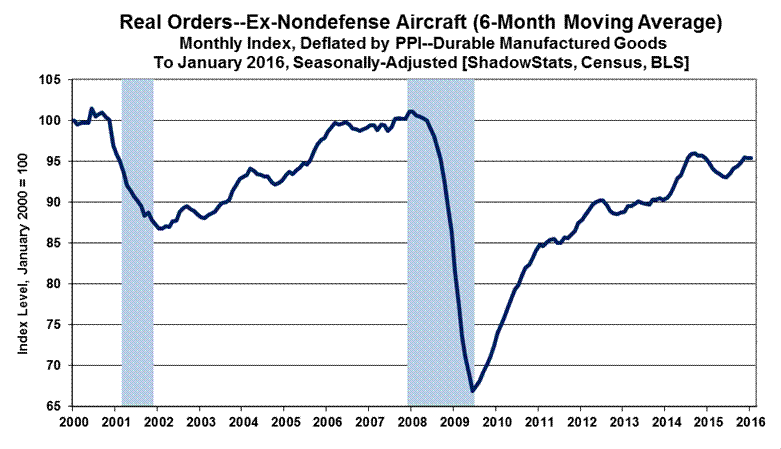
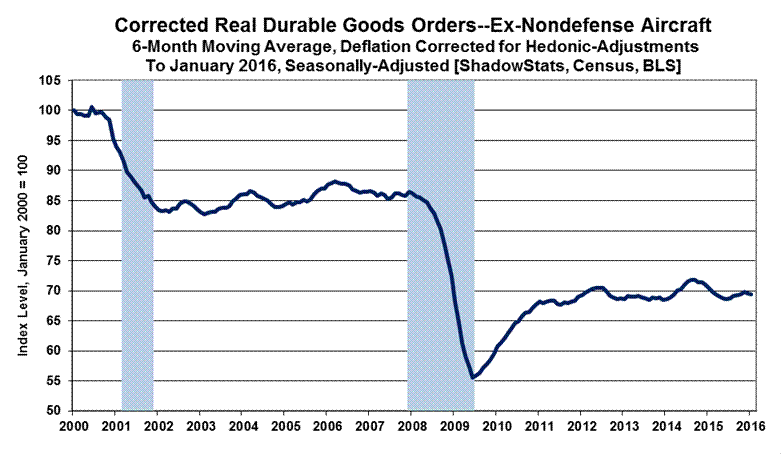
Two sets of graphs follow. The first set (Graph 3 and Graph 4) shows the aggregate series or total durable goods orders; the second set (Graph 5 and Graph 6) shows the ex-commercial aircraft series.
The aggregate orders series in Graphs 3 and 4 includes commercial aircraft orders. Placed years in advance, aircraft orders are a better indicator of long-range production activity, than they are as a near-term leading indicator of production activity. Graphs 5 and 6 are shown net of the volatile commercial aircraft orders.
The first graph in each of the following two series shows the official six-month moving average, the same heavy dark-blue line shown in Graph 1 and Graph 2, along with the light-blue thin line of monthly detail. The second graph in each set is the same six-month, moving-average series shown in the first graph, but it has been re-deflated to correct for the understatement of the PPI durable goods inflation measure used in the headline-deflation process. ShadowStats estimates that inflation understatement, with the graphs indexed to January 2000 = 100.
Graph 6, entitled “Corrected Real Orders—Ex-Commercial Aircraft” (a six-month trailing average) is perhaps the best indicator of broad underlying order activity in the durable goods sector, in the context of signaling in advance actual near-term production and economic activity.
[Graphs 3 to 6 follow, beginning on the next page]
Graph 3: Index of Real Total New Orders for Durable Goods, 6-Month Moving Average

Graph 4: Corrected Index of Real Total New Orders for Durable Goods, 6-Month Moving Average
Graph 5: Index of Durable Goods Orders – Ex Commercial Aircraft, 6-Month Moving Average
Graph 6: Corrected Index of Durable Goods Orders – Ex Commercial Aircraft, 6-Month Moving Average
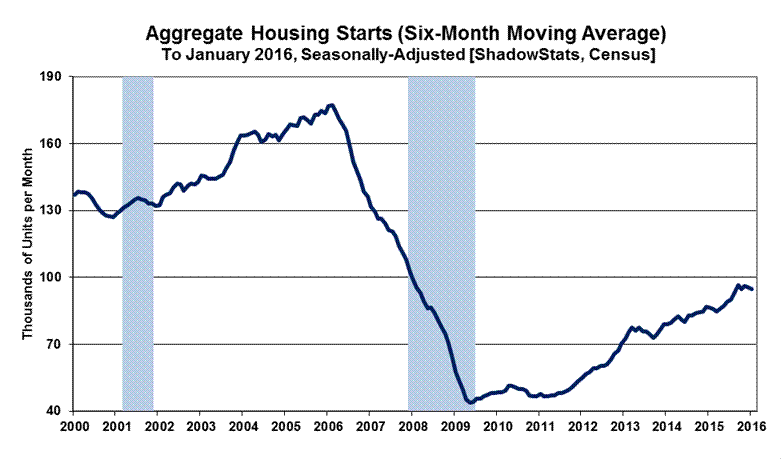
New- and Existing-Home Sales—January 2016—Low-Level Stagnation, Never Recovered, Unstable Reporting. January 2016 New- and Existing-Home Sales series both remained deep in depression (see Commentary No. 754), down respectively by 64% (-64%) and by 25% (-25%) from their pre-recession peaks. Holding in low-level stagnation, with statistically-insignificant changes in headline activity for New-Home Sales, smoothed activity has been turning lower (Graph 9) in the latter part of 2015 into 2016. Despite unstable and revised headline detail in Existing-Home Sales, and in the context of shifting patterns in the smoothed pattern of low-level stagnation, the pattern of smoothed Existing-Home Sales activity also has turned to the downside (Graph 13) in the latter part of 2015 into 2016. These series never recovered from the economic collapse into 2009. After going through a period of protracted, low-level stagnation, general housing construction and sales activity have begun to turn down anew.
Broadly discussed in No. 777 Year-End Special Commentary and updated briefly in the section following on Consumer Conditions, the primary underlying issues restraining current residential real estate activity remain intense, structural-liquidity woes besetting the consumer. In the last eight-plus years of economic collapse and stagnation, that circumstance has continued to prevent a normal recovery in broad U.S. economic activity, particularly tied to homeowner real estate, with the private-housing sector never having recovered from the business collapse of 2006 into 2009.
Without real (inflation-adjusted) growth in household income and without the ability or willingness to take on meaningful new debt, the consumer simply has not had the wherewithal to fuel sustainable economic growth. There remains no chance of a near-term, sustainable turnaround in the housing market, without a fundamental upturn in consumer and banking-liquidity conditions. That has not happened and does not appear to be in the offing.
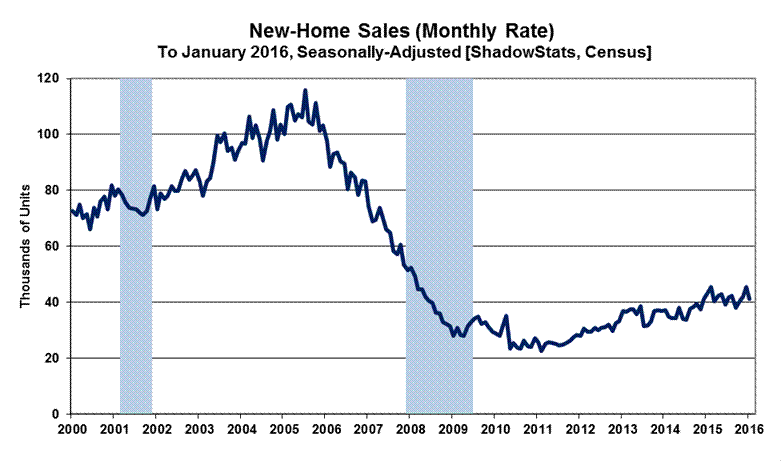
New-Home Sales—January 2016—Smoothed Trend Is Deterioration, Despite Meaningless Monthly Data. As usual, the volatile reporting of monthly and annual changes in January 2016 New-Home Sales was not statistically significant. This time the headline detail was on the downside; in December 2015, it was on the upside. The unstable January 2016 headline reporting of 494,000 units in annualized sales (a 41,117 monthly rate as used in the graphs) turned negative year-to-year by 5% (-5%). It also remained down by 64% (-64%) from the 2005 pre-recession peak for the series.
ShadowStats assesses such unstable series by considering the gyrations in monthly activity in the context of a six-month moving-average of the headline numbers. With the otherwise meaningless monthly swings in these numbers smoothed out, new-home sales activity continued in a broad pattern of low-level, stagnation (see Graph 9), which has turned down anew.
Graphed either way, smoothed or not, the various housing series generally have continued to show a pattern of economic activity plunging from 2005 or 2006 into 2009, and then stagnation, with the stagnation continuing at a low level of activity to date. Housing activity never recovered with the purported GDP recovery. From its pre-recession peak of July 2005, headline January 2016 New-Home Sales activity still was down by 64.4% (-64.4%), while January 2016 Single-Unit Housing Starts were down by 59.9% (-59.9%) from the January 2006 high of that series.
Headline January 2016 Detail for New-Home Sales. New-Home Sales (Census Bureau, counted based on contract signings) declined month-to-month by a headline, seasonally-adjusted, statistically-insignificant 9.2% (-9.2%) in January 2016. Although the headline level of December 2015 sales was unrevised, headline monthly growth in December revised lower to 8.2%. That followed an upwardly revised gain of 4.8% in November, and a downwardly-revised gain of 5.0% in October.
Year-to-year, January 2016 sales declined by a statistically-insignificant 5.2% (-5.2%). That followed an unrevised December 2015 annual sales gain of 9.9%, an upwardly revised annual gain of 12.0% in November 2015 and a downwardly-revised 1.7% annual gain in October 2015.
In the arena of continued extreme volatility and unstable, nonsensical headline reporting, consider that the annualized quarterly pace of sales gain in first-quarter 2015 was 43.9%, with the second-quarter 2015 sales activity in an annualized quarterly decline of 14.8% (-14.8%). Third-quarter 2015 new-home sales showed an unrevised annualized contraction of 6.8% (-6.8%), with the fourth-quarter sales gain estimated at 18.4%, with first-quarter 2016 activity down at an annualized quarterly pace of 11.3% (-11.3%), based solely on January 2016 reporting.
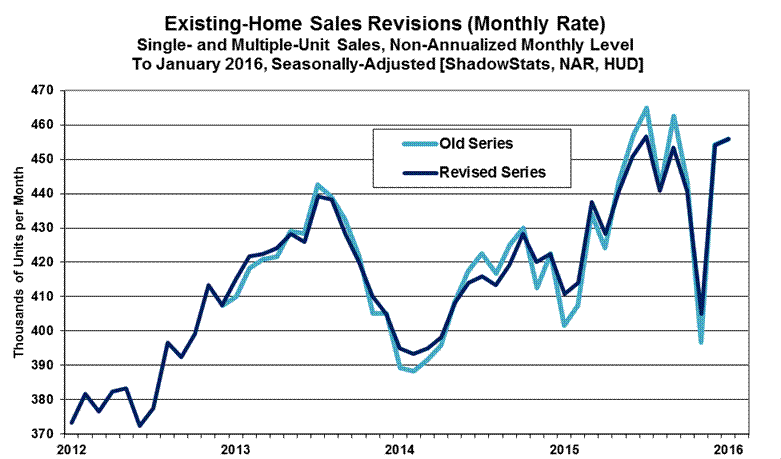
Existing-Home Sales—January 2016—Unstable Headline Changes Remain in Month-to-Month Reporting, Despite Annual Revisions. Discussed in Commentary No. 782, the Existing-Home Sales series is based on actual closings of home sales. Where recent changes in mortgage closing requirements have delayed some closings into the next month, such disrupted recent, monthly existing-home sales counts. With those systemic distortions still in play, to an unknown extent, current headline numbers likely are less stable than usual. At some point, though, the numbers will stabilize. That said, the National Association of Realtors® (NAR) just published its annual revisions to the series, covering the first couple of months of the new mortgage closing circumstance. Along with the caution on potential data instabilities, the accompanying detail and graphs reflect the headline numbers.
The annual revisions are plotted in Graph 18 in the Reporting Detail. They appear largely to reflect offsetting seasonal adjustments in the benchmarking period 2013-to-date. Separately, ShadowStats has introduced a new graph of the headline series, smoothed with a six-month moving average. Graph 13 is found at the end of this section, along with detail and the description.
Ongoing Lack of Recovery from Collapse into 2009. Existing-Home Sales in January 2016 were down by a headline 24.8% (-24.8%) from the June 2005 pre-recession peak, a high that has not been matched since the collapse. In contrast, the January 2016 headline monthly Housing Starts remained down by 51.6% (-51.6%) versus its January 2006 pre-recession high.
First-quarter 2015 Existing-Home Sales showed a revised annualized quarterly sales contraction of 2.6% (-2.6%), with the second-quarter 2015 pace of annualized growth revising lower to 19.5%. Third-quarter 2015 growth also slowed, to a revised annualized pace of 9.7%, with fourth-quarter 2015 activity contracting at a less-severe annualized pace of 14.2% (-14.2%). Based just on January, first-quarter 2016 is on track for an annualized gain of 22.4% in this highly-volatile series.
Headline Detail for January 2016 Existing-Home Sales. In the context of annual revisions and likely distortions, the February 23rd release of January 2016 existing-home sales (counted based on actual closings, NAR) showed a seasonally-adjusted, headline monthly gain of 0.4%, following a revised, slower monthly gain of 12.1% in December 2015, and a shallower contraction of 8.1% (-8.1%) in November.
On a year-to-year basis, January 2016 sales were up by 11.0%, following an unrevised annual gain of 7.5% in December 2015 and a minimally revised annual decline of 3.6% (-3.6%) in November 2015.
These numbers still are moving outside the normal scope of reporting volatility for this series, again, suggestive of some ongoing reporting issues. Separately, the quality of data underlying this series remains highly questionable, as usual. All that said, smoothed for irregular distortions, the reporting remained statistically consistent with a period of broad, low-level stagnation, which generally has been up-trending but recently turned to down-trending, as seen in Graph 13.
Proportion of Distressed Sales Increased, Along with All-Cash Sales in January. The NAR estimated the portion of January 2016 sales in “distress” rose for the month to 9% (7% foreclosures, 2% short sales), up from 8% (6% foreclosures, 2% short sales) in December 2015, and against 11% (8% foreclosures, 3% short sales) in January 2015.
Reflecting continued lending problems and stresses within the financial system, including related banking-industry and consumer-solvency issues, as well as the ongoing influx of speculative investment money into the existing-housing market, the NAR estimated that all-cash sales were 26% of January 2016 sales, up from 24% of December 2015 sales and versus 27% in January 2015.
The primary, underlying difficulty for the housing market remains intense, structural-liquidity constraints on the consumer, which continue to prevent a normal recovery in broad U.S. business activity from the economic collapse, as discussed in the following Consumer Conditions section.
New- and Existing-Home Sales Graphs. Added to the traditional monthly home-sales graphs is a Six-Month Moving Average of Existing-Home Sales (Graph 13). Unlike the monthly levels shown in Graph 11, there are no special averages to smooth the effects of government programs aimed shifting home-sales activity patterns. The new series is shown smoothed only by a six-month moving average, with a transitional averaging that joins the old and new series otherwise plotted separately in Graph 11.
The usual monthly graphs of January 2016 New-and Existing-Home sales activity also follow. The New-Home Sales plots (Graph 7 and Graph 9) reflect activity based both on headline monthly reporting as well as using a smoothed, six-month moving average of the series. Those graphs are accompanied by comparative graphs of January 2016 Single-Unit Housing Starts activity (Graph 8 and Graph 10), measures which are limited to single-unit activity.
The Existing-Home Sales graphs (Graphs 11 and 13) are accompanied by comparative plots of aggregate Housing Starts activity (Graphs 12 and 14). Those measures include both single- and some multiple-unit activity. The various comparative Housing Starts graphs are repeated from (Commentary No. 786).
[Graphs 7 to 14 begin on the next page]
Graph 7: New-Homes Sales – Monthly Level
Graph 8: Single Unit Housing Starts – Monthly Level

Graph 9: New-Homes Sales – Six-Month Moving Average (Thousands of Units per Month)
Graph 10: Single Unit Housing Starts – Six-Month Moving Average (Thousands of Units per Month)

Graph 11: Revised Existing-Home Sales – Monthly Level

Graph 12: Total Housing Starts – Monthly Level
Graph 13: Revised Existing-Home Sales (Six-Month Moving Average, Monthly Rate of Activity)
Graph 14: Total Housing Starts (Six-Month Moving Average, Monthly Rate of Activity)
Consumer Conditions Update: Tumbling February Consumer Confidence. A full update of consumer liquidity conditions will follow in the employment/unemployment Commentary No. 790, of March 4th. That should include updated material on monthly median household income. Sentier Research advises that it has scheduled release of the headline December 2015 detail for the series on February 29th, with the January 2016 detail and annual benchmarking following thereafter.
Constraining home sales activity, the consumer remains in an extreme liquidity bind with weakening confidence, discussed broadly in No. 777 Year-End Special Commentary and updated here (previously updated in Commentary No. 785). Without sustained growth in real income, and without the ability and/or willingness to take on meaningful new debt in order to make up for the income shortfall, the U.S. consumer is unable to sustain a meaningful, positive-growth trend in home sales activity. Sales activity remains shy of the pre-economic collapse levels by an amount that qualifies as a great depression.
This brief update covers the February 23rd release of Consumer Confidence, which tended to reconfirm the pre-existing, generally-bleak outlook for consumer conditions. The Conference Board’s seasonally-adjusted (unadjusted data are not available) Consumer-Confidence Index (Graph 15) fell sharply, by 5.7% (-5.7%) in February, versus a downwardly-revised reading in January 2016, up 1.6% [previously by 1.9%] for the month. Such was accompanied by related downticks in the three- and six-month moving averages of the series. For February 2016, the index level was down year-to-year by 6.7% (-6.7%), versus an annual drop of 5.8% (-5.8%) in January 2016.
Shown in Graph 16, as previously published, the University of Michigan’s early-February 2016 Consumer Sentiment Index turned down in the month, along with related downticks in the three- and six-month moving averages of the series. Those measures also moved lower in January 2016. The headline index level was down by 1.4% (-1.4%) for the month, and down by 4.9% (-4.9%) from the year-ago, full-month reading for February 2015. Full-month detail 2016 will be released tomorrow, February 26th.
Graph 15: Consumer Confidence to February 2016 (Conference Board)

Graph 16: Consumer Sentiment Index to Early-February 2016 (University of Michigan)

Graph 17: Comparative Consumer Confidence and Sentiment (6-Month Moving Averages) since 1970
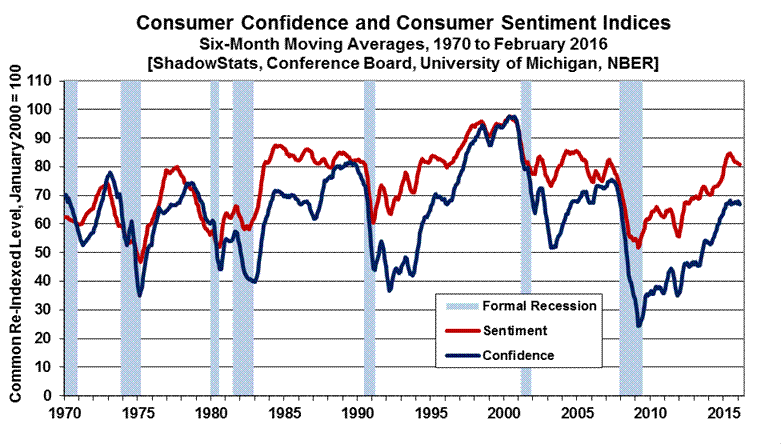
For purposes of showing the Consumer Confidence and Consumer Sentiment measures on a comparable basis, the graphs reflect both measures re-indexed to January 2000 = 100 for the monthly reading. Standardly reported, the Conference Board’s Consumer Confidence Index is set with 1985 = 100, while the University of Michigan’s Consumer Sentiment Index is set with January 1966 = 100.
Both measures remain below near-term peaks. The Confidence and Sentiment series tend to mimic the tone of headline economic reporting in the press (see discussion in Commentary No. 764), and often are highly volatile month-to-month, as a result. With increasingly-negative, headline financial and economic reporting and circumstances at hand and ahead, successive negative hits to both the confidence and sentiment readings remain highly likely to continue in the months ahead, as those factors likely contributed to the weaker February readings.
Smoothed for irregular, short-term volatility, the two series remain at levels seen typically in recessions. Suggested in Graph 17—plotted for the last 45 years—the latest readings of Confidence (monthly through February) and Sentiment (monthly through early-February) generally have not recovered levels preceding most formal recessions of the last four decades. Broadly, the consumer measures remain well below, or are inconsistent with, periods of historically-strong economic growth seen in 2014 and sporadically into third-quarter 2015 GDP growth.
[The Reporting Detail section includes additional detail on
Durable Goods Orders and Home Sales series.]
__________
REPORTING DETAIL
NEW ORDERS FOR DURABLE GOODS (January 2016)
Regularly-Volatile Durable Goods Orders Had a Positive Month, Amidst Continuing Downside Trends and Recession Signals. Headline January 2016 durable goods orders gained 4.9%, somewhat above expectations and in the context of a 0.4% upside revision to the previously reported level of December activity [December’s monthly contraction was revised to 4.6% (-4.6%) from 5.1% (-5.1%)]. Somewhat shy of half the January monthly gain came from surging commercial aircraft orders, with other gains broadly spread, particularly among orders for defense aircraft and motor vehicles. Inventories declined in January 2016, and more steeply in December 2015, which generally would have negative GDP implications, but that detail should be too late to impact tomorrow’s GDP revision.
This regularly-volatile series had a positive month, but all the trends remained negative. Given the patterns of general decline in the monthly, quarterly and annual activity of the last year, the broad signal for unfolding U.S. economic activity remained sharply negative, with the summary statistics and smoothed six-month trends still signaling a deepening and ongoing recession.
Quarterly Growth. Annualized quarterly declines in real new orders (ex-commercial aircraft) were 5.58% (-5.58%) in fourth-quarter 2014, and 7.73% (-7.73%) in first-quarter 2015. Following with appropriate one-quarter lags, both first- and second-quarter 2015 industrial production contracted.
Annualized real change for second-quarter 2015 orders was a gain of 2.10%, with third-quarter activity up at an annualized 10.38%. Fourth-quarter 2015, contracted at a revised annualized pace of 1.78% (-1.78%) [previously down by 2.30% (-2.30%)]. Based solely on January 2016 reporting, this series is on an early track for real, annualized quarterly growth of 4.89%. The quarterly gains or muted real contractions here are due partially to highly-suspect, and increasingly-negative durable goods inflation in the PPI reporting, which has the effect of boosting the real monthly-, quarterly- and annual-growth detail.
Third-quarter industrial production growth was on the plus-side, but fourth-quarter 2015 industrial production collapsed, as discussed in Commentary No. 786, and the current fourth-quarter durable goods orders are a negative indicator for first-quarter 2016 production and a solid signal for continuing and deepening recession.
On a nominal basis (before inflation adjustment), initial fourth-quarter 2015 orders growth—again, ex-commercial aircraft—fell at a revised annualized quarterly pace of 2.72% (-2.72%) [previously down by 3.23% (-3.23%)], versus a third-quarter 2015 unrevised annualized gain of 8.63%, second-quarter 2015 quarterly annualized growth of 0.57%, a first-quarter 2015 annualized contraction of 7.29% (-7.29%), and a decline of 4.36% (-4.36%) in fourth-quarter 2014. Based solely on January 2016 reporting, annualized first-quarter 2016 growth is on an early trend for 2.52%.
Headline Nominal (Not-Adjusted-for-Inflation) January 2016 Reporting. The Census Bureau reported this morning, February 25th, that the regularly-volatile, seasonally-adjusted, nominal level of January 2016 new orders for durable goods rose month-to-month by 4.89%, versus a revised, narrower monthly decline of 4.63% (-4.63%) [previously down by 5.06% (-5.06%)] in December 2015 and a minimally-wider November decline of 0.52% (-0.52%) [previously down by 0.49% (-0.49%), initially “unchanged” at up by 0.03%]. Net of the revisions to December, aggregate new orders in January rose in the month by 5.34%, instead of the headline 4.89%.
The year-to-year change in January 2016 durable goods orders was a gain of 1.75%, following a narrowed annual decline of 0.15% (-0.15%) [previously down by 0.58% (-0.58%)] in December 2015, and a somewhat smaller annual gain in revision of 0.61% [previously up by 0.64%, initially up by 1.20%] in November 2015.
The headline January 2016 detail, again, is before consideration of volatility in commercial-aircraft orders. With the aircraft orders considered, headline changes in January were smaller but still positive. Nonetheless, allowing for the regular monthly volatility in the headline reporting of new orders, the smoothed trends of activity continue to be negative, consistent with a downturn in what had been a continuing pattern of broad stagnation. The inflation-adjusted real series, and that same series corrected for the understatement of official inflation, are discussed and graphed in the Opening Comments section. The corrected series—net of commercial aircraft orders—has remained relatively flat, at a low-level and now down-trending pattern of stagnation, with the other plotted series still showing an unfolding downturn of a nature that usually precedes or coincides with a recession or a deepening business downturn.
Detail Net of Volatility in Commercial-Aircraft Orders. The reporting of extreme contractions and surges in commercial-aircraft orders is seen commonly in an irregularly-repeating process throughout the year, and that often may dominate changes in headline monthly durable goods orders. These extremely volatile aircraft orders are booked years into the future and are indicative more of longer-term, rather than shorter-term prospects for manufacturing activity. In the current circumstance, the monthly increase in January commercial aircraft orders accounted for roughly 43% of the headline monthly gain in the aggregate orders series.
Net of a 54.16% headline gain in January 2016, and a revised decline of 29.10% (-29.10%) [previously down by 29.36% (-29.36%)] in December 2015 and an unrevised decline of 23.28% (-23.28%) in November 2015 commercial aircraft orders, aggregate new orders still rose by 2.75% in January 2016. In like manner, ex-commercial aircraft orders, net orders fell by a revised 3.18% (-3.18%) [previously down by 3.63% (-3.63%)] in December, and rose by a revised 1.26% [previously up 1.29%, initially up by1.76%] in November.
Year-to-year and seasonally-adjusted, January 2016 new orders (net of commercial aircraft) rose by 1.54%, following a revised, narrowed annual decline in December 2015 of 1.88% (-1.88%) [previously down by 2.31% (-2.31%)], and a minimally reduced annual gain of 1.46% [previously up by 1.49%, initially up by 2.01%] in November 2015.
Real (Inflation-Adjusted) Durable Goods Orders—January 2016. ShadowStats uses the PPI component inflation measure “Durable Manufactured Goods” for deflating the new orders for durable goods series. Published only on a not-seasonally-adjusted basis and not revised in the recent PPI benchmarking, the related January 2016 PPI series turned “unchanged,” at 0.00% month-to-month, having contracted on a monthly basis in ten of the preceding eleven months. In December 2015, the related PPI series fell month-to-month by 0.24% (-0.24%), having declined by 0.18% (-0.18%) in November. Headline annual inflation in January 2016 contracted at a negative year-to-year pace of 1.31% (-1.31%), having declined in December 2015 year-to-year by 1.02% (-1.02%) and by 0.90% (-0.90%) in November 2015.
Adjusted for that “unchanged” headline monthly January 2016 inflation, and as reflected in the graphs in the Opening Comments section, real month-to-month aggregate orders in January 2016 rose by 4.89%, where December 2015 orders fell by a revised 4.40% (-4.40%) [previously down by 4.83% (-4.83%)], and November real orders declined by a revised 0.34% (-0.34%) [previously down by 0.49% (-0.49%), initially up by 0.21%]. Ex-commercial aircraft, monthly real orders rose by 2.75% in January 2016, having declined by a revised 2.94% (-2.94%) [previously down by 3.39% (-3.39%)] in December 2015 and against a revised gain of 1.44% [previously up by 1.47%, initially up by 1.95%] in November.
Real year-to-year aggregate orders in January 2016 rose by 3.11%, versus revised gains in December 2015 of 0.88% [previously up by 0.44%] and in November 2015 of 1.53% [previously up by 1.55%, initially up by 2.12%]. Ex-commercial aircraft, real orders rose by 2.89% in January 2016, having declined year-to-year by a revised 0.88% (-0.88%) [previously down by 1.30% (-1.30%)] in December 2015 and against a revised annual gain of 2.38% [previously up by 2.41%, initially up by 2.93%] in November 2015.
Graphs of Inflation-Adjusted and “Corrected” Smoothed Durable Goods Orders. Three sets of inflation-adjusted graphs (Graphs 1 to 5) are displayed in the Opening Comments section. The first set (Graphs 1 and 2) shows the headline monthly detail, as well as the six-month moving-average activity for both the aggregate new orders series and the series net of the unstable commercial-aircraft orders. The moving-average levels in both series had turned lower into year-end 2014 and into the first two quarters of 2015, with some smoothed bounce-back into third-quarter 2015, followed by renewed downturn into late fourth-quarter 2015 and January 2016.
The second set of graphs (Graphs 3 to 4) shows the patterns of six-month moving averages of historical, headline real new orders for durable goods, net of official inflation, as well as that pattern “corrected” for the understatement of that inflation (and for the related overstatement of official, inflation-adjusted growth). The third set of graphs (Graphs 5 to 6) shows the same patterns, but for the aggregate durable goods series, net of commercial aircraft orders.
Caution: Current durable goods reporting remains subject to many of the same sampling and concurrent-seasonal-adjustment problems seen with retail sales, payroll and unemployment reporting. Unusual seasonal-factor volatility raises issues as to the significance of reported seasonally-adjusted monthly and annual changes. While those issues were brought into balance, temporarily, with the annual benchmark revision to durable goods orders on May 14, 2015, subsequent monthly reporting and revisions have made all historical reporting prior to November 2015 inconsistent with the current headline numbers.
NEW-HOME SALES (January 2016)
Smoothed Trend Is in Deterioration, Despite Meaningless Monthly Data. As usual, the volatile reporting of monthly and annual changes in January 2016 New-Home Sales was not statistically significant. This time the headline detail was on the downside; in December 2015, it was on the upside. The unstable January 2016 headline reporting of 494,000 units in annualized sales (a 41,117 monthly rate as used in the graphs) turned negative year-to-year by 5% (-5%). It also remained down by 64% (-64%) from the 2005 pre-recession peak for the series.
ShadowStats assesses such unstable series by considering the gyrations in monthly activity in the context of a six-month moving-average of the headline numbers. With the otherwise meaningless monthly swings in these numbers smoothed out, new-home sales activity continued in a broad pattern of low-level, stagnation (see Graph 9 in the Opening Comments), which has turned down anew.
Graphed either way, smoothed or not, the various housing series generally have continued to show a pattern of economic activity plunging from 2005 or 2006 into 2009, and then stagnation, with the stagnation continuing at a low level of activity to date. Housing activity never recovered with the purported GDP recovery. From its pre-recession peak of July 2005, headline January 2016 New-Home Sales activity still was down by 64.4% (-64.4%), while January 2016 Single-Unit Housing Starts were down by 59.9% (-59.9%) from the January 2006 high of that series.
Discussed in the Opening Comments section, there has been no improvement in underlying consumer liquidity conditions. Correspondingly, with no fundamental growth in liquidity to fuel increasing consumer activity, there is no basis for a current or imminent recovery in the housing market.
Headline January 2016 Reporting. Reported by the Census Bureau, yesterday, February 24th, January 2016 New-Home Sales (counted based on contract signings) declined month-to-month by a headline, seasonally-adjusted, statistically-insignificant 9.2% (-9.2%) +/- 15.8% (all confidence intervals are at the 95% level). Although the headline level of December 2015 sales was unrevised, headline monthly growth in December revised lower to 8.2% [previously up by 10.8%]. That followed an upwardly revised gain of 4.8% [previously up by 1.9%, initially up by 4.3%] in November, and a downwardly-revised gain of 5.0% [previously up by 5.5%, up by 6.3%, and initially up by 10.7%] in October.
Year-to-year, January 2016 sales declined by a statistically-insignificant 5.2% (-5.2%) +/- 14.7%. That followed an unrevised December 2015 annual sales gain of 9.9%, an upwardly revised annual gain of 12.0% [previously up 9.4%, initially up by 9.1%] in November 2015 and a downwardly-revised 1.7% annual gain [previously up by 2.1%, down by 0.4% (-0.4%) and initially a gain of 4.9%] in October 2015.
In the arena of continued extreme volatility and unstable, nonsensical headline reporting, consider that the annualized quarterly pace of sales gain in first-quarter 2015 was 43.9%, with the second-quarter 2015 sales activity in an annualized quarterly decline of 14.8% (-14.8%). Third-quarter 2015 new-home sales showed an unrevised annualized contraction of 6.8% (-6.8%), with the fourth-quarter sales gain estimated at 18.4% [previously up by 15.3%], with first-quarter 2016 activity down at an annualized quarterly pace of 11.3% (-11.3%), based solely on January 2016 reporting.
New-Home Sales Graphs. The regular monthly graph of New-Home Sales is included in the Opening Comments section, along with a six-month moving-average version of the series. Added for comparison purposes are parallel graphs of the headline and six-month moving-average versions of January 2016 Housing Starts for single-unit construction, from Commentary No. 786, along with comparative graphs of Existing-Home Sales (see Graphs 7 to 14).
EXISTING-HOME SALES (January 2016)
Unstable Headline Changes Remain in Month-to-Month Existing-Home Sales, Despite Annual Revisions. Discussed in Commentary No. 782, the Existing-Home Sales series is based on actual closings of home sales. Where recent changes in mortgage closing requirements have delayed some closings into the next month, such disrupted recent, monthly existing-home sales counts. With those systemic distortions still in play, to an unknown extent, current headline numbers likely are less stable than usual. At some point, though, the numbers will stabilize. That said, the National Association of Realtors® (NAR) just published its annual revisions to the series, covering the first couple of months of the new mortgage closing circumstance. Along with the caution on potential data instabilities, the accompanying detail and graphs reflect the headline numbers.
In addition, ShadowStats has introduced a new graph of the headline series, smoothed with a six-month moving average. Graph 13 is found in the Opening Comments section, with detail and the description there, as well as at the end of this section.
The annual revisions are plotted in Graph 18. They appear largely to reflect offsetting seasonal adjustments in the benchmark period 2013-to-date.
Graph 18: Existing-Home Sales – Monthly Level – Annual Revisions
Ongoing Lack of Recovery from Collapse into 2009. Existing-Home Sales in January 2016 were down by a headline 24.8% (-24.8%) from the June 2005 pre-recession peak, a high that has not been matched since the collapse. In contrast, the January 2016 headline monthly Housing Starts remained down by 51.6% (-51.6%) versus its January 2006 pre-recession high.
First-quarter 2015 Existing-Home Sales showed a revised annualized quarterly sales contraction of 2.6% (-2.6%) [previously down by 6.7% (-6.7%)], with the second-quarter 2015 pace of annualized growth revising lower to 19.5% [previously up by 28.7%]. Third-quarter 2015 growth also slowed, to a revised annualized pace of 9.7% [previously up by 14.3%], with fourth-quarter 2015 activity contracting at a less-severe annualized pace of 14.2% (-14.2%) [previously down by 20.0% (-20.0%)]. Based just on January, first-quarter 2016 is on track for an annualized gain of 22.4% in this highly-volatile series.
Headline Detail for January 2016 Existing-Home Sales. In the context of annual revisions and likely distortions, the February 23rd release of January 2016 existing-home sales (counted based on actual closings, NAR) showed a seasonally-adjusted, headline monthly gain of 0.4%, following a revised, slower monthly gain of 12.1% [previously up by 14.5%] in December 2015, and a shallower contraction of 8.1% (-8.1%) [previously down by 10.5%] in November.
On a year-to-year basis, January 2016 sales were up by 11.0%, following an unrevised annual gain of 7.5% in December 2015 and a minimally revised annual decline of 3.6% (-3.6%) [previously down by 3.8% (-3.8%)] in November 2015.
These numbers still are moving outside the normal scope of reporting volatility for this series, again, suggestive of some ongoing reporting issues. Separately, the quality of data underlying this series remains highly questionable, as usual. All that said, smoothed for irregular distortions, the reporting remained statistically consistent with a period of low-level broad stagnation, although it has been up-trending, it now is down-trending, as seen in Graph 13 in the Opening Comments.
Proportion of Distressed Sales Increased, Along with All-Cash Sales in January. The NAR estimated the portion of January 2016 sales in “distress” rose for the month to 9% (7% foreclosures, 2% short sales), up from 8% (6% foreclosures, 2% short sales) in December 2015, and against 11% (8% foreclosures, 3% short sales) in January 2015.
Reflecting continued lending problems and stresses within the financial system, including related banking-industry and consumer-solvency issues, as well as the ongoing influx of speculative investment money into the existing-housing market, the NAR estimated that all-cash sales were 26% of January 2016 sales, up from 24% of December 2015 sales and versus 27% in January 2015.
The primary, underlying difficulty for the housing market remains intense, structural-liquidity constraints on the consumer, which continued to prevent a normal recovery in broad U.S. business activity from the economic collapse, as discussed in the Opening Comments.
Existing-Home Sales Graph. Added to the traditional monthly home-sales graphs is a Six-Month Moving Average of Existing-Home Sales (Graph 13), found in the Opening Comments section. Unlike the levels shown Graph 11 of the monthly series, there are no special averages to smooth the effects of government programs to create buyer incentives. The series is smoothed only by a six-month moving average, and a transitional averaging that joins the old and new series otherwise plotted separately as seen in Graph 11.
Along with the monthly graphs of Existing-Home Sales are comparative graphs of January 2016 aggregate Housing Starts activity from Commentary No. 786, where both series reflect activity in terms of single- and multiple-housing units (see Graphs 11 to 14). These plots also are accompanied by comparative graphs of New-Home Sales (see Graphs 7 to 10).
__________
WEEK AHEAD
Economic Reporting Should Continue on the Downside of Expectations, Pummeling the Dollar and Boosting Gold, Silver and Oil Prices. Moving to the downside, amidst intensifying, negative headline reporting, market expectations for business activity are deteriorating, even as reviewed in the popular media. The broad trend in weakening expectations for business activity has continued, and movement towards looming recession recognition has accelerated, as discussed in Commentary No. 783 and in No. 777 Year-End Special Commentary. Nascent negative reaction has surfaced in trading of the U.S. dollar, in related financial markets, with some upside movement recently in prices for gold and silver (see the Hyperinflation Watch, Commentary No. 784 and Commentary No. 785). Circumstances here also should limit further heavy selling in the oil market and begin to turn pricing there to the upside, once the dollar comes under heavy selling pressure.
Weaker headline reporting of the regular monthly economic numbers increasingly should be accompanied by much worse-than-expected—negative—reporting for at least the next several quarters of GDP (and GDI and GNP), for fourth-quarter 2015 and well into 2016. That includes an eventual outright quarterly contraction in revised fourth-quarter 2015 GDP activity, as well as pending downside revisions to recent GDP history in the 2016 annual benchmark revision, due on July 29th.
CPI-U consumer inflation—intermittently driven lower in 2015 by collapsing prices for gasoline and other oil-price related commodities—likely has seen its near-term, year-to-year low. Although month-to-month headline inflation was unchanged for January 2016, annual CPI-U jumped sharply, against year-ago weak inflation, to a 15-month high. Eventually, prices should turn sharply positive, again, pending an environment of a weakening U.S. dollar and a related upturn in otherwise battered oil prices and other commodities. Separately, fundamental reporting issues with the CPI are discussed here: Public Commentary on Inflation Measurement.
Note on Reporting-Quality Issues and Systemic-Reporting Biases. Significant reporting-quality problems remain with most major economic series. Beyond the pre-announced gimmicked changes to reporting methodologies of the last several decades, which have tended to understate actual inflation and to overstate actual economic activity, ongoing headline reporting issues are tied largely to systemic distortions of monthly seasonal adjustments. Data instabilities—induced partially by the still-evolving economic turmoil of the last eight-to-ten years—have been without precedent in the post-World War II era of modern-economic reporting. The severity and ongoing nature of the downturn provide particularly unstable headline economic results, when concurrent seasonal adjustments are used (as with retail sales, durable goods orders, employment and unemployment data). That has been discussed and explored in the labor-numbers related Supplemental Commentary No. 784-A and Commentary No. 695.
Separately, discussed in Commentary No. 778, a heretofore unheard of spate of “processing errors” has surfaced in recent surveys of earnings (Bureau of Labor Statistics) and construction spending (Census Bureau). This is suggestive of deteriorating internal oversight and control of the U.S. government’s headline economic reporting. At the same time, it indicates an openness of the involved statistical agencies in revealing the reporting-quality issues.
Combined with ongoing allegations in the last year or two of Census Bureau falsification of data in its monthly Current Population Survey (the source for the BLS Household Survey), these issues have thrown into question the statistical-significance of the headline month-to-month reporting for many popular economic series (see Commentary No. 669).
PENDING RELEASE:
Gross Domestic Product (GDP)—Fourth-Quarter 2015, Second Estimate, First Revision (GNP and GDI Initial Estimates). The Bureau of Economic Analysis (BEA) will publish its second estimate, first revision of fourth-quarter 2015 Gross Domestic Product (GDP) tomorrow, Friday, February 26th. Discussed in the opening paragraphs of prior Commentary No. 787 Opening Comments, the second estimate of growth should revise lower, from the initial annualized quarterly headline growth rate of 0.69%. Consensus estimates also have moved in that direction.
Fourth-quarter 2015 GDP should be in an outright quarterly contraction in its final form, and that could happen in this first revision, with a second revision due on March 25th. Formal recession recognition (timed from December 2014) likely would follow shortly in the wake of the eventual announcement of a headline contraction in fourth-quarter 2015 GDP.
Recent headline seasonal-adjustment revisions to the CPI and PPI suggest that pending revisions to GDP inflation patterns already would have the fourth-quarter 2015 GDP in headline contraction, but those elements should not come into play until the GDP benchmark revisions of July 29th.
Per advice from the BEA, initial estimates for fourth-quarter 2015 Gross National Product (GNP) and Gross Domestic Income (GDI) also will be published tomorrow. Such breaks a long-standing tradition of publishing those annual and fourth-quarter GDI and GNP estimates along with the third-estimate of fourth-quarter GDP, instead of the second-estimate as has been the common circumstance for the first three quarters of the year. Where GDI is the theoretical income-side equivalent of the consumption-side GDP, and where GNP is the broadest U.S. economic measure (GDP is GNP net of trade flows in interest and dividend payments), those two alternate-GDP measures often provide interesting contrasts to the generally poor-quality and inconsistent headline reporting of the GDP.
__________