August 13th, 2008 Newsletter - Market Perspective
Issue Number 45
August 13, 2008
__________
Section Two
(View all Sections of this Issue)
MARKETS PERSPECTIVE
As shown in the accompanying tables, market movements recently have turned sharply in favor of the U.S. dollar and against oil and gold prices, with bouts of extreme volatility.
|
Closing Financial-Market Indicators as of Second-Quarter 2008
Indicator 2nd-Quarter 2008 1st-Quarter 2008 Year-End 2007
|
|||||||||||||
|
|
Level
|
Qtr/Qtr
|
YTD
|
Yr/Yr
|
Level
|
YTD (Qtr/Qtr)
|
Yr/Yr
|
Level
|
Yr/Yr
|
||||
|
|
|
|
|
|
|
|
|
|
|
||||
|
Equity Market
|
|
|
|
|
|
|
|
|
|
||||
|
DJIA
|
11,350.01
|
-7.44%
|
-14.44%
|
-15.35%
|
12,262.89
|
-7.55%
|
-0.74%
|
13,264.82
|
6.43%
|
||||
|
S&P 500
|
1,280.00
|
-3.23%
|
-12.83%
|
-14.86%
|
1,322.70
|
-9.92%
|
-6.91%
|
1,468.36
|
3.53%
|
||||
|
DJ Wilshire 5000
|
13,073.54
|
-1.94%
|
-11.78%
|
-14.05%
|
13,332.00
|
-10.44%
|
-7.48%
|
14,819.60
|
3.94%
|
||||
|
NASDAQ Comp
|
2,292.98
|
0.69%
|
-13.55%
|
-11.92%
|
2,279.10
|
-14.07%
|
-5.89%
|
2,652.28
|
9.81%
|
||||
|
|
|
|
|
|
|
|
|
|
|
||||
|
Credit Market (1)
|
|
|
|
|
|
|
|
|
|
||||
|
Fed Funds Target
|
2.00%
|
-25bp
|
-225bp
|
-325bp
|
2.25%
|
-200bp
|
-300bp
|
4.25%
|
-100bp
|
||||
|
3-Mo T-Bill
|
1.90%
|
52bp
|
-146bp
|
-292bp
|
1.38%
|
-118bp
|
-366bp
|
3.36%
|
-166bp
|
||||
|
2-Yr T-Note
|
2.63%
|
101bp
|
-42bp
|
-224bp
|
1.62%
|
-143bp
|
-296bp
|
3.05%
|
-177bp
|
||||
|
5-Yr T-Note
|
3.34%
|
88bp
|
-11bp
|
-158bp
|
2.46%
|
-99bp
|
-208bp
|
3.45%
|
-125bp
|
||||
|
10-Yr T-Note
|
3.99%
|
54bp
|
-5bp
|
-104bp
|
3.45%
|
-59bp
|
-120bp
|
4.04%
|
-67bp
|
||||
|
30-Yr T-Bond
|
4.53%
|
23bp
|
8bp
|
-59bp
|
4.30%
|
-15bp
|
-54bp
|
4.45%
|
-36bp
|
||||
|
|
|
|
|
|
|
|
|
|
|
||||
|
Oil(2) US$ per Barrel
|
|||||||||||||
|
West Texas Int.
|
140.00
|
37.81%
|
45.82%
|
98.04%
|
101.59
|
5.81%
|
54.20%
|
96.01
|
57.24%
|
||||
|
|
|
|
|
|
|
|
|
|
|
||||
|
Currencies/Dollar Indices(3) US$/Unit
|
|||||||||||||
|
Pound Sterling
|
1.9906
|
0.26%
|
0.32%
|
-0.58%
|
1.9855
|
0.06%
|
0.72%
|
1.9843
|
1.31%
|
||||
|
Euro
|
1.5748
|
-0.36%
|
7.84%
|
16.48%
|
1.5805
|
8.23%
|
18.18%
|
1.4603
|
10.65%
|
||||
|
Swiss Franc
|
0.9802
|
-2.76%
|
11.05%
|
19.98%
|
1.0080
|
14.20%
|
22.23%
|
0.8827
|
7.64%
|
||||
|
Yen
|
0.0094
|
-5.95%
|
5.22%
|
16.13%
|
0.0100
|
11.88%
|
17.74%
|
0.0090
|
6.54%
|
||||
|
Canadian Dollar
|
0.9818
|
0.88%
|
-2.98%
|
4.41%
|
0.9732
|
-3.83%
|
13.34%
|
1.0120
|
17.92%
|
||||
|
Australian Dollar
|
0.9562
|
4.71%
|
8.96%
|
12.61%
|
0.9132
|
4.06%
|
12.71%
|
0.8776
|
11.31%
|
||||
|
Weighted Currency Units/US$ (Jan. 1985 = 100)
|
|||||||||||||
|
Financial (FWD)
|
44.91
|
0.45%
|
-4.97%
|
-9.34%
|
44.71
|
-5.40%
|
-10.62%
|
47.26
|
-7.64%
|
||||
|
Change US$/FX
|
–
|
-0.45%
|
5.23%
|
10.31%
|
–
|
5.70%
|
11.88%
|
–
|
8.27%
|
||||
|
Trade (TWD)
|
51.06
|
0.93%
|
-3.15%
|
-9.79%
|
50.59
|
-4.04%
|
-12.70%
|
52.72
|
-10.00%
|
||||
|
Change US$/FX
|
–
|
-0.92%
|
3.25%
|
10.85%
|
–
|
4.21%
|
14.55%
|
–
|
10.01%
|
||||
|
|
|
|
|
|
|
|
|
|
|
||||
|
Precious Metals(4) US$ per Troy Ounce
|
|||||||||||||
|
Gold
|
930.25
|
-0.35%
|
11.57%
|
43.01%
|
933.50
|
11.96%
|
38.97%
|
833.75
|
31.92%
|
||||
|
Silver
|
17.65
|
-1.89%
|
19.58%
|
40.75%
|
17.99
|
21.88%
|
34.76%
|
14.76
|
14.41%
|
||||
|
|
|
|
|
|
|
|
|
|
|
||||
|
bp: Basis point or 0.01%. (1) Treasuries are constant maturity yield, U.S. Treasury. (2) Department of Energy. (3) Shadow Government Statistics, FRB (see Dollar Index Section for definitions). (4) London afternoon fix, Kitco.com.
|
|||||||||||||
_________
This pattern should prove to be short-lived, given the general deterioration that continues in the underlying factors driving the equities and the U.S. dollar, and the strengthening fundamentals driving the precious metals. The newsletter is being put to bed with Friday’s (August 8th) closing prices. As we go to press on Wednesday, though, stocks and gold are somewhat weaker and the dollar is somewhat stronger than indicated in the accompanying table.
|
Closing Financial-Market Indicators of August 8, 2008
|
||||
|
|
|
|
|
|
|
Indicator
|
3rd-Quarter-to-Date 2008
|
|||
|
|
Level
|
QTD
|
YTD
|
Yr/Yr
|
|
|
|
|
|
|
|
Equity Market
|
|
|
|
|
|
DJIA
|
11,734.32
|
3.39%
|
-11.54%
|
-14.08%
|
|
S&P 500
|
1,296.32
|
1.28%
|
-11.72%
|
-13.43%
|
|
DJ Wilshire 5000
|
13,197.13
|
0.95%
|
-11.78%
|
-10.95%
|
|
NASDAQ Comp
|
2,414.10
|
5.28%
|
-8,98%
|
-7.61%
|
|
|
|
|
|
|
|
Credit Market (1)
|
||||
|
Fed Funds Target
|
2.00%
|
0bp
|
-225bp
|
-325bp
|
|
3-Mo T-Bill
|
1.70%
|
-20bp
|
-166bp
|
-325bp
|
|
2-Yr T-Note
|
2.51%
|
-12bp
|
-54bp
|
-213bp
|
|
5-Yr T-Note
|
3.21%
|
-3bp
|
-14bp
|
-148bp
|
|
10-Yr T-Note
|
3.94%
|
-5bp
|
-10bp
|
-90bp
|
|
30-Yr T-Bond
|
4.55%
|
2bp
|
10bp
|
-46bp
|
|
|
|
|
|
|
|
Oil (2) per Barrel
|
|
|
|
|
|
West Texas Int.
|
115.20
|
-17.71%
|
19.99%
|
59.60%
|
|
|
|
|
|
|
|
Currencies/Dollar Indices (3) US$/Unit
|
||||
|
Pound Sterling
|
1.9193
|
-3.58%
|
-3.28%
|
-5.77%
|
|
Euro
|
1.5047
|
-4.45%
|
3.04%
|
8.97%
|
|
Swiss Franc
|
0.9258
|
-5.55%
|
4.88%
|
10.06%
|
|
Yen
|
0.0091
|
-3.56%
|
-3.56%
|
8.78%
|
|
Canadian Dollar
|
0.9366
|
-4.60%
|
-7.45%
|
-1.69%
|
|
Australian Dollar
|
0.8915
|
-6.77%
|
4.34%
|
1.58%
|
|
Weighted Currency Units/US$ (Jan. 1985 = 100)
|
||||
|
Financial (FWD)
|
47.05
|
4.77%
|
-0.44%
|
-3.05%
|
|
Change US$/FX
|
–
|
-4.55%
|
0.45%
|
3.15%
|
|
Trade (TWD)
|
53.37
|
4.92%
|
1.23%
|
-3.84%
|
|
Change US$/FX
|
–
|
-4.33%
|
-1.22%
|
3.99%
|
|
|
|
|
|
|
|
Precious Metals (4) US$ per Troy Ounce
|
||||
|
Gold
|
852.50
|
-8.39%
|
2.25%
|
26.20%
|
|
Silver
|
15.76
|
-10.71%
|
6.85%
|
20.95%
|
|
|
|
|
|
|
|
bp: Basis point or 0.01%. (1) Treasuries are constant maturity yield, U.S. Treasury. (2) Department of Energy. (3) Shadow Government Statistics, FRB (see Dollar Index Section for definitions). (4) London afternoon fix, Kitco.com.
|
||||
|
|
|
|
|
|
The various markets are as dangerous and unstable as I can remember, with minor surprises purportedly triggering heavy price movements in everything from oil to stocks. With plenty of "surprises" in the works (most of them negative for equities and the U.S. dollar), near-term activity is unusually dangerous to try to predict, but I would hazard a guess that bulk of dollar buying and oil and gold selling has passed. That said, extreme volatility in those markets easily can continue for while.
The "surprises" lie in upcoming economic reporting and breaking news that will tend to confirm the nature of the intensifying inflationary recession and the still-unfolding systemic liquidity and banking-solvency crises.
Irrespective of ongoing market volatility in the days and weeks ahead, what is discussed below is based on the underlying fundamentals and from a longer term perspective. The markets eventually tend to catch up with the fundamentals.
At such time as the markets reclaim some sanity, I would expect to see: intense selling of the U.S. dollar, with the greenback hitting new historic lows; heavy buying of oil and gold, with eventual new highs to be made (gold is the best bet there); heavy selling of equities that will make the unfolding bear market one of the worst in history. With fiscal conditions deteriorating rapidly, intense dollar selling will help to boost long-term Treasury yields, particularly as foreign investors move to dump their dollar-denominated holdings.
U.S. Equities — With the markets highly vulnerable and irrational, I look only to reemphasize the underlying fundamentals. A severe and protracted inflationary recession is not good for equities, despite any inflation play. Slowing business activity and higher costs (particularly where a company is slow to raise its prices) should hit earnings. Heavy dollar selling eventually should drain liquidity from the equity and credit markets, hitting both stock and bond prices. Higher market interest rates — irrespective of likely near-term rate inaction by the Fed — generally act as an inhibitor to stock market exuberance.
General background note: I still contend that stocks already have turned down into what will prove to be a particularly protracted and savage bear market (see the Hyperinflation Special Report). As equities catch-up with the underlying economic, financial and systemic fundamentals, the downside adjustments to stock prices should be quite large over some years, eventually rivaling the 90% decline in equities seen in the 1929 crash and ensuing four years. The decline might have to be measured in real terms, as a hyperinflation eventually will kick in, with the Fed moving to liquefy the system and monetize federal debt. Stocks do tend to follow inflation, since revenues and earnings get denominated in inflated dollars. Hence with a hyperinflation, a DJIA of 100,000 or 100,000,000 could be expected, but such still would be well below today’s levels, adjusted for inflation.
U.S. Credit Market — The Fed keeps jawboning the dollar with various officials suggesting the interest rates may have to move higher, but the Fed’s primary mission and concern at the moment is maintaining systemic solvency and liquidity. All other issues, including defense of the U.S. dollar, fighting inflation and stimulating the economy, are secondary, unless panicked selling of the U.S. currency threatens to collapse systemic liquidity, and that is real possibility. In a true dollar panic, the Fed may well be pushing rates significantly higher in an effort to provide some fundamental defense of the dollar.
At present, however, the forced investment in U.S. Treasuries of unwanted dollars held outside the United States continues to keep Treasury yields artificially low. The entire yield curve now is negative in real (inflation-adjusted) terms, a circumstance that tends to increase money velocity and overall inflation pressures.
Market yields for U.S. Treasuries, nonetheless, still should be facing upside pressures, shy of short-lived flights to safety, thanks to rapidly deteriorating federal fiscal conditions (meaning significant new Treasury issuance), rapidly mounting inflationary pressures, rapid money growth and a soon-to-be-seen flight from the dollar that evolves into a flight-to-safety outside the dollar. The longer range outlook continues for long-term Treasury yields to back up by several hundred basis points, approaching a more-normal spread in long-term Treasuries over inflation. With a normal spread and annual inflation at 5.0%, the yield on the 30-year Treasury bond should be over 8.0%, not around the current 4.5%.
U.S. Dollar — As discussed in the Opening Comments, aside from some traditional flight-to-safety in the greenback due to uncertainties surrounding the Caucasus war, none of the underlying fundamentals have shifted in support of the dollar. At work have been central bank jawboning and spinmeistering, and likely significant, covert, central-bank intervention in support of the dollar.
With all of the preceding factors being short-lived, by nature, the long-term outlook for the dollar remains for a massive sell-off, with flight from the dollar eventually evolving into a flight to safety outside the dollar. Contrary to market hype, the underlying fundamentals — those factors that determine the long range outlook for the greenback — still remain abysmal and are deteriorating.
The U.S. dollar’s portfolio of underlying fundamentals could not be worse. Relative to major trading partners, the U.S. economy is much weaker; interest rates are lower and anticipated possibly to go lower still on a relative basis (i.e., foreign rates rising); inflation is higher; rising federal deficit and relative trade-balance conditions are horrendous; and relative political/systemic concerns are high, with the President’s and Congress’s approval ratings bottom-bouncing at all-time lows. Neither presumptive presidential candidate (pocketbook issues favor a win for the Democrats) has any prospects of turning the economy.
General background note: Beyond renewed capitulation by the Federal Reserve to the solvency/funding crisis, the proximal trigger for a full dollar panic could come from a bad economic statistic, political missteps by the Administration, negative trade or market developments outside the United States, or a terrorist attack or expansion of U.S. military activity in the Middle-East or South America. When the trigger is pulled, what likely will be broad selling pressure will turn to an outright panicked dumping of the greenback, which should overwhelm any short-lived central bank intervention and roil the domestic financial markets. Generally, the greater the magnitude of the dollar selling, the greater will be the ultimate inflation pressure and liquidity squeeze in the U.S. capital markets, on top of an otherwise deteriorating systemic crisis.
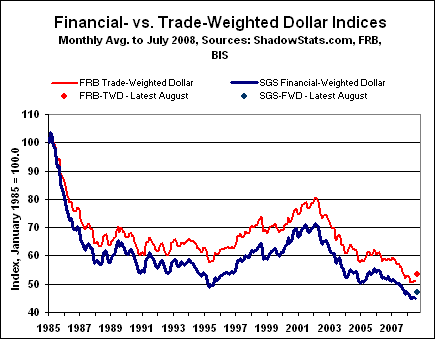
As shown in the accompanying graph, the U.S. dollar notched lower in July versus June, but it has rallied strongly since, particularly in the last week or two. The latest data points shown for the financial- and trade-weighted indices are as of Friday, August 8th.

General background note: Historical data on both dollar series are available for download on the Alternate Data page of www.shadowstats.com. See the July 2005 SGS Newsletter for methodology.
U.S. Dollar Indices. The Shadow Government Statistics’ Financial-Weighted U.S. Dollar Index (FWD) is based on dollar exchange rates weighted for respective global currency trading volumes. For July 2008 the monthly FWD fell by 0.90%, after gaining 0.45% in June. The July 2008 average index level of 44.92 (base month of January 1985 = 100.00) was down by 8.80% from July 2007, while June 2008 was down 9.84% from the year before. As of August 8th, the FWD had rebounded to 47.05.
Also falling in July was the Federal Reserve’s Major Currency Trade-Weighted U.S. Dollar Index (TWD). The July 2008 average declined by 0.70% from June, which, in turn, was up by 0.95% from May. The July 2008 index level of 51.03 (base month of January 1985 = 100.00) was down 8.50% year-to-year, versus a 9.51% annual decline in June. As of August 8th, the TWD closed at 53.37.
Gold and Silver — Like the buying in the U.S. dollar, the heavy selling pressure on precious metals and the extreme volatility in gold and silver prices have been driven by extraordinary jawboning and market spin, along with likely covert central-bank intervention that was used, minimally, to help turn the market back at the time of the Bear Stearns crisis. The gimmicks have been coordinated with, and heavily overlap, the machinations related to dollar and oil price manipulations. Other than some legitimate, short-term profit taking, the underlying fundamentals for gold silver remain strong, and even have increased in strength in the last several months, as both the systemic crisis and inflationary pressures have intensified.
From its record-high London afternoon fix of $1,011.25 per troy ounce on March 17, 2008, gold closed below $820, yesterday (August 12th). Despite all the market gimmicks, in terms of annual perspective, gold still is up sharply from the year before, while the major equity indices are down over the same period. The long-term outlook for gold remains extremely bullish, with recovery to $1,000-plus levels and higher likely sooner, rather than later, given the continuing, extraordinary strength of the underlying fundamentals (inflation, monetary and fiscal policy, political instabilities).
For July (based on Kitco.com), the monthly average London gold afternoon fix was $939.77 per troy ounce, versus $889.49 in June. Silver averaged $18.03 per troy ounce in July, up from $16.97 in June. Respective closing prices on August 8th were $852.50 and $15.76 per troy ounce.
Inflation-Adjusted Historic Gold and Silver Highs. Outside of the current period’s March 17th high of $1,011.25, the earlier all-time high of $850.00 (London afternoon fix, per kitco.com) of January 21, 1980 still has not been hit in terms of inflation-adjusted dollars. Based on inflation through June 2008, the 1980 gold price peak would be $2,390 per troy ounce, based on not-seasonally-adjusted-CPI-adjusted dollars, and would be $6,690 per troy ounce in terms of SGS-Alternate-CPI-adjusted dollars.
In like manner, the all-time high price for silver in January 1980 of $49.45 (London afternoon fix, per silver institute.org) has not been hit since, including in terms of inflation-adjusted dollars. Based on inflation through June 2008, the 1980 silver price peak would be $139 per troy ounce, based on not-seasonally-adjusted=CPI-adjusted dollars, and would be $389 per troy ounce in terms of SGS-Alternate-CPI-adjusted dollars.
General background note: Near-term gold price volatility likely will continue and could be significant. Upside price pressures from mounting inflation, a weakening dollar and increasing global political, financial and systemic instabilities, face offsets with bouts of profit taking and with intensified overt and covert central bank interventions in the gold and currency markets, aimed at propping the greenback. Despite any central-bank machinations or intervention, the upside potential for the precious metals remains explosive.
General background note: As discussed in the Hyperinflation Special Report (April 2008), the eventual collapse of the U.S. dollar — the world’s reserve currency — will force the creation of a new international currency system. Gold likely will be structured into any replacement system, in an effort by those organizing the new currency structure to gain public acceptance.
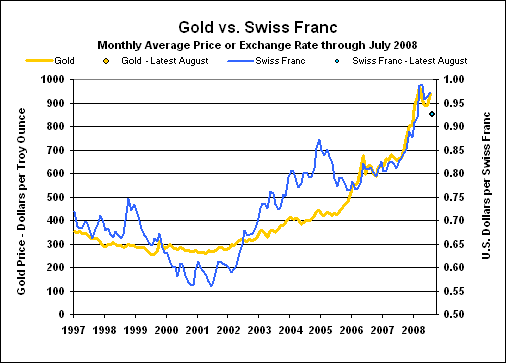
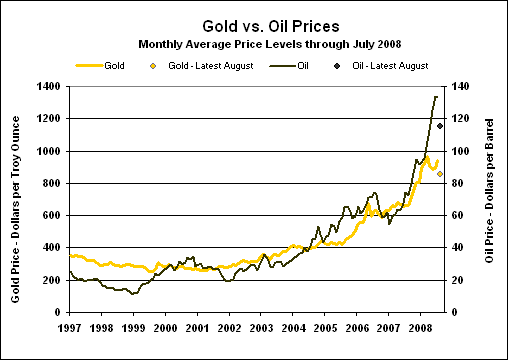
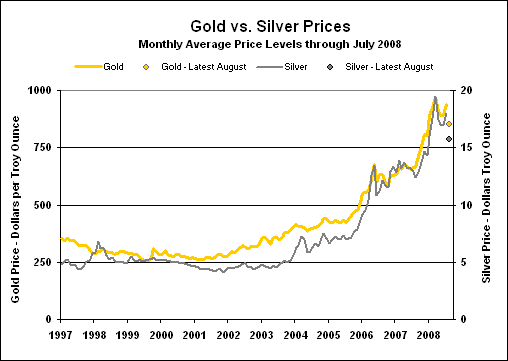
The updated gold versus oil and Swiss franc graphs and the new gold versus silver graph show the July monthly average price levels, as well as added points for closing prices on August 8th, with gold at $852.50, silver at $15.76, oil at $115.20 and the Fed’s published noon buying rate for the Swiss franc at $0.9258. All four measures should trade significantly higher in the months ahead, eventually breaking highs seen otherwise during the last six months.


PLEASE NOTE: The next SGS Newsletter currently is targeted for the week of September 8th, following the release of the August employment report on September 5th. Intervening Flash Updates and Alerts will be posted in response to key economic or financial-market developments.
Earlier editions of the SGS writings referenced in the text can be found on the Archives tab at www.shadowstats.com.
Occasionally, important, brief updates are communicated directly by e-mail. If you are not receiving e-mail communications from us, please let us know at johnwilliams@shadowstats.com or by using the "Contact Us" option on www.shadowstats.com.