August 13th, 2008 - Overview
Issue Number 45
August 13, 2008
__________
Dollar Rally Should Prove Short-Lived — Underlying Fundamentals Deteriorating
Extraordinarily High Systemic Risks — Depositors Moving to Cash?
U.S. Treasuries at Risk of Downgrade?
Economic Activity Tumbles as Inflation Intensifies
GDP Revisions Suggest Shadow of Protracted Recession
__________
Section One
(View all Sections of this Issue)
The Best of Times or the Worst of Times?
Despite orchestrated media and market hype to the contrary, there has been absolutely no positive shift in underlying fundamentals driving the still-unfolding economic, financial-market and systemic-stability crises. The U.S. dollar’s recent sharp gains reflect instead uncertainties tied to the outbreak of war in the Caucasus, with the greenback taking on a traditional flight-to-safety role. The dollar’s strength also reflects some spinmeistering and jawboning by central banks, along with possible, if not probable, supportive covert intervention. Not reflecting any change in real-world conditions, the dollar’s happy gains should prove to be fleeting. Related heavy selling of oil and gold, also have not been driven by fundamental changes. Oil markets are volatile by nature and, despite recent sharp swings, prices remain highly inflationary at current levels. The markets and financial system remain vulnerable to the least surprise and are highly unstable. The inflationary recession continues to intensify, and gold remains the best long-term hedge against all the real risks facing investors and the system.
U.S Dollar Fundamentals Remain Horrible. (The following section is excerpted from or expands upon recent Congressional Testimony.) The relative value of a nation’s currency is a measure not only of its trade position, but also of global capital flows that mirror how the rest of the world views that nation’s economic strength, financial-system integrity and political stability.
In terms of underlying fundamentals that drive, or act as surrogates for concerns that drive relative currency values, the U.S. dollar’s portfolio could not be much worse. Not one of the fundamentals has shifted recently in favor of the dollar, despite spinmeistering and jawboning efforts to the contrary. Against major trading partners, consider the United States’ relative positions:
· Trade Balance (Negative): Despite recently reported narrowing of the monthly trade deficit, the U.S. trade shortfall remains unprecedented in its relative global magnitude.
· Economic Activity (Negative): U.S. business conditions are deteriorating, with the economy clearly in a recession in all but formal declaration of same. Even against contracting economies abroad, the current U.S. economy is relatively weaker.
· Inflation (Negative): U.S. inflation has risen sharply, with the CPI-U up 5.0% year-to-year as of June; broad money growth is highest since 1971; double-digit inflation is possible by early 2009.
· Fiscal Discipline (Negative): The U.S. federal budget deficit is deteriorating rapidly, due to the recession, with its unfunded obligations placing the government in a state of practical long-term bankruptcy.
· Interest Rates (Negative): U.S. interest rates are low, relative to the rest of the world, with Federal Reserve policy perceived to be on hold per current market expectations.
· Political/Systemic Stability (Negative): The President’s approval rating (currently low) is a fair indicator of currency trends; the banking crisis is an increasing negative.
Marketing the Rigged Good News. If one believed the orchestrated financial media, the U.S. dollar has turned fundamentally to the upside, because the U.S. economy has dodged a recession as the rest of the global economy seems to be falling into one. Hence, the argument goes, the U.S. economy is the place to park your money. Such is absurdly nonsensical and shows some of the dangers inherent in relying on poor-quality, politically-manipulated GDP statistics.
In reality, the U.S. economy is tumbling in a deep recession. Given the dominant size of the U.S. economy and related global consumption, U.S. recessions usually trigger global recessions. What is missing from the gimmicked conventional wisdom is that the U.S. economy is contracting more rapidly than as seen in downturns in the rest of the world.
Central Bankers and Finance Ministers Lie. Back three or four decades — in the era of fixed exchange rates — one could be sure a currency revaluation was pending, whenever a central bank began denying same. Such is the nature of crisis management by central bankers and finance ministers; they have to deny market moving events until the last moment or until they are ready to act.
Something of a reverse gambit is in play at present, where Federal Reserve officials keep hinting at a needed increase in interest rates, but no rate increase follows. Jean-Claude Trichet, president of the European Central Bank (ECB) recently warned of economic weakness in the eurozone, implying a rate cut, but such followed an action where rates were held constant. If the Fed raised rates and/or the ECB lowered rates, such a fundamental shift would bolster the dollar. Neither central bank, however, is looking to change policy as hinted, so the comments drifted into the realm of jawboning, and the spin doctors in the financial markets wove stories supportive of the greenback. Impact from same was not fundamental, only fleeting fluff.
There recently was a comment out of the U.S. Treasury, however, that had a strong enough odor about it to bring back memories of the currency revaluation days.
Federal Deficit Explosion and a U.S. Treasuries Downgrade? Per a July 31st Associated Press article by Martin Crutsinger (Administration: US bond rating safe despite deficit), "The Bush administration expressed confidence Wednesday that the United States would be able to maintain its top-notch credit rating even as the government scrambles to find new ways of expanding debt sales to cope with soaring budget deficits."
Competent Treasury officials never would discuss such a topic, unless it was felt that some market reassurance was needed and that indeed there was some threat of a downgrade. Something may be afoot in terms of rating U.S. Treasuries from a perspective outside the U.S. dollar. Usually there would be no impaired sovereign rating from the perspective of its domestic currency, since the country in question always has the ability to print money in order to meet its obligations, as advocated by Mr. Bernanke.
The comments followed revised budget deficit estimates that suggest a 2008 shortfall in excess of $400 billion and a 2009 shortfall in excess of $500, if war funding were counted fully. Such also followed the Congress raising the federal debt limit to $10.5 trillion, allowing for the next trillion dollars of debt to be taken on from current levels.
The recession and systemic banking solvency crisis (FDIC expenses) have been spiking federal spending and reducing tax revenues. None of this is good fundamental news for the U.S. dollar.
Ongoing Banking Crisis and Monetary Abnormalities. One question raised by several subscribers in terms of the August 3rd Money Supply Special Report was that if Fed Chairman Bernanke can dodge deflation as claimed, by creating new money and debasing the currency, then why did Japan not follow similar polices in order to avoid its deflation?
Ben Bernanke’s explanation of Japan’s circumstance, in his 2002 speech on avoiding deflation, is in line with mine, specifically that Japan did not want to debase its currency (much as Germany does not want to see the euro debased at present). It was a policy option, not a physical limitation on the government’s ability to create money and inflation. One cannot necessarily impute the long-term willingness of the U.S. to debase its currency system to more fiscally conservative sovereign states.
Along those lines, as seen in the accompanying graphs, the still-unfolding systemic banking solvency crisis has not been getting better. If anything, indications from recent money supply reporting suggest the crisis may be in a stage of renewed deterioration. Shown in the first two graphs, Federal Reserve lending to banks is holding at record levels, and the Fed just recently liberalized its lending policies, again. The third graph shows the level of U.S. Treasuries being held by Federal Reserve banks. The decline in


Treasuries has been offset by holdings of illiquid securitized instruments that are being used as collateral by banks borrowing from the Fed. The problem remains that those assets (declining Treasuries and increasing, illiquid securitized instruments) remain the formal backing for the U.S. currency issued as Federal Reserve Notes.
The cost to the system of a full bailout is surging money growth and higher inflation. As discussed in the money supply section, however, annual growth in M3 is slowing some, albeit still at very high levels, while annual growth in the narrow M1 measure (basically currency and checking accounts) has been surging. Funds appear to be shifting from the large-deposit accounts to cash, suggesting mounting depositor nervousness and a possible trigger for a new round of systemic liquidity creation by the Fed.
There is no good fundamental news here for the U.S. dollar.
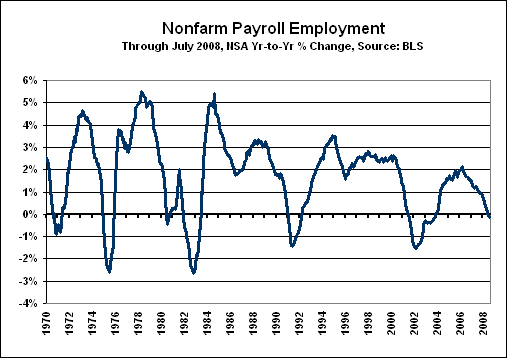
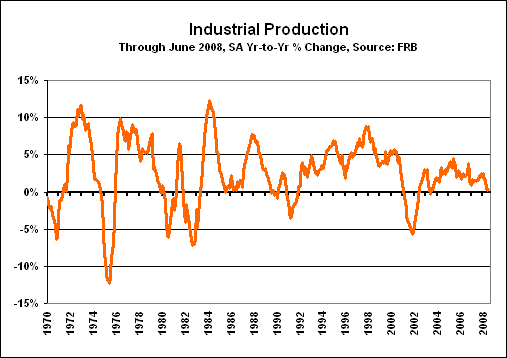
Except for GDP, Broad Economic Reporting Shows the U.S. Economy in Recession. With the exception of GDP, and possibly its underlying trade deficit support, every economic indicator discussed in the Reporting Perspective is showing a recession in place, with further deterioration signaled by the better leading indicators through the balance of 2008.
As discussed in the Reporting/Market Focus, even the GDP annual revisions started to move into a pattern that allows for a recession having begun sometime in fourth-quarter 2006.
Shown in the following graphs are three of the broader, more important series that never have shown the displayed current annual growth patterns outside of recession.


Quarterly contractions (often multiple, consecutive ones) and annual contractions now seen in real "inflation-adjusted" retail sales, nonfarm payrolls, industrial production, housing starts and new orders for durable goods generally are not seen outside of formal recessions.
The current recession eventually should be recognized as the second downleg of a structural recession that began back in 2000. Its formal recognition, however, likely will not be announced by the National Bureau of Economic Research (NBER), official arbiter of same, until sometime after the November election.
As discussed in the April 8th Hyperinflation Special Report, the current inflationary recession eventually should evolve into an inflationary depression and then into a hyperinflationary great depression.
There remains no positive fundamental news for the U.S. dollar here.
Inflation Intensification Belies Benign "Core" Estimates. Annual CPI and PPI inflation rates jumped sharply in June and should be higher again in July. With annual June CPI at a 17-year high of 5.0%, however, a serious question has to be raised about so-called "core" inflation that is net of changes in food and energy prices. While the latest data show some catch-up of accounting for energy inflation in the aggregate CPI, nothing has been catching up in the core numbers.
Core inflation has not been increasing, despite a couple of years of rising oil prices that gradually have permeated the broad economic system. Even with formal energy costs removed from the accounting, inflation impact should be seen in goods and services that consume energy, get transported or involve petroleum based materials ranging from a variety of chemicals and plastics to pharmaceuticals and fertilizers. With the core numbers used for ulterior motives of the Federal Reserve (proof of contained inflation), the lack of increase in core inflation not only is unbelievable, it also reeks of official massaging and gimmicking. This area will be explored further in an upcoming Reporting/Market Focus.
In any event, there is no positive fundamental news for the U.S. dollar here.
Volatile and Unstable Markets. As discussed in the Markets Perspective, the broad outlook is unchanged for eventual sharp sell-offs in U.S. equities and the U.S. dollar, eventual sharp rallies in gold and silver, and eventual spikes in long-term interest rates. At present, the financial markets are extremely volatile and sensitive, and much of recent trading activity has not been rationale, rather egged on by manipulative central banks or by Wall Street spinning poor-quality economic data out of the government.
Given the intensifying inflationary recession and the ongoing banking solvency crisis, there is no likely long-term happy result on the horizon for the U.S. equity and credit markets, or for the U.S. dollar. Gold and silver, however, should see eventual new long-term gains from the same factors that will pummel the other markets.
In terms of annual perspective, despite all the market gimmicks and machinations and heavy selling of gold, gold still is up sharply from the year before, while the major equity indices still are down over the same period.
PLEASE NOTE: A "General background note" provides a broad background paragraph on certain series or concepts. Where the language used in past and subsequent newsletters usually has been or will be identical, month-after-month, any text changes in these sections will be highlighted in bold italics upon first usage. This is designed so that regular readers may avoid re-reading material they have seen before, but where they will have the material available for reference, if so desired.
Alternate Realities. This section updates the Shadow Government Statistics (SGS) alternate measures of official GDP, unemployment and CPI reporting. When a government economic measure does not match common public experience, it has little use outside of academia or the spin-doctoring rooms of the Federal Reserve, White House and Wall Street. In these alternate measures, the effects of gimmicked methodological changes have been removed from the official series so as to reflect more accurately the common public experience, as embodied by the pre-Reagan-Era CPI and GDP and the pre-Clinton Era unemployment rate. Methodologies for the GDP and CPI series are discussed in the August 2006 SGS.
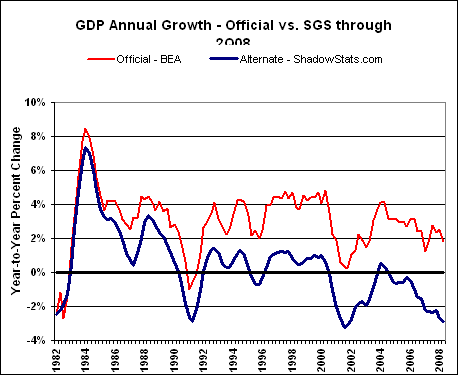
GDP. The alternate second-quarter 2008 GDP growth reflects the "advance" estimate, with many of the methodological gimmicks of recent decades removed. The alternate second-quarter inflation-adjusted annual growth rate (year-to-year, as opposed to the popularly-touted annualized quarter-to-quarter rate) for GDP was a decline of roughly 2.9% versus the official year-to-year gain of 1.8%. The official annualized real growth rate for the quarter was 1.9%. While the quarterly growth number is popularly followed, its significant inaccuracies are expanded to the fourth-power in reporting. The alternate measure, once again, safely would have shown a quarterly contraction. The graph and data postings have been updated for the July 31, 2008 annual revisions to GDP.
General background note: Historical data on both the official and SGS-Alternate GDP series are available for download on the Alternate Data page of www.shadowstats.com. The Alternate GDP numbers tend to show deeper and more protracted recessions than have been reported formally or reflected in related official reporting. Nonetheless, the patterns shown in the alternate data are broadly consistent with the payroll employment and industrial production series, which are major indicators used by the National Bureau of Economic Research in determining the official timing of U.S. business cycles.

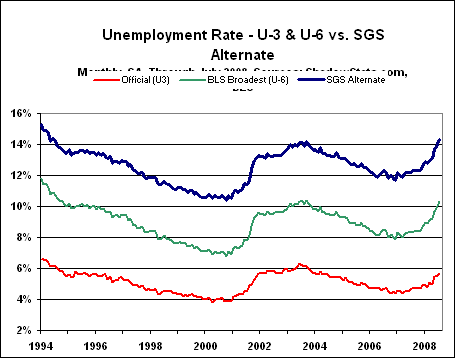
Unemployment Rate. Shown are two official seasonally-adjusted unemployment measures, U.3 and U.6, and the SGS-Alternate Unemployment Measure. All three measures moved sharply higher, again, in July, in response to rapidly deteriorating labor-market conditions, standing respectively at 5.7%, 10.3% and 14.3%, up from 5.5%, 9.9% and 13.9% in June.
General background note: U.3 is the popularly followed unemployment rate published by the Bureau of Labor Statistics (BLS), while U.6 is the broadest unemployment measure published by the BLS. U.6 is defined as total unemployed, plus all marginally attached workers, plus total employed part time for economic reasons, as a percent of the civilian labor force plus all marginally attached workers. Marginally attached workers include the discouraged workers who survived redefinition during the Clinton Administration. The SGS-Alternate Unemployment Measure simply is U.6 adjusted for an estimate of the millions of discouraged workers defined away during the Clinton Administration — those who had been "discouraged" for more than one year.
General background note: Historical data on both the official and SGS-Alternate unemployment series are available for download on the Alternate Data page of www.shadowstats.com. The Alternate numbers are reported from the 1994 series redefinitions forward. It is planned to take the alternate series further back in time.

CPI. July’s annual non-core inflation rates spiked, while core inflation was little changed. The PCE measures were revised upwards as part of the annual revisions to the national income accounts. Annual inflation rates should continue rising well into 2009, with mounting inflationary pressures reflecting the increasing impact of energy-cost damages to the general economy, combined with pressures from a weakened dollar and extremely high monetary growth.
Outright data manipulation appears to be an ongoing issue. Recent food and oil-related price pressures still have been reflected only minimally in current reporting, and that increasingly has caused some in the financial media to question the accuracy of official inflation reporting. The effect is particularly noticeable in the lack of pass-through energy inflation to the so-called "core" numbers.
General background note: Historical data on both the official and SGS-Alternate CPI series are available for download on the Alternate Data page of www.shadowstats.com. The Alternate CPI numbers tend to show significantly higher inflation over time, generally reflecting the reversal of hedonic adjustments, geometric weighting and the use of a more traditional approach to measuring housing costs, measures all consistent with the reporting methodology in place as of 1980. Available as a separate tab at the SGS homepage www.shadowstats.com is the SGS Inflation Calculator that calculates the impact of inflation between any two months, 1913 to date, based on both the official CPI-U and the SGS-Alternate CPI series.

|
Eight Levels of Consumer Inflation
Annual Inflation for March to June 2008 |
|||||
|
|
|
2008
|
|
|
|
|
Measure
|
Mar
|
Apr
|
May
|
Jun
|
|
|
I.1
|
Core PCE Deflator (r)
|
2.2%
|
2.2%
|
2.2%
|
2.3%
|
|
I.2
|
Core Chained-CPI-U
|
2.1%
|
2.0%
|
2.0%
|
2.1%
|
|
I.3
|
Core CPI-U
|
2.4%
|
2.3%
|
2.3%
|
2.4%
|
|
I.4
|
PCE Deflator (r)
|
3.4%
|
3.4%
|
3.5%
|
4.1%
|
|
I.5
|
Chained-CPI-U
|
3.6%
|
3.5%
|
3.6%
|
4.2%
|
|
I.6
|
CPI-U
|
4.0%
|
3.9%
|
4.2%
|
5.0%
|
|
I.7
|
Pre-Clinton CPI-U
|
7.3%
|
7.3%
|
7.5%
|
8.3%
|
|
I.8
|
SGS Alternate Consumer Inflation
|
11.6%
|
11.5%
|
11.8%
|
12.6%
|
|
(r) Revised, including annual revisions published August 4, 2008.
Notes: I.1 to I.3 reflect the core inflation rates, respectively, of the substitution-based personal consumption expenditure (PCE) deflator, the Chained-CPI-U and the geometrically-weighted CPI-U. I.4 to I.6 are the same measures with energy and food inflation included. The CPI-U (I.6) is the measure popularly followed by the financial press, when the media are not hyping core inflation. I.7 is the CPI-U with the effects of geometric weighting (Pre-Clinton Era as estimated by SGS) reversed. This is the top series in the CPI graph on the SGS home page www.shadowstats.com. I.8 reflects the SGS Alternate Consumer Inflation measure, which reverses the methodological gimmicks of the last 25 years or so, plus an adjustment for the portion of Clinton-Era geometric weighting that is not otherwise accounted for in BLS historic bookkeeping. |
|||||
_____________________________________