Issue Number 46: Overview
Section One
(View all Sections of this Issue)
OVERVIEW — OPENING COMMENTS
The Financial Tempest Makes Landfall
Watch Out for the Dollar!
In terms of magnitude, global scope and the underlying complexity and interdependencies of troubled financial instruments, the systemic solvency upheaval roiling the U.S. and global financial markets is without precedence. The crisis is the natural outcome of decades of financial leverage being built upon financial leverage; from decades of income variance being pushed even beyond that which preceded the 1929 financial panic, and the panics and Great Depression of the 1930s (see this issue’s Reporting/Market Focus); and from decades of enabling policies and a willful lack of oversight by the U.S. Federal Reserve and the federal government, which pandered to the needs of Wall Street and to an electorate increasingly addicted to instant gratification.
As this is being written on Sunday afternoon, a $700 billion "bailout" package purportedly has been agreed upon by the White House and Congress (any needed updates on the general outlook will be advised by an Alert). What can and will be bailed out at any and all costs by Treasury Secretary Paulson and Federal Reserve Chairman Bernanke — though not necessarily by the current bailout package — is an ongoing and functional banking and financial system. The cost of such remains much higher inflation. What cannot be prevented by any bailout are major long-term declines in the U.S. dollar and U.S. equity markets. Further, a major, debilitating recession cannot be prevented, since one already has been underway for some time. Preventing a collapse of the banking system, however, prevents an initial deflationary great depression, but such sets up the ultimate financial crisis of a U.S. hyperinflationary great depression, which still looms (see the Hyperinflation Special Report of April 8, 2008) and may have moved a little closer in time.
The troubled financial markets of recent weeks likely should continue, irrespective of any near-term happy market movements resulting from the "bailout," assuming it solidifies as promised. The financial markets remain at extreme risk. Market instabilities likely will continue amidst the cross-currents of investors looking to protect their wealth and assets, extreme market hypes and rumors, pressures from intensifying flight from the U.S. dollar, liquidations of troubled investment portfolios, and ongoing intervention and manipulation in the markets by the President’s Working Group on the Markets (Plunge Protection Team) and its global counterparts.
The broad outlook is unchanged, with still-intensifying crises in systemic solvency and in a deepening inflationary recession. Over the long-term: U.S. equities will continue to suffer in a severe bear market; long-term U.S. Treasury yields will spike in response to inflation, eventual dollar dumping and mounting Treasury borrowing needs against a market with weakening demand; selling will intensify against the U.S. dollar, evolving into dollar dumping and dumping of dollar denominated assets; precious metals, particularly gold, will rally against mounting monetary and inflation pressures (likely higher oil prices), weakness in the dollar, and as safe-havens against increasing systemic instability. Holding gold and holding assets outside the U.S. dollar (such as in Swiss francs) remain the best long-range hedge against all the real risks facing investors and the system.
Fed and Treasury Actions, Bailout, All Promise Higher Broad Money Growth and Inflation. If the U.S. Treasury creates new money with the Fed, with proceeds loaned directly to formerly-private industry, as happened last week, such generates money supply growth. When the Fed floods the system with good liquidity to remove illiquid assets, or where the Treasury buys up troubled assets to help bank balance sheets — all in order to increase bank lending — such increases the money supply, as lending increases. Early signs of new money growth surfaced in recent reporting.
The SGS-Ongoing M3 measure has shown slowing annual growth since April, but the current August annual growth rate of about 14% still is highly inflationary. As discussed in the money supply section, although money growth has remained positive on a monthly basis, the pattern of slowing growth likely reflected the intensifying systemic liquidity crisis that broke into the open recently. September M3 likely, again, will show positive monthly growth, with some further slowing in annual growth, but annual growth probably will be picking sharply, as early as October, based on accommodations made in order to prevent a systemic collapse.
As shown the following graphs, the monetary base has shown a sharp bi-weekly spike, along with a surge in total bank reserves. The Fed has avoided showing a pick-up in reserves for as long as possible. Such creates money supply the old fashioned way, by revving up the (electronic) printing presses. Crises-related actions by the U.S. Treasury also were reflected in an unusual $200 billion surge in gross federal debt, as discussed in the section covering the federal deficit.
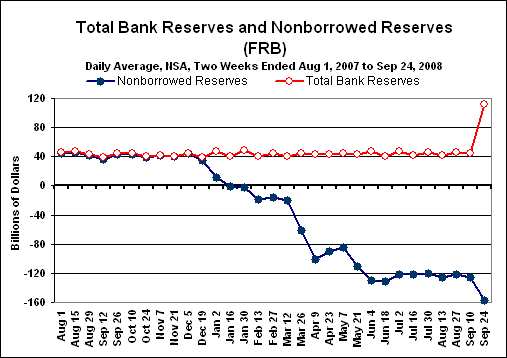

Despite official and neo-deflationist protestations to the contrary, these related actions promise increasing money supply and higher inflation. Again, where failure here is not an option for Messrs. Paulson and Bernanke, they will spend whatever money they need to create, twist any arm that needs to be twisted, bend on any knee, and intervene in or manipulate any market or statistic necessary, in order to save the system. There is a cost to the nation here, and that is in higher inflation.
The Inflationary Recession Keeps Intensifying, Irrespective of Pre-Election GDP Reporting. As shown in the following several graphs, and as indicated in a number of other important economic indicators, the broad economy is behaving exactly as if it were in a recession. The currently observed patterns of officially reported economic growth never have been seen outside of a formal recession.
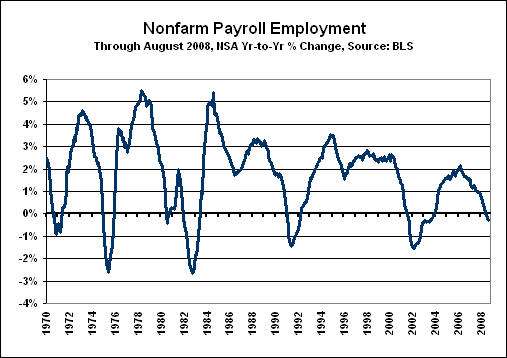
Employment is an extremely broad coincident indicator of economic activity. The series has been in monthly decline since January 2008, and it currently is completing its third consecutive quarter-to-quarter contraction. Annual change also recently turned negative. This series — one of the primary indicators used by the National Bureau of Economic Research (NBER) in officially timing the onset of a recession — is showing growth patterns never seen outside of a formal recession.
With the consumer in trouble, it is not surprising to see patterns of multiple (going-on five) consecutive quarter-to-quarter contractions, and going-on three consecutive quarters with year-to-year contractions in real (inflation-adjusted) retail sales. A leading indicator, this series not only is showing growth patterns not see outside of formal recessions, but it also is signaling an ongoing and deepening recession. Similar growth patterns and story are seen with building permits and housing starts, but are not displayed here.

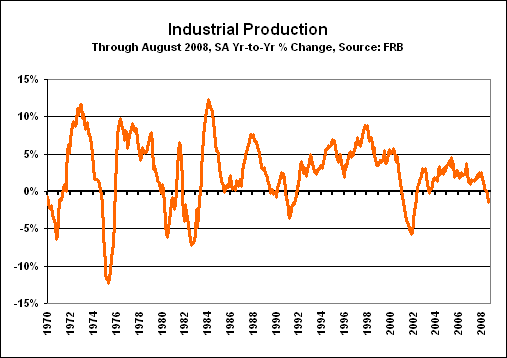
On the industrial side, industrial production is completing its second consecutive sharp quarterly contraction and has turned meaningfully negative on a year-to-year basis. This is another series that is used by the NBER in timing the onset of a recession. Not pictured is new orders for durable goods, which, even before inflation adjustment, is completing its fourth consecutive quarter-to-quarter contraction, and its second consecutive quarter showing deepening year-to-year decline. Industrial production is a coincident economic indicator, new orders for durable goods is a leading indicator.
In combination, these various indicators show the economy to be in a full recession and that the recession is getting worse. Negative GDP results and formal NBER calling of a recession likely will not be seen before the November election.
The current recession, once recognized, should be noted as the second downleg of a structural recession that began back in 2000. As discussed in the April 8th Hyperinflation Special Report, the current inflationary recession eventually should evolve into an inflationary depression and then into a hyperinflationary great depression.
This issue’s Reporting/Market Focus updates the latest income variance numbers. The great variance of income distribution among U.S. households, with heavy weighting towards the upper and lower income brackets, has been a long-lead time indicator of the financial crisis that has started to go public, as well as an indicator of the deepening structural recession frustrating the public. In the next newsletter — barring an intervening systemic collapse — I shall review in depth the background and nature of the current structural economic downturn.
General Outlook is Unchanged. With the financial markets unstable, and the financial crisis in state of flux, I am just going to reiterate here, even though a number of points already have been raised, the long-term outlook published in recent Alerts, and I shall highlight the crisis-related observations in the individual market sections.
It is not likely that the systemic solvency crisis is behind us, and it is too late to prevent a recession. The inflationary recession was well underway before the housing/mortgage crisis, and little can be done to stimulate economic activity, to contain inflation or to provide a long-term prop to equity values. The government, however, does have the ability to support depositor safety, to prevent a collapse of the related financial services industry and to prevent a deflation in the prices of goods and services. Indeed, the cost of systemic salvation is higher price inflation.
The various markets are about as volatile and dangerous as they can get. With extraordinary crosscurrents from the solvency crisis and various governmental and global central bank interventions in the markets and marketplace, volatility likely will continue, sometimes in directions that may seem irrational. The gold and currency markets, in particular, remain subject to jawboning and both covert and overt central bank intervention, aimed at discouraging investors from seeking safety in gold or outside the greenback.
All factors considered, the broad outlook remains the same: further intensification of the inflationary recession and a continued deepening systemic and banking solvency crisis. Growing market recognition of these issues and mounting global political tensions have intensified the risks for continued unstable market conditions, markedly.
Over the near-term, negative major market displacements should follow or be accompanied by intense, broad selling of the U.S. dollar, which may be beginning anew. An eventual, increasing flight-to-safety outside of the U.S. dollar also should include flight-to-safety into gold. Despite continuing softness in oil prices, current levels (anything above $90 per barrel) remain highly inflationary. Over the longer term, U.S. equities, bonds and the greenback should suffer terribly, while gold and silver prices should boom.
PLEASE NOTE: A "General background note" provides a broad background paragraph on certain series or concepts. Where the language used in past and subsequent newsletters usually has been or will be identical, month-after-month, any text changes in these sections will be highlighted in bold italics upon first usage. This is designed so that regular readers may avoid re-reading material they have seen before, but where they will have the material available for reference, if so desired.
Alternate Realities. This section updates the Shadow Government Statistics (SGS) alternate measures of official GDP, unemployment and CPI reporting. When a government economic measure does not match common public experience, it has little use outside of academia or the spin-doctoring rooms of the Federal Reserve, White House and Wall Street. In these alternate measures, the effects of gimmicked methodological changes have been removed from the official series so as to reflect more accurately the common public experience, as embodied by the pre-Reagan-Era CPI and GDP and the pre-Clinton Era unemployment rate. Methodologies for the GDP and CPI series are discussed in the August 2006 SGS.
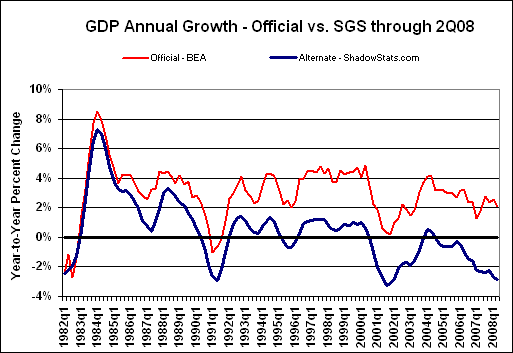
GDP. The alternate second-quarter 2008 GDP growth reflects the "final" estimate revision, with many of the methodological gimmicks of recent decades removed. The alternate second-quarter inflation-adjusted annual growth rate (year-to-year, as opposed to the popularly-touted annualized quarter-to-quarter rate) for GDP was a decline of roughly 2.9% versus the official year-to-year gain of 2.1%. The official, annualized real quarter-to-quarter growth rate now stands at 2.8%. While the quarterly growth number is popularly followed, its significant inaccuracies are expanded to the fourth-power in reporting. The alternate measure, as in the first quarter, safely would have shown a quarterly contraction in the second quarter.
General background note: Historical data on both the official and SGS-Alternate GDP series are available for download on the Alternate Data page of www.shadowstats.com. The Alternate GDP numbers tend to show deeper and more protracted recessions than have been reported formally or reflected in related official reporting. Nonetheless, the patterns shown in the alternate data are broadly consistent with the payroll employment and industrial production series, which are major indicators used by the National Bureau of Economic Research in determining the official timing of U.S. business cycles.
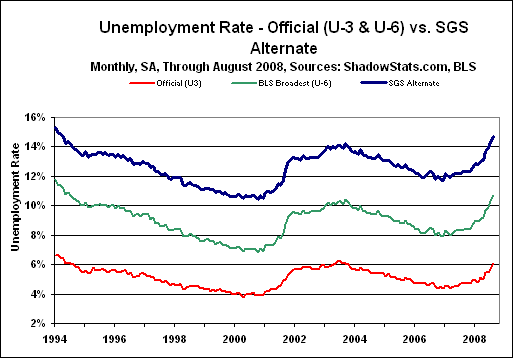
Unemployment Rate. Shown are two official seasonally-adjusted unemployment measures, U.3 and U.6, and the SGS-Alternate Unemployment Measure. All three measures moved sharply higher, again, in August, reflecting rapidly deteriorating labor-market conditions. They stood respectively at 6.1%, 10.7% and 14.7%, up from 5.7%, 10.3% and 14.3% in July.
General background note: U.3 is the popularly followed unemployment rate published by the Bureau of Labor Statistics (BLS), while U.6 is the broadest unemployment measure published by the BLS. U.6 is defined as total unemployed, plus all marginally attached workers, plus total employed part time for economic reasons, as a percent of the civilian labor force plus all marginally attached workers. Marginally attached workers include the discouraged workers who survived redefinition during the Clinton Administration. The SGS-Alternate Unemployment Measure simply is U.6 adjusted for an estimate of the millions of discouraged workers defined away during the Clinton Administration — those who had been "discouraged" for more than one year.
General background note: Historical data on both the official and SGS-Alternate unemployment series are available for download on the Alternate Data page of www.shadowstats.com. The Alternate numbers are reported from the 1994 series redefinitions forward. It is planned to take the alternate series further back in time.
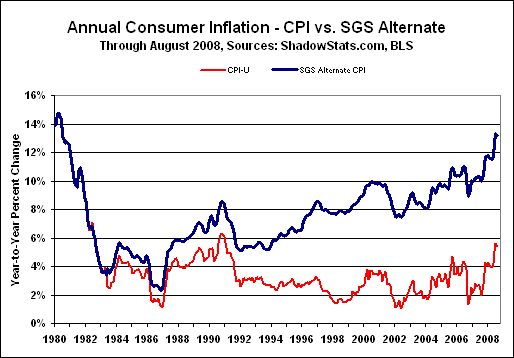
CPI. Absorbing a sharp decline in energy prices, August’s annual full inflation rates eased slightly, while "core" inflation was unchanged. Annual inflation should continue rising well into 2009, with mounting inflationary pressures reflecting the still-increasing impact of energy-cost damages to the general economy, combined with pressures from a weakened dollar and extremely high and monetary growth that appears set to accelerate.
Outright data manipulation appears to be an ongoing issue. Recent food and oil-related price pressures still have been reflected only minimally in current reporting, and that increasingly has caused some in the financial media to question the accuracy of official inflation reporting. The effect is particularly noticeable in the lack of pass-through energy inflation to the so-called "core" numbers.
General background note: Historical data on both the official and SGS-Alternate CPI series are available for download on the Alternate Data page of www.shadowstats.com. The Alternate CPI numbers tend to show significantly higher inflation over time, generally reflecting the reversal of hedonic adjustments, geometric weighting and the use of a more traditional approach to measuring housing costs, measures all consistent with the reporting methodology in place as of 1980. Available as a separate tab at the SGS homepage www.shadowstats.com is the SGS Inflation Calculator that calculates the impact of inflation between any two months, 1913 to date, based on both the official CPI-U and the SGS-Alternate CPI series.
|
Eight Levels of Consumer Inflation |
|||||
|
|
|
2008 |
|
|
|
|
Measure |
May |
Jun |
Jul |
Aug |
|
|
I.1 |
Core PCE Deflator |
2.2% |
2.3% |
2.4% |
n.a. |
|
I.2 |
Core Chained-CPI-U |
2.0% |
2.1% |
2.2% |
2.2% |
|
I.3 |
Core CPI-U |
2.3% |
2.4% |
2.5% |
2.5% |
|
I.4 |
PCE Deflator (r) |
3.5% |
4.0% |
4.5% |
n.a. |
|
I.5 |
Chained-CPI-U |
3.6% |
4.2% |
4.8% |
4.7% |
|
I.6 |
CPI-U |
4.2% |
5.0% |
5.6% |
5.4% |
|
I.7 |
Pre-Clinton CPI-U |
7.5% |
8.3% |
8.9% |
8.7% |
|
I.8 |
SGS Alternate Consumer Inflation |
11.8% |
12.6% |
13.4% |
13.2% |
|
(r) Revised. |
|||||
End of Section One
(View all Sections of this Issue)