Issue Number 47: Overview
Section One
(View all Sections of this Issue)
__________
Still-Intensifying U.S. Inflationary Recession
Systemic Solvency Crisis/Market Instability Not Contained
Obama Faces Same Limited Options as Bush
Hyperinflation Possible in 2009
OVERVIEW — OPENING COMMENTS
Relapse of Severe U.S. Dollar Woes Could
Trigger Next Phase of Financial Crisis
Despite extraordinary actions by the Federal Reserve, U.S. Treasury and other central banks and finance ministries, the global solvency crises, financial panics and market distortions and instabilities continue. While the collapse of a functional U.S. banking system has been avoided, so far, bank lending has not resumed meaningfully, and other weak links in the economy appear ready to break. Possible failures of the "Big-Three" U.S. automakers now are touted in the financial media. Where GM once boasted, "What is good for General Motors is good for America," a failure there would be the ultimate symbol of structural destruction that has sapped U.S. economic activity for decades. Structural issues drove the economy into deep recession well before any crises exacerbations. With the economy in recession, oil prices down and the dollar stronger, deflation concerns abound. Yet, inflation ultimately is a monetary phenomenon, and the Fed’s recent monetary incontinence promises much higher inflation ahead, regardless of near-term CPI gyrations from the pre-election plunge in gasoline prices.
Inflation/Deflation, Money Supply, U.S. Dollar, Price of Gold, G-20 Are Key Questions. I have received a large number of questions from readers concerning inflationary and deflationary pressures, what is or is not happening to money supply, what is the outlook for the U.S. dollar and gold given significant recent relative counterintuitive gains and losses in those markets, among other issues. Those areas are discussed in the sections ahead, and further, related reader queries are invited.
This weekend’s G-20 meeting, though called to address the global nature of the ongoing financial-system crisis, is not likely to generate any surprises, but one never knows. There is talk of coordinated fiscal stimulus, but, as discussed later, the U.S. has increasingly limited options in that area. There is talk of establishing global regulatory oversight of the financial services industry, but such would do little to improve the current circumstance, and it is not likely that the U.S. would yield any sovereignty over its domestic markets and financial institutions, at present. To the extent anything of substance is forthcoming, such will be addressed in a separate Flash Update or Alert, as usually would be the case for a significant economic or market development in the period between full newsletters.
With third-quarter GDP reported in contraction, and with consensus forecasters and the popular financial media talking recession, my claims of the economy being in a protracted, deep recession are among the least controversial of my analyses. Accordingly, this special double issue concentrates first on the solvency/financial crisis and the resulting monetary implications for inflation. Explored second are the nature, depth and prospects for the ongoing recession, with the downturn considered in historical context in this month’s Reporting/Market Focus.
General Outlook is Unchanged, Except for Hyperinflation Timing (2009). With the financial markets unstable and the systemic-solvency crisis ongoing, my broad outlook has not changed. The various markets are about as volatile and as dangerous as they can get. With extraordinary crosscurrents from the solvency crisis and various governmental and global central bank interventions in the markets and marketplace, volatility likely will continue, sometimes in directions that may seem irrational.
The gold and currency markets, in particular, have suffered extreme distortions, moving against strong fundamentals. As deleveraging pressures subside (timing unknown), the U.S. dollar should come under heavy selling pressure, once again, likely triggering a rebound in gold as well as some pick-up in oil prices. Over the longer term, U.S. equities, bonds and the greenback should suffer terribly, while gold and silver prices should boom.
The U.S. continues in a severe, inflationary recession that was well underway before the housing/ mortgage crisis attracted attention. Little can be done to stimulate near-term economic activity, to contain inflation or to provide a long-term prop to equity values. The government, however, does have the ability to support depositor safety, to prevent a collapse of the related financial services industry and to prevent a deflation in the prices of goods and services. Those government actions are underway, and the cost of systemic salvation is higher price inflation, despite plunging oil prices.
As broad money growth accelerates, inflation will increase. When heavy dollar selling begins anew, and dollar dumping leads to dumping of dollar-based assets held by foreign investors, the Fed will find itself in a circumstance where increasingly it will have to monetize accelerating Treasury debt supply. Under that combination of circumstances, I am moving ahead in time the possible onset of hyperinflation into 2009, from 2010 in the previously estimated range of 2010 to 2018, detailed in the Hyperinflation Special Report of April 2008.
In the severe structural downturn that has unfolded over decades, the U.S. economy cannot be turned overnight with quick-fix stimulus packages that otherwise might help balance out a brief and shallow inventory recession (where production is cut in order to work-off an excess build-up in inventories). An economic fix requires structural change and time. What looms is a depression, which would become a great depression in the event of the disruption to normal commerce from a period of hyperinflation (see the Reporting/Market Focus section).
Obama Faces Same Fiscal Limitations as Bush. The Obama Administration will face the same fiscal constraints that the Bush Administration has faced but largely ignored. Presumably, if Bush could ignore the fiscal constraints, then so could Obama. As the U.S. government’s effective long-term bankruptcy gains broader recognition, however, Uncle Sam increasingly will have difficulty selling its debt to anyone other than the Federal Reserve (see the Hyperinflation Special Report of April 8, 2008). Shy of what new debt can be foisted on a gullible public or severely pressured U.S. trading partners, there should be zero new funds available to pay for new government programs, expanded programs or fiscal stimulus.
Nonetheless, the political miscreants in Washington will continue to spend money they do not have and that they have no prospects of ever raising, at least until the financial markets start to say "no more." With the economy in a structural contraction, promised further fiscal stimulus will have increasingly short-lived positive impact on the economy, but increasingly dire consequences for the U.S. fiscal condition and the U.S. dollar.
Views expressed by President-Elect Obama have been heavily suggestive of a rapid push by his Administration for a more-expansive, more-controlling, more-intrusive and more-expensive central government. As a rule of thumb, forced redistributions of income and wealth, greater government control of production and commerce, and more-intrusive government programs such as nationalized health insurance tend to lead to a less productive and less competitive society. Such programs limit economic growth and — at the extreme — ultimately condemn business activity to perpetual bottom-bouncing. Such programs not only would exacerbate the current structural downturn in the U.S. economy, but also would accelerate the timing on the eventual hyperinflation, given the deficit financing needs of same.
U.S. Dollar Strength a Temporary Artifact of Ongoing Solvency Crisis. As discussed in greater detail in the respective market or reporting sections, the sharp rise in the value of the U.S. dollar has been key to the decline in gold, silver and oil prices. The dollar’s recent surge has been heavily affected by the dollar-holding needs of foreign investors in the process of deleveraging. That process is ongoing. At such time as the markets begin to stabilize, the pressures on the dollar likely will shift sharply to the sell side, which in turn should help to boost pricing both for precious metals, as well as for dollar-denominated oil.
Oil/Gasoline Price Declines Partially Pre-Election Politics? When national gasoline prices averaged above $4.10 per gallon back in June and July — with oil prices at record highs — not only was the gasoline-consuming electorate feeling increasing cost-of-living discomfort, but the political implications for the incumbent Republican Party holding the White House were horrendous. Beyond the possibility of political deals that may have been struck within the global oil industry, a sudden and unfounded surge in buying of the U.S. dollar began (likely Treasury/Fed encouraged), which added significant downside pressure to oil prices. Those factors, combined with already weakening gasoline demand and normal seasonal price variation, brought gasoline prices down by about 45% to an average $2.28 per gallon in the week including election day, back to price levels not seen since February 2007 (Department of Energy numbers).
With the election having gone against the Republicans, whatever political pressures were there to keep gasoline prices low, have vanished. Any new political pressures now will be coming from the Democrats, along with what had been promises of something along the lines of a windfall profits tax for U.S. oil corporations.
Gasoline Prices Will Reduce Near-Term CPI Inflation. Those arguing that the U.S. faces deflation, as opposed to inflation, in goods and services prices in the not-too-distant future — an actual in contraction annual CPI inflation — anticipate contracting money growth and look at collapsing commodity prices hit by an unfolding, savage global recession. In fact, the October manufacturing purchasing managers survey showed a sharp decline in its price index into deflation territory.
Near-term CPI reporting likely will see two fairly strong, seasonally-adjusted monthly contractions in October and November, thanks to the recent collapse in gasoline prices, but that should be about the extent of the oil induced "deflation." As these particularly large declines are absorbed by the CPI, annual inflation will not come close to turning negative.
Aside from risks of a resurgence in oil prices — discussed later — possibly adding near-term upside pressures on energy prices, the long-term impacts of a weaker dollar and high oil prices still are working their way through the system, during the next six months or so.
As a separate and overriding issue, price inflation is a monetary phenomenon. Although broad money growth has slowed on an annual basis (to a level that still is highly inflationary) and contracted on a monthly basis, and although velocity may have slowed along with the solvency crisis, actions by the Federal Reserve and U.S. Treasury have put into play a surge in money growth that should become painfully evident in the next several months. As money growth resumes, so, too, will velocity accelerate, as consumers again consider the implications of negative real interest rates.
Federal Deficit and Debt Continue to Explode. As discussed in more detail in the federal deficit section, gross U.S. federal debt at the end of October had increased by $928 billion since the end of August, an increase of 10.2% in two months. The officially gimmicked federal deficit was $169 billion in 2007, $455 billion in 2008, and it appears to be headed to $1.5 trillion in 2009. Such has contributed to the timing advance in the possible year of the hyperinflation onset.
Risks of U.S. Default. I keep receiving queries on a possible default on U.S. debt within the next year or so, as result of the explosive growth in federal debt. Such is not likely, unless foreign lenders start making not-so-unreasonable demands that the United States issue its debt in yen, pounds, euros, etc. While the government’s gross debt level is exploding, the United States already had no prospects of ever honoring the obligations that were in place before the current crisis (see the Hyperinflation Special Report of April 8, 2008). Under such circumstances, most governments would opt to use the printing press to inflate their way out of debt, rather than to go through a formal debt default.
That is why the agencies that issue sovereign debt ratings usually will give a "AAA" rating, when debt is issued in the sovereign’s currency, backed by the power of being able to create whatever currency is needed in order to meet the obligations.
If, however, the U.S. had to start covering new obligations in something other than the U.S. dollar, then the risk of formal default would become meaningful, and sovereign ratings on non-dollar U.S. Treasury debt easily could fall below investment grade.
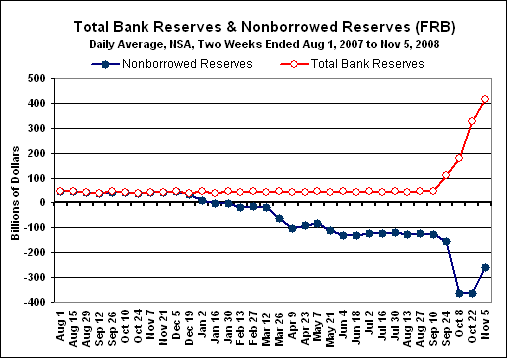
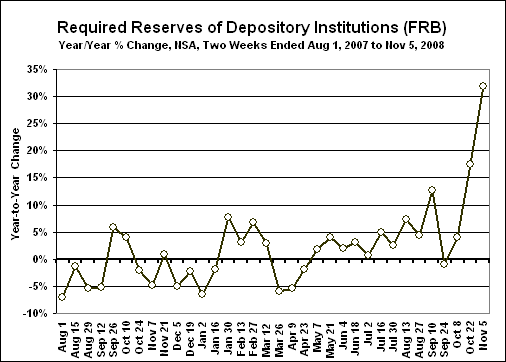
Reserves and Monetary Base Surge, Broad Money Measure Still Lags. As shown in the following graphs, total reserves of depository institutions (FRB, not seasonally adjusted) continued to surge, rising to $415.7 billion in the two weeks ended November 5th, from $327.6 billion in the prior two-week period, and from $44.2 billion as recently as September 10th.
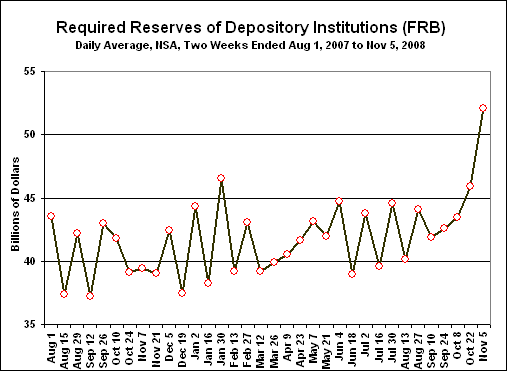
Where most of the growth has been in excess reserves, such suggests that the banks generally have not resumed normal lending. Of some significance, however, required reserves rose to $52.1 billion in the latest period, up from $45.9 billion in the prior period and from $41.9 billion in the two weeks ended September 10th. The 31.9% annual growth in required reserves is at the fastest pace of the post-World War II era. This suggests that the excess reserves have started entering the system, albeit slowly, even allowing for shifts in unreserved existing funds into accounts that have reserve requirements.
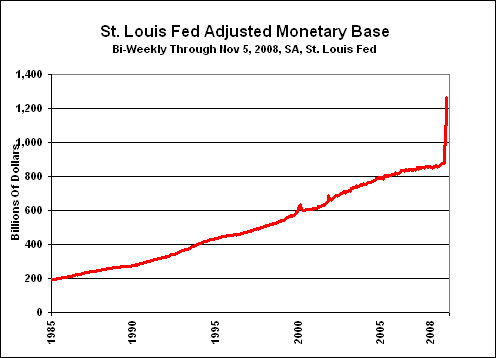
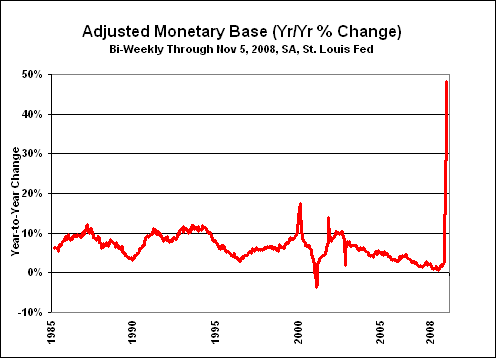
The seasonally-adjusted St. Louis Fed Monetary Base — the traditional tool for adjusting money supply growth — rose by 7.0% (annualizes to over 3200%) between the two-week periods ended October 22nd and November 5th. The monetary base basically includes the currency component of M1 and total bank reserves. Year-to-year growth for the latest two week period was 48.2%, up from 38.0% year-to-year in the prior period, due largely to surging reserves.
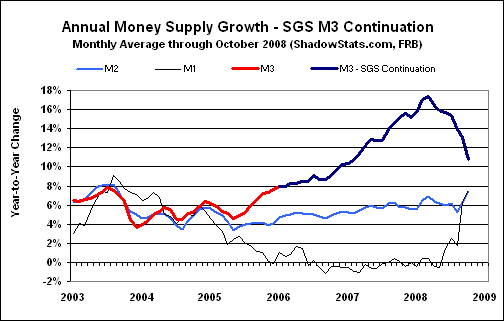
Annual Broad Money Growth Slows, Contracts on Monthly Basis. The monthly-average annual growth in the SGS-Ongoing M3 estimate for October was roughly 10.8%, still a highly inflationary level, and likely the trough in the current growth cycle. Monthly change was a contraction of 0.4%, the ninth such contraction since 2000. There are indications that the M3 components have started to pick-up in response to the recent extreme accommodation by the Federal Reserve. Details will be provided in Flash Updates as the information becomes available.
As discussed in the Money Supply Special Report of August 3, 2008, there is no perfect measure of money growth. Generally, the broader the measure (M3 being the broadest until discontinued by the Fed in 2006, still estimated by the SGS-Ongoing M3), the better it is as a predictor of inflation. Discontinued in 1998 by the Fed was a still-broader measure known as "L" for liquid assets. It contained individual holdings of Treasury bills. In the recent panic, the Treasury issued bills to help keep that market liquid, but that had the effect of drawing cash out of the system and out of the reported money supply. If "L" still were published, I estimate annual growth would have been about 15% in October.
Fed apologists offer assurances that the U.S. central bank will dry up excess liquidity when the crisis passes, with no net impact on money supply growth or inflation prospects. Assurances also are being put forth that the surge in government borrowing will be absorbed happily by the usual forced lenders, and that the Fed will not have to monetize Treasury debt further. Do not count on that! As to talk of declining money supply velocity in the current crisis, such has some merit, but as bank lending returns to normal (which it will, as it is forced by the Fed, the Treasury and Congress), so, too, will velocity likely accelerate anew in response to still negative real (inflation-adjusted) interest rates.
Formal Recession Appears Near. A week before the "advance" estimate of third-quarter GDP was released, the White House effectively warned that it would show a contraction, as would likely the fourth quarter. Such would be a recession terms of traditional definition. Whether that will happen, however, remains to be seen. Recent trade reporting could allow for the artificially small 0.3% third-quarter contraction to revise away.
As shown by almost all major economic indicators, the U.S. economy is in a deep and deteriorating structural recession, which could reach depression status in 2009. The nature of the structural problem and depth of the current downturn are addressed in historical perspective in the Reporting/Market Focus. Based on existing GDP, GDI and GDP reporting, the following quarters have shown inflation-adjusted quarterly contractions: 1Q07 (GNP/GDI), 4Q07 (GDP/GDI), 1Q08 (GDI), 3Q08 (GDP). Accordingly, in conjunction with the better quality underlying economic series, these patterns suggest that a formal recession could be timed from as early as fourth-quarter 2006.
Such timing would support my contention that the current downturn is but the second leg of a multiple-dip recession that began back in 2000. Given the recession’s structural nature and the present fiscal limitations on the U.S. government, this contraction will be particularly protracted. Recovery is not yet within the nine-month horizon of the better leading indicators to economic activity.
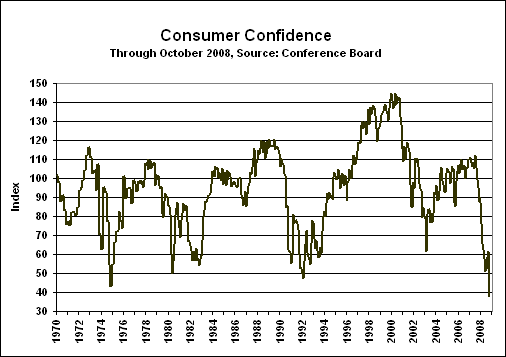
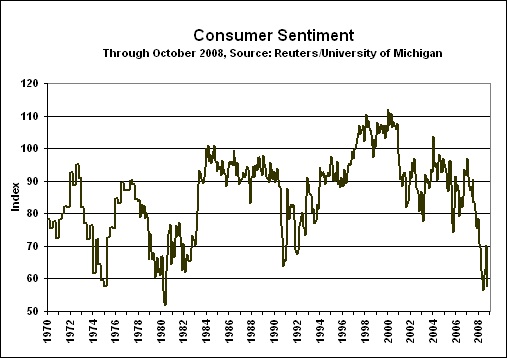
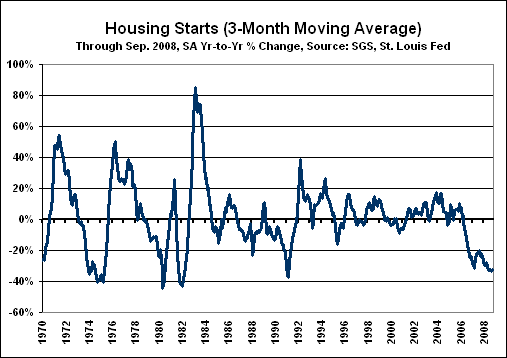
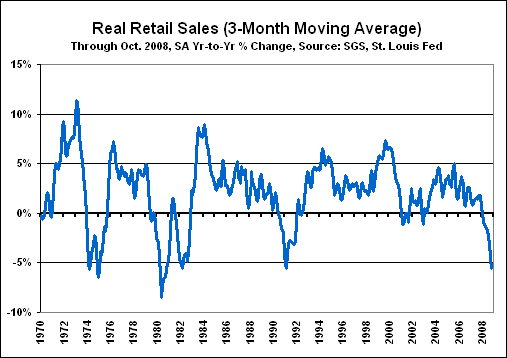
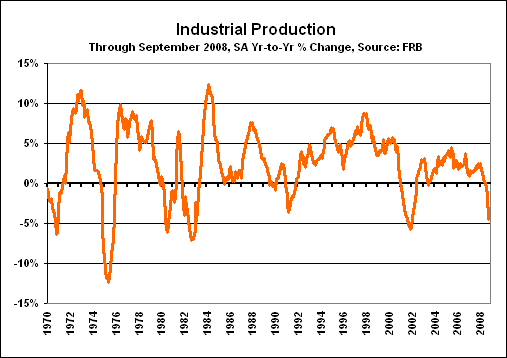
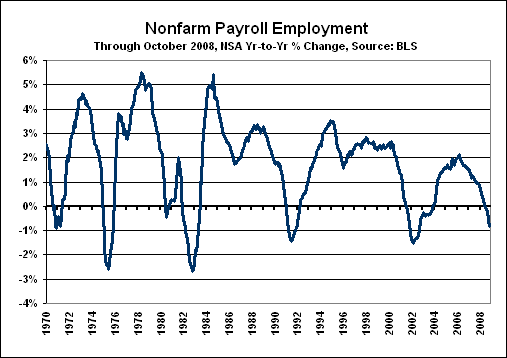
The following series of six graphs reflect the official recessions of 1969/70, 1973/5, 1980, 1981/2, 1990/1 and 2001 (see this month’s Reporting/Market Focus), as shown with the low readings or the depths of contraction never seen outside of official recessions. The less-severe downswings tend to coincide with unofficial downturns, also discussed in this month’s Reporting/Market Focus.
The consumer confidence and sentiment measures have shown extremely sharp downturns, and are consistent with the annual growth patterns seen in housing starts and retail sales, as well as the later pattern seen in payrolls. In like manner industrial production has mirrored the pattern of consumer demand.
In each series showing year-to-year change, the patterns show not only sharp year-to-year contraction in the last year or two, but the underlying numbers in each series also show successive quarter-to-quarter contractions. These patterns of sharp contractions never have been seen outside of periods of formal recessions.
The housing starts graph was adjusted to eliminate New York City paperwork distortions that artificially inflated June 2008 reporting. The retail sales graph includes October reporting, with an estimate of a seasonally adjusted 1.0% decline in the October CPI.
PLEASE NOTE: A "General background note" provides a broad background paragraph on certain series or concepts. Where the language used in past and subsequent newsletters usually has been or will be identical, month-after-month, any text changes in these sections will be highlighted in bold italics upon first usage. This is designed so that regular readers may avoid re-reading material they have seen before, but where they will have the material available for reference, if so desired.
Alternate Realities. This section updates the Shadow Government Statistics (SGS) alternate measures of official GDP, unemployment and CPI reporting. When a government economic measure does not match common public experience, it has little use outside of academia or the spin-doctoring rooms of the Federal Reserve, White House and Wall Street. In these alternate measures, the effects of gimmicked methodological changes have been removed from the official series so as to reflect more accurately the common public experience, as embodied by the pre-Reagan-Era CPI and GDP and the pre-Clinton Era unemployment rate. Methodologies for the GDP and CPI series are discussed in the August 2006 SGS.
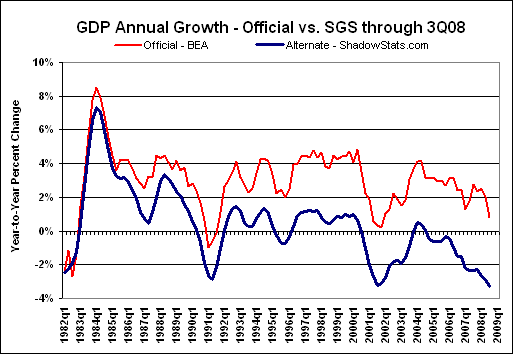
GDP. The alternate third-quarter 2008 GDP growth reflects the "advance" estimate, with many of the methodological gimmicks of recent decades removed. The alternate third-quarter inflation-adjusted annual growth rate (year-to-year, as opposed to the popularly-touted annualized quarter-to-quarter rate) for GDP was a decline of roughly 3.3% versus the official year-to-year gain of 0.8%. The official, annualized real quarter-to-quarter change stands at a 0.3% contraction. While the quarterly growth number is popularly followed, its significant inaccuracies are expanded to the fourth-power in reporting. The alternate measure safely would have shown an annualized quarterly contraction in the third quarter, likely in excess of two-percent.
General background note: Historical data on both the official and SGS-Alternate GDP series are available for download on the Alternate Data page of www.shadowstats.com. The Alternate GDP numbers tend to show deeper and more protracted recessions than have been reported formally or reflected in related official reporting. Nonetheless, the patterns shown in the alternate data are broadly consistent with the payroll employment and industrial production series, which are major indicators used by the National Bureau of Economic Research in determining the official timing of U.S. business cycles.
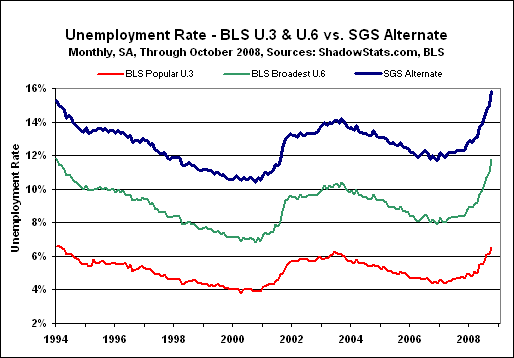
Unemployment Rate. Shown are two official seasonally-adjusted unemployment measures, U.3 and U.6, and the SGS-Alternate Unemployment Measure. The various measures moved sharply higher in October, reflecting the rapidly deteriorating labor-market conditions. They stood respectively at 6.5%, 11.8% and 15.8%, up from 6.1%, 11.0% and 15.0%.
General background note: U.3 is the popularly followed unemployment rate published by the Bureau of Labor Statistics (BLS), while U.6 is the broadest unemployment measure published by the BLS. U.6 is defined as total unemployed, plus all marginally attached workers, plus total employed part time for economic reasons, as a percent of the civilian labor force plus all marginally attached workers. Marginally attached workers include the discouraged workers who survived redefinition during the Clinton Administration. The SGS-Alternate Unemployment Measure simply is U.6 adjusted for an estimate of the millions of discouraged workers defined away during the Clinton Administration — those who had been "discouraged" for more than one year.
General background note: Historical data on both the official and SGS-Alternate unemployment series are available for download on the Alternate Data page of www.shadowstats.com. The Alternate numbers are reported from the 1994 series redefinitions forward. It is planned to take the alternate series further back in time.
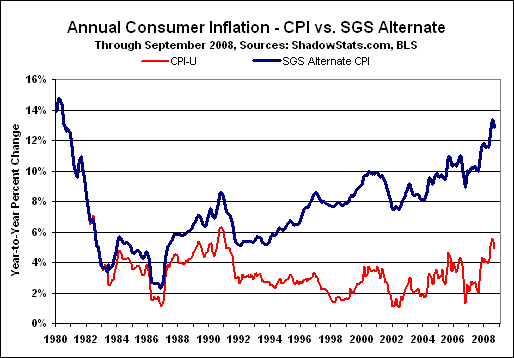
CPI. Absorbing a further sharp decline in energy prices, September’s annual full inflation rates eased again, while "core" inflation largely held at August levels. Shy of October and November’s pending inflation dips from the pre-election plunge in gasoline prices, annual inflation generally should rise well into 2009, with mounting inflationary pressures reflecting the ongoing flow-through impact of energy-cost damages to the general economy and upside inflation pressures from monetary growth in place before the recent systemic solvency crisis. Renewed and intensified money growth and dollar selling will spike the longer range inflation outlook further.
General background note: Historical data on both the official and SGS-Alternate CPI series are available for download on the Alternate Data page of www.shadowstats.com. The Alternate CPI numbers tend to show significantly higher inflation over time, generally reflecting the reversal of hedonic adjustments, geometric weighting and the use of a more traditional approach to measuring housing costs, measures all consistent with the reporting methodology in place as of 1980. Available as a separate tab at the SGS homepage www.shadowstats.com is the SGS Inflation Calculator that calculates the impact of inflation between any two months, 1913 to date, based on both the official CPI-U and the SGS-Alternate CPI series.
|
Eight Levels of Consumer Inflation
Annual Inflation for June to September 2008 |
|||||
|
|
|
2008
|
|
|
|
|
Measure
|
Jun
|
Jul
|
Aug
|
Sep
|
|
|
I.1
|
Core PCE Deflator (r)
|
2.3%
|
2.5%
|
2.5%
|
2.4%
|
|
I.2
|
Core Chained-CPI-U
|
2.1%
|
2.2%
|
2.2%
|
2.2%
|
|
I.3
|
Core CPI-U
|
2.4%
|
2.5%
|
2.5%
|
2.5%
|
|
I.4
|
PCE Deflator (r)
|
4.1%
|
4.5%
|
4.5%
|
4.2%
|
|
I.5
|
Chained-CPI-U
|
4.2%
|
4.8%
|
4.7%
|
4.3%
|
|
I.6
|
CPI-U
|
5.0%
|
5.6%
|
5.4%
|
4.9%
|
|
I.7
|
Pre-Clinton CPI-U
|
8.3%
|
8.9%
|
8.7%
|
8.3%
|
|
I.8
|
SGS Alternate Consumer Inflation
|
12.6%
|
13.4%
|
13.2%
|
12.9%
|
|
(r) Revised.
Notes: I.1 to I.3 reflect the core inflation rates, respectively, of the substitution-based personal consumption expenditure (PCE) deflator, the Chained-CPI-U and the geometrically-weighted CPI-U. I.4 to I.6 are the same measures with energy and food inflation included. The CPI-U (I.6) is the measure popularly followed by the financial press, when the media are not hyping core inflation. I.7 is the CPI-U with the effects of geometric weighting (Pre-Clinton Era as estimated by SGS) reversed. This is the top series in the CPI graph on the SGS home page www.shadowstats.com. I.8 reflects the SGS Alternate Consumer Inflation measure, which reverses the methodological gimmicks of the last 25 years or so, plus an adjustment for the portion of Clinton-Era geometric weighting that is not otherwise accounted for in BLS historic bookkeeping. |
|||||
End of Section One
(View all Sections of this Issue)