Issue Number 49: Markets Perspective
Section Two
(View all Sections of this Issue)
MARKETS PERSPECTIVE
Extreme market volatility continues in unusually unstable economic and systemic crises. Despite some faux flight-to-quality in the U.S. dollar, the precious metals have gained the most recently as deteriorating global conditions have intensified a flight-to-safety move in the long-term stores of wealth. Almost anything can happen in the current circumstance. While the text below may be somewhat repetitive with the last newsletter, my general thinking has not changed.
|
Closing Financial-Market Indicators at February 13, 2009
|
||||||||||||
|
Indicator
|
1st-Qtr 2009 to Date (Feb 13)
|
Year-End 2008/4th-Qtr
|
Year-End 2007
|
|
||||||||
|
|
Level
|
QTD/YTD
|
Yr/Yr
|
Level
|
Qtr/Qtr
|
Yr/Yr
|
Level
|
Yr/Yr
|
|
|||
|
|
|
|
|
|
|
|
|
|
|
|||
|
Equity Market
|
|
|
|
|
|
|
|
|
|
|||
|
DJIA
|
7,850.41
|
-10.55%
|
-37.46%
|
8,776.39
|
-19.12%
|
-33.84%
|
13,264.82
|
6.43%
|
|
|||
|
S&P 500
|
826.84
|
-8.46%
|
-39.52%
|
903.25
|
-22.45%
|
-38.49%
|
1,468.36
|
3.53%
|
|
|||
|
DJ Wilshire 5000
|
8,385.74
|
-7.72%
|
-39.42%
|
9,087.17
|
-23.48%
|
-38.68%
|
14,819.60
|
3.94%
|
|
|||
|
NASDAQ Comp
|
1,534.36
|
-2.71%
|
-35.37%
|
1,577.03
|
-24.61%
|
-40.54%
|
2,652.28
|
9.81%
|
|
|||
|
|
|
|
|
|
|
|
|
|
|
|||
|
Credit Market (1)
|
|
|
|
|
|
|
|
|
|
|||
|
Fed Funds (2)
|
0.00%
|
0bp
|
-300bp
|
0.00%
|
-200bp
|
-425bp
|
4.25%
|
-100bp
|
|
|||
|
3-Mo T-Bill
|
0.29%
|
18bp
|
-199bp
|
0.11%
|
-87bp
|
-325bp
|
3.36%
|
-166bp
|
|
|||
|
2-Yr T-Note
|
0.97%
|
21bp
|
-94bp
|
0.76%
|
-124bp
|
-229bp
|
3.05%
|
-177bp
|
|
|||
|
5-Yr T-Note
|
1.88%
|
33bp
|
-83bp
|
1.55%
|
-143bp
|
-190bp
|
3.45%
|
-125bp
|
|
|||
|
10-Yr T-Note
|
2.89%
|
64bp
|
-81bp
|
2.25%
|
-160bp
|
-179bp
|
4.04%
|
-67bp
|
|
|||
|
30-Yr T-Bond
|
3.68%
|
99bp
|
-84bp
|
2.69%
|
-162bp
|
-176bp
|
4.45%
|
-36bp
|
|
|||
|
|
|
|
|
|
|
|
|
|
|
|||
|
Oil(3) US$ per Barrel
|
||||||||||||
|
West Texas Int.
|
37.51
|
-15.90%
|
-59.58%
|
44.60
|
-55.68%
|
-53.55%
|
96.01
|
57.24%
|
|
|||
|
|
|
|
|
|
|
|
|
|
|
|||
|
Currencies/Dollar Indices(4) US$/Unit
|
||||||||||||
|
Pound Sterling
|
1.4401
|
-1.49%
|
-26.59%
|
1.4619
|
-17.89%
|
-26.33%
|
1.9843
|
1.31%
|
|
|||
|
Euro
|
1.2888
|
-7.41%
|
-11.59%
|
1.3919
|
-1.15%
|
-4.68%
|
1.4603
|
10.65%
|
|
|||
|
Swiss Franc
|
0.8616
|
-8.04%
|
-4.58%
|
0.9369
|
4.83%
|
6.14%
|
0.8827
|
7.64%
|
|
|||
|
Yen
|
0.0109
|
1.28%
|
10.39%
|
0.0110
|
16.68%
|
23.04%
|
0.0090
|
6.54%
|
|
|||
|
Canadian Dollar
|
0.8097
|
-0.89%
|
-19.09%
|
0.8170
|
-13.43%
|
-19.27%
|
1.0120
|
17.92%
|
|
|||
|
Australian Dollar
|
0.6580
|
-5.77%
|
-26.35%
|
0.6983
|
-11.65%
|
-20.43%
|
0.8776
|
11.31%
|
|
|||
|
Weighted Currency Units/US$ (Jan. 1985 = 100)
|
||||||||||||
|
Financial (FWD)
|
54.95
|
4.69%
|
16.91%
|
52.49
|
5.93%
|
11.07%
|
47.26
|
-7.64%
|
|
|||
|
Change US$/FX
|
–
|
-4.48%
|
-14.47%
|
–
|
-5.60%
|
-9.96%
|
–
|
8.27%
|
|
|||
|
Trade (TWD)
|
59.31
|
3.78%
|
12.69%
|
57.15
|
4.33%
|
8.40%
|
52.72
|
-10.00%
|
|
|||
|
Change US$/FX
|
–
|
-3.64%
|
-11.26%
|
–
|
-4.15%
|
-7.75%
|
–
|
10.01%
|
|
|||
|
|
|
|
|
|
|
|
|
|
|
|||
|
Precious Metals(5) US$ per Troy Ounce
|
||||||||||||
|
Gold
|
935.50
|
7.56%
|
4.06%
|
869.75
|
-1.67%
|
4.32%
|
833.75
|
31.92%
|
|
|||
|
Silver
|
13.37
|
23.91%
|
-21.26%
|
10.79
|
-16.74%
|
-26.90%
|
14.76
|
14.41%
|
|
|||
|
|
|
|
|
|
|
|
|
|
|
|
||
|
bp: Basis point or 0.01%. (1) Treasuries are constant-maturity yield, U.S. Treasury. (2) Current Fed Funds target is 0.00% to 0.25%. (3) Department of Energy. (4) Shadow Government Statistics, Wall Street Journal, Federal Reserve Board (see Dollar Index Section for definitions). (5) London fix (afternoon for gold), Kitco.com.
|
|
|||||||||||
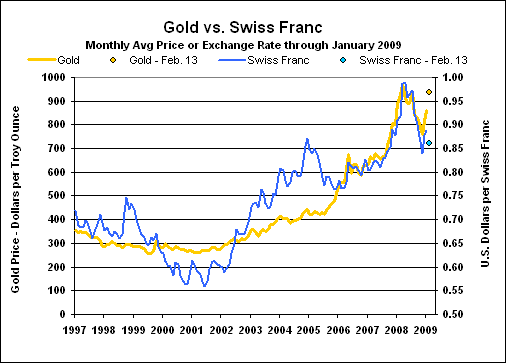
I continue to argue that investors should be looking at the long-term and at preserving their wealth and assets in what eventually will become a hyperinflationary great depression. With severe economic, inflation and currency displacements ahead in the United States, those who can ride out the turmoil eventually should see tremendous investment opportunities. As to preserving capital and assets for someone in a U.S. dollar-denominated environment, holding some assets in physical gold (and some silver), and holding some assets outside the dollar (i.e. the Swiss franc, Canadian dollar) in high-quality, liquid assets, remain the best long-range hedges against all the real risks facing investors and the system.
Again, this is for the long haul. Short-term conditions still can show extreme volatility in the U.S. dollar and precious metals, as seen in the last year. Putting aside risks of political instabilities tied to the economic turmoil or any short-term liquidity concerns, real estate also remains a prime long-term hedge against the severe currency debasement that lies ahead.
With the ongoing crises in systemic solvency and in a severely contracting economy with inflation problems, the long-term outlook holds: U.S. equities will continue to suffer in a severe bear market; long-term U.S. Treasury yields will spike in response to inflation, eventual dollar dumping and mounting Treasury borrowing needs against a market with weakening demand; selling will intensify against the U.S. dollar, evolving into dollar dumping and dumping of dollar-denominated assets. Precious metals, particularly gold, will rally against mounting monetary and inflation pressures (and likely higher oil prices from a weakening dollar), weakness in the dollar, and as safe-haven hedges against increasing systemic and global political instability.
U.S. Equities — The downside movement in equities generally has continued in what has proven to be a particularly savage bear market. It likely is far from over, with a downside potential still of roughly an 80% loss from current levels, which would bring total losses from last year’s record closing prices – peak-to-trough — into the 90% range as seen in the 1929 to 1933 period (see note below). This outlook is over the longer term, and is in the context of ongoing extreme volatility, including likely intervening sharp rallies.
Feeding the ongoing bear market is an economy in deepening recession/depression with no sustainable recovery in sight. Even with the big stimulus package, the economy faces at best some bottom-bouncing before its next downleg, but more likely, the bottom-bouncing will not be strong enough to show any net economic gain. Also, with eventual heavy dollar selling, renewed inflation and mounting issues as to the long-term quality of U.S. Treasuries, long-term interest rates eventually will rise sharply.
General background note: Equities have begun to catch-up with the underlying economic, financial and systemic fundamentals, but the aggregate downside adjustments to stock prices still should be quite large over a number of years, eventually rivaling the total 90% decline in equities seen in the 1929 crash and ensuing four years. The current decline might have to be measured in real terms, however, as a hyperinflation eventually will kick in, with the Fed moving to liquefy the system and monetize federal debt. Stocks do tend to follow inflation, since revenues and earnings get denominated in inflated dollars. Hence with a hyperinflation, a DJIA of 100,000 or 100,000,000 could be expected, but such still would be well below today’s levels, adjusted for inflation (see the Hyperinflation Special Report of April 8, 2008).
U.S. Credit Market — With the targeted fed funds rate at 0.00% to 0.25%, the Fed has pushed short-term interest rates as low as they can go. U.S. Treasury yields, in general, already are at or near historic lows, but are not sustainable at those levels, except that the Fed may move to monetize long-term debt issues in an effort maintain those low yields artificially. Such monetization, which appears increasingly likely, would accelerate broad money growth and intensify inflation pressures — conditions also desired by the Fed, temporarily. Eventually, inflation and resulting dollar weakness would drive longer term rates much higher, assuming regular market forces remained in play. Further boosting yields would be mounting concerns as to U.S. government solvency.
If inflation rises strongly in the year ahead, as I expect (but not at hyperinflationary levels), it would tend to support double-digit long-term yields, again, assuming normal market forces are allowed to play out.
U.S. Dollar — Those touting the U.S. dollar and U.S. Treasuries as bastions of safety in an increasingly insolvent world severely overestimate relative U.S. economic and systemic stability. Quite to the contrary, the world’s largest economy is tumbling into the deepest post-World War II downturn, with no end in sight. Further, the world’s largest financial system likely is largely insolvent, and may not be salvageable shy of significant nationalization of key firms. The solutions offered to these crises just add significant further unfunded liabilities to total U.S. government obligations that were at $65 trillion pre-crises. At more than four times U.S. GDP, and at a level greater that total global GDP, that debt means the U.S. government faces eventual insolvency, which most likely will be covered by the currency printing presses. The resulting hyperinflation will lead to a full debasement of the U.S. dollar and an overhaul of the global currency system.
Central bankers have a pretty good sense of what lies ahead for the U.S. currency, and no one can be particularly happy with heavy holdings of the greenback. Luo Ping, a director-general of the China Banking Regulatory Commission was cited by the Financial Times (FT.com, "China to stick with US bonds," February 11, 2009) as bemoaning the lack of options as to holding dollars and U.S. Treasuries:
"We hate you guys [United States]. Once you start issuing $1 trillion-$2 trillion … we know the dollar is going to depreciate, so we hate you guys but there is nothing much we can do."
I would not bet against the Chinese central bank finding other options. In a related area, any demand on the U.S. to issue its debt denominated in something other than dollars would place severe strains on the U.S. dollar as well as on the United States’ sovereign credit rating.
General background note: The long-term outlook for the dollar remains for a massive sell-off, with flight from the dollar eventually evolving into a flight to safety outside the dollar. The U.S. dollar’s portfolio of underlying fundamentals generally could not be much worse. Relative to major trading partners, the U.S. economy is much weaker; interest rates are lower; inflation has been and will be higher; fiscal and monetary conditions are worse in the extreme; relative trade-balance conditions are horrendous; and relative political/systemic concerns are high, although the Obama Administration likely will enjoy some grace period with markets.
General background note: The proximal trigger for a full dollar panic already may be in place, given the Fed and Treasury’s responses to the ongoing systemic solvency crisis. Otherwise it could come from a particularly bad economic statistic, political missteps by the Administration, negative trade or market developments outside the United States, or a terrorist attack or expansion of U.S. military activity. When the trigger is pulled, what likely will be broad selling pressure will turn into an outright panicked dumping of the greenback, which should overwhelm any short-lived central bank intervention and roil the domestic financial markets, further. Generally, the greater the magnitude of the dollar selling, the greater will be the ultimate inflation pressure and liquidity squeeze in the U.S. capital markets, on top of an otherwise ongoing systemic and intensifying economic crisis.
As shown in the accompanying graph, the strength in the U.S. dollar, since the market distortions and interventions following the Bear Stearns crisis, has continued amidst ongoing volatility. The financial- and trade-weighted indices bounced back a little in January, and have strengthened further as of the U.S. market close on February 13th.

Please Note: As of January 1, 2009, the Federal Reserve ceased publishing its daily noon exchange rates on a timely basis. Where the daily rate or monthly average for a currency or index used in the newsletter or indices has been based on Federal Reserve reporting, such will continue when possible. Otherwise, the exchange rate or index will be based on daily rates published in the Wall Street Journal. When full Federal Reserve data are available, the monthly indices will be updated to reflect same in the regular postings on the Alternate Data tab at www.shadowstats.com.
U.S. Dollar Indices. The Shadow Government Statistics’ Financial-Weighted U.S. Dollar Index (FWD) is based on dollar exchange rates weighted for respective global currency trading volumes. For January 2009 the FWD gained 0.92% for the month after a 2.41% decline in December 2008. The January 2009 monthly average index level of 53.90 (base month of January 1985 = 100.00) was up by 14.98% from January 2008, up from December’s 12.8% annual gain. As of February 13th, the FWD stood at 54.95.
Also rebounding in January 2009 was the Federal Reserve’s Major Currency Trade-Weighted U.S. Dollar Index (TWD). The January average rose by 0.41% for the month, following a 2.47% decline in December. The January 2009 index level of 58.30 (base month of January 1985 = 100.00) was up by 10.88% from January 2008, versus an annual 9.49% increase in December. As of February 13th, the TWD closed at 59.31.
The differences in the two series can be accounted for largely by the much heavier weighting of the Canadian dollar in the TWD series.
General background note: Historical data on both dollar series are available for download on the Alternate Data page of www.shadowstats.com. See the July 2005 SGS Newsletter for methodology.
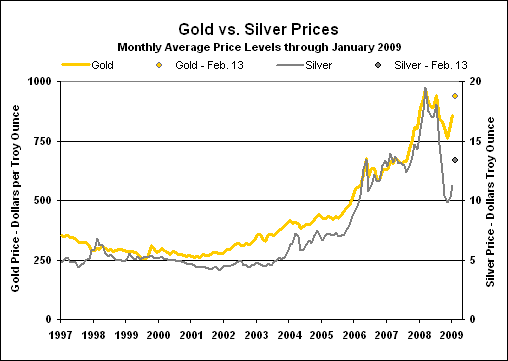
Gold and Silver — Gold and silver have benefited in recent weeks from safe-haven flight as well as increasing concern as to the prospects for the purchasing power of the U.S. dollar. With increasing global financial and political instability, and with the long-range inflation and dollar problems for the United States, as discussed earlier, the long-range outlook for the precious metals could not be better. In the short-term, however, extreme price volatility continues as a fair risk, as seen during the last year.
Falling from its all-time high London afternoon fix of $1,011.25 per troy ounce on March 17, 2008, amidst extreme volatility, gold hit a subsequent bottom of $712.50 in October. It closed February 13th at $935.50. In like manner, silver plunged from its March 17, 2008 high of $20.92 per troy ounce, hitting a subsequent low close of to $8.88 in October. It closed on February 13th at $13.37.
For January 2009 (per Kitco.com for both and silver prices), the monthly average London gold afternoon fix was $858.68 per troy ounce, up from $816.09 in December. Silver averaged $11.29 per troy ounce in January, up from $10.29 in December.
Inflation-Adjusted Historic Gold and Silver Highs. Even with the March 17, 2008 historic high of $1,011.25, the prior all-time high of $850.00 (London afternoon fix, per kitco.com) of January 21, 1980 still has not been hit in terms of inflation-adjusted dollars. Based on inflation through December 2008, the 1980 gold price peak would be $2,297 per troy ounce, based on not-seasonally-adjusted-CPI-adjusted dollars, and would be $6,650 per troy ounce in terms of SGS-Alternate-CPI-adjusted dollars.
In like manner, the all-time high price for silver in January 1980 of $49.45 (London afternoon fix, per silver institute.org) has not been hit since, including in terms of inflation-adjusted dollars. Based on inflation through November 2008, the 1980 silver price peak would be $134 per troy ounce, based on not-seasonally-adjusted-CPI-adjusted dollars, and would be $387 per troy ounce in terms of SGS-Alternate-CPI-adjusted dollars.
General background note: As discussed in the Hyperinflation Special Report (April 2008), the eventual collapse of the U.S. dollar — the world’s reserve currency — will force the creation of a new international currency system. Gold likely will be structured into any replacement system, in an effort by those organizing the new currency structure to gain public acceptance.
The updated gold versus oil, Swiss franc and silver graphs show January monthly average price levels, as well as added points for closing prices at February 13th, with gold at $935.50, silver at $13.37, oil at $37.51 and the Wall Street Journal’s closing rate for the Swiss franc at $0.8616. As current market distortions subside, all four measures should trade significantly higher in the months ahead, eventually breaking the highs seen otherwise during 2008.

End of Section Two
(View all Sections of this Issue)