Issue Number 49: Overview
Section One
(View all Sections of this Issue)
__________
OVERVIEW - OPENING COMMENTS
"Worst Economy Since…"
Moves to Mid-1970s and Earlier
It may be hard for the federal government to offer $787 billion dollars in stimulus without having a noticeably positive impact on economic activity, but it can be done. Despite prior hype on employment, annual growth in inflation-adjusted retail sales is the first major economic measure to trigger a legitimate "worst since the Great Depression" comparison. The economic contraction now is severe enough to consume the stimulus without affected business activity ever breaking above water. Also, too little of the stimulus package addresses the structural issues driving the downturn. Even if the structural problems were addressed, fundamental recovery would be measured in years, at best. Further, the systemic-solvency crisis is deepening again, with bailout exposures opening up to almost unlimited costs. That situation increasingly looks like it will involve the nationalization of major banks.
The financial markets remain incredibly volatile, unstable and dangerous. Gold has rallied not only from mounting flight-to-safety concerns, but also with a touch of renewed inflation fear. Those betting on the relative safety of the U.S. Treasuries and U.S. dollar underestimate the relative depths and severity of the economic and systemic-solvency crises in the United States versus the rest of the world.
Also underestimated is the upside inflation risk in the United States. The costs to the system of the stimulus and bailout packages will be inflation, with risks of high inflation moving to hyperinflation as early as the end of this year.
Structural Depression Largely Untouched by Stimulus and Bailout Packages. As discussed in greater detail in Shadow Government Statistics Newsletters Nos. 47 and 48 (incorporated here by reference), the deepening economic contraction currently roiling regular commerce and business activity in the United States fundamentally is structural in nature, and it is not subject to an easy or quick fix. The cures being offered by the government should have only limited positive impact on the economy, but they do offer the promise of much higher inflation. They also significantly increase the risk of triggering a U.S. hyperinflation — such was inevitable, based on extreme pre-crisis fiscal abuses — as early as the end of this year. My best estimate on U.S. hyperinflation timing remains in the period of late-2009 to 2014.
The current crisis has developed and evolved during the last four decades, as trade and economic policies — counter to the interests of much of the U.S. citizenry — have resulted in the significant loss of high paying domestic production or technical jobs, where production operations have been lost to offshore competition, or simply moved offshore.
Direct impact of this circumstance has been seen in deteriorating U.S. household income, net of taxes and inflation. Using the government’s numbers, real (inflation-adjusted) average weekly earnings (Bureau of Labor Statistics) in December 2008 were down 14% from the October 1972 high. Average weekly earnings never regained their pre-1973/1975 recession high. Partially as a result, households that once tended to have one breadwinner, now tend to have multiple breadwinners, out of necessity. Even so, the latest poverty survey published by the Census Bureau showed that real household income (average and median) in 2007 still had not regained is pre-2001 recession highs.
The numbers are much worse if the SGS-Alternate Consumer Inflation estimates are used for deflating the income measures. The SGS measure is an attempt to reflect the rate of inflation inherent in maintaining a constant standard of living, as reflected in earlier CPI reporting methodologies. In the real world, average household income has not kept up with the cost of maintaining a constant standard of living, and that shortfall has been met in recent decades, at least partially, by consumers taking on increasing levels of debt.
Indeed, without growth in inflation-adjusted income, real economic growth cannot be sustained, other than through temporary measures such as debt expansion. Aware of this circumstance, former Federal Reserve Chairman Alan Greenspan et al did their best to keep the economy growing in recent decades by encouraging unsustainable debt growth, with a resultant economic growth effectively borrowed from the future. The current downturn is akin something of a payback period.
What I refer to as the "debt standard" was created during the Franklin Roosevelt Administration as replacement for the gold standard. Its expansion through the decades has led to excessive use of debt by government, industry and individuals. In recent years, creative derivative and structured financial instruments have allowed for even greater leverage, building debt excess upon debt excess.
Now, as the debt excesses begin to implode, the federal government, and unusually large segments of local and state governments and the commercial and private sector, face financial distress and possible insolvency. Fallout has been seen in the rapidly intensifying economic contraction.
The current recession, however, began before the solvency/liquidity issues came to a head and was itself instrumental in triggering the systemic liquidity crisis. The systemic liquidity crisis, in turn, has severely exacerbated the economic contraction. Neither President Obama’s stimulus package or Messrs. Geithner and Bernanke’s still-evolving systemic bailout program will turn the economy fundamentally or provide any lasting prop for the equity market. What these packages do promise is an ongoing effort to maintain a functioning system of depository institutions, and higher — much higher — inflation.
Intensifying Economic Pain Prior to 2010 Mid-Term Election. The "American Recovery and Reinvestment Act of 2009" awaits Mr. Obama’s signature. The process that generated the legislation reflected Washington at its worst, with the dominant Democrats pushing through a package that received limited public airing and virtually no Republican support. Given the likelihood that the package will do little to relieve the financial suffering of the electorate before next year’s mid-term election, perhaps the Republicans in Congress are hoping to use such a circumstance to regain seats in Congress. Both parties and related special interests are playing politics as usual with an economic crisis that is dangerous enough to threaten national security.
Given the long lead time of a number the package’s stimuli, and the limited patience of the U.S. populace, however, refinements to the stimulus package or even an Obama Stimulus II may be a fair shot before the 2010 election. Indeed, while the U.S. economic downturn is unusually deep, and government stimulus efforts should help some, the relative positive impact on economic activity likely will not be noticeable, in aggregate, as the positive impact could be swallowed and masked by the severity of the current downturn. Last year’s Bush stimulus package suffered a similar fate, before the downturn intensified. The current stimulus package, however, already has had the undesirable effect of shifting global market focus to the faltering fiscal condition of the U.S. government.
In terms of historical comparisons, it also is worth keeping in mind that what brought the U.S. out of the Great Depression was the outbreak of war in Europe, and military orders received by U.S. manufacturers, not the various social and spending programs introduced by the Roosevelt Administration (see the Reporting/Market Focus Section).
While Mr. Obama — in both his campaign rhetoric and comments as President — has expressed some understanding of the nature of the structural downturn, his package was limited in addressing such issues. For example, rebuilding the nation’s infrastructure — usually viewed as a government (though not always federal) function — indeed would stimulate activity and create new jobs, at least for a while.
Yet, in an early version of the bill, there also was a "Buy American" clause for items such as steel for bridges, an area of clear stimulus for the flagging U.S. steel industry. Foreign complaints threatened under the World Trade Organization (WTO) treaty, however, caused the Administration effectively to scrap that concept, opening the potential of shifting part of the U.S. tax-payer funded stimulus to a U.S. trading partner. The anti-U.S. nature of the WTO is an example of the trade policies of recent decades that have helped to neuter a fair portion of a once much mightier U.S. industrial base.
Other than to suggest that the private sector and the marketplace usually do a much better job than Uncle Sam in running or determining a viable business, I am not going to get into the relative merits, or lack of same, of the federal government intervening in the private sector. Such applies to the government stepping in to salvage or control existing private enterprise such as the banking and automotive industries; as well as to the federal government trying to establish new industry that otherwise already is nascent in the private sector.
If high paying production jobs are gone, the development of new industries and new jobs in fields such as alternate energy and healthcare information is a natural counterpoint. The stimulus funding here, however, is stretched out over time, with the bulk of the outlays in 2011 and beyond.
As new industries develop, though, there is not much to prevent work or production from being outsourced to cheaper labor environments offshore. Such will remain an ongoing structural issue. Irrespective of the lack of desirability of trade conflicts, the U.S. economic problems ultimately come down to trade considerations in terms of the simple economic self-interest of many in the United States. Increasingly, trade matters could be pushed to the fore, particularly if there is an Obama Stimulus II.
Tax cuts almost always are a plus, but their impact pretty much disappears after 2010. I am not going to get into non-stimulus, political-agenda issues and other gimmicks that were added into the package often because public debate of controversial matters could be dodged easily.
Based on the Congressional Budget Office (CBO) assessment of the final $787 billion stimulus package, only $584 billion will be spent before the 2010 election, $185 billion before September 30, 2009 and $399 billion in fiscal 2010. Traditionally, fiscal stimulus has a six- to nine-month lead time versus economic activity, so little economic gain from the package is likely before fourth-quarter 2009.
The CBO’s estimates of economic impact from the package, measured fourth-quarter over fourth-quarter, are an addition of 1.4 to 3.8 percentage points in annual real GDP growth in 2009, 1.1 to 3.3 percentage points in 2010. In terms of civilian employment, fourth-quarter 2009 purportedly could see a cumulative improvement of 0.8 to 2.3 million jobs, fourth-quarter 2010 could see a cumulative improvement of 1.2 to 3.6 million jobs, relative to where employment would have been without the stimulus. The CBO’s estimates, however, tend to be overly optimistic. In the current circumstance, for example, the CBO projects employment growth and broad-based economic recovery in 2010, even without the stimulus bill.
Economic Activity Continues to Sink, Despite Occasional Bottom-Bouncing. The broad economy pretty much continued in freefall in the latest round of economic reporting, in terms of annual pace of decline, although there was some bottom-bouncing in the monthly retail sales number for January. There may be other short-term monthly bottom-bouncing in series such as industrial production. What is at work here is the natural result of the bottom falling out of a market. Activity rarely falls to zero, but it often will bounce along a plateau of low-level activity, before plunging anew. In such circumstances, the year-to-year change usually continues to deepen or temporarily stalls at a low level.
Record Merchandise Trade Deficit in 2008 — Cumulative 4.7 Million Jobs Lost. The U.S. trade deficit, as reflected in the Net Exports account of GDP, is a net subtraction from total U.S. economic activity, where U.S. exports reflect domestic production (a plus), and U.S. imports reflect lost domestic production (a minus). Based on average annual nominal (not adjusted for inflation) GDP of $14,280.7 billion dollars, net exports of a negative $665.1 billion dollars, and average annual civilian employment of 145.362 million, GDP (net of net exports) per employed individual works out to about $102,800. The implied jobs lost to the trade deficit on that basis is a cumulative 6.5 million, but recalculation based on inflation-adjusted activity — a more appropriate measure given oil prices — works out at 4.7 million.
As noted in the Trade Deficit comments in the Reporting Perspective section, for all of 2008, the total deficit on a balance of payments basis narrowed to $677.1 billion, from $700.3 billion in 2007. The reported improvement, however, was due to a purported increase in the "services" surplus, which is little more than a guesstimate.
The "goods" deficit actually widened minimally for the year, to $799.9 billion in 2008, from $794.5 billion in 2007. For the year, the largest trade deficit was with China, at $266.3 billion in 2008, up from $256.2 billion in 2007. Encompassing the second and third worst deficit accounts, the trade deficit with NAFTA partners Canada and Mexico narrowed to $138.6 billion in 2008, from $142.8 billion in 2007. The deficit with Canada increased to $74.2 billion in 2008, from $68.2 billion in 2007, while the deficit with Mexico shrank to $64.4 billion in 2008, from $74.6 billion in 2007. The deficit with Japan also shrank, down to $72.7 billion in 2008 versus $82.8 billion in 2007. Among OPEC members (including Ecuador in both 2007 and 2008), the U.S. trade deficit soared to $175.6 billion in 2008, versus $127.4 billion in 2007, basically reflecting the significantly higher annual average import oil price in 2008 ($95.23 per barrel in 2008, versus $64.28 in 2007).
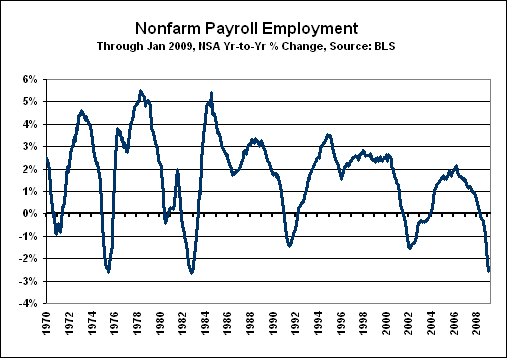
Nonfarm Payroll Losses Much Worse than Headline Reporting (593K Headline versus 1,680K Revised). As discussed in the Employment/Unemployment comments in the Reporting Perspective section, the January 2009 headline payroll contraction, reported at a loss of 598,000 for the month, likely was shy of reality, once again. As reported, though, and as shown in the preceding graph of annual growth in nonfarm payrolls, January 2009 payroll employment was down by 2.6% against January 2008, the steepest decline since the depths of the double-dip recession in the early 1980s. A similar jobs loss in February 2009 would push the annual rate of decline to its lowest level since the 1957/1958 recession, which was a delayed post-Korean War slowdown.
The next graph shows what I call the Concurrent Seasonal Factor Bias, which appears to be built into the current monthly reporting of payrolls (see the Reporting/Market Focus in SGS Newsletter No. 43). Over the period of a year, seasonally-adjusted and unadjusted payroll series should equal each other, with the seasonal factors simply redistributing jobs over time to neutralize the effects of patterns of regular change seen in reporting during the holiday shopping season, the school year, etc. An issue with the payroll series, however, is that the seasonal factors are recalculated each month, as the series develops, which has highlighted and made possible an unusual reporting pattern. Where year-to-year change is an alternate way of eliminating seasonal effects in data, the year-to-year change in the monthly seasonally-adjusted and unadjusted series should be reasonably close, but they are not.
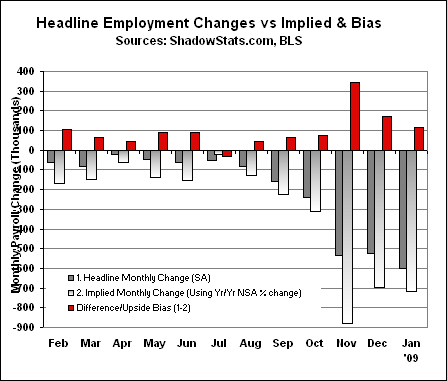
In 11 of the last 12 months, and in 20 of the last 22 months in which I have tracked this particular issue, applying the year-to-year change in unadjusted payroll numbers to the seasonally-adjusted payroll numbers has suggested that reality has been significantly weaker than indicated by the headline payroll numbers as reported by the BLS. The headline numbers are what drive the financial markets. Although the numbers are revised in the next two months of reporting, and in the annual benchmark revisions, the markets rarely take note of revisions, concentrating instead on the latest headline report.
The difference is that if only the headline numbers were tallied, there was a cumulative jobs loss of 593,000 in the 20 months ended November 2008 (December 2008 and January 2009 still are subject to monthly revisions). The SGS estimates made based on the same data published with the headline numbers totaled 1,840,000. In terms of later BLS revisions, total jobs lost in the same period were 1,343,000 before, and 1,680,000 after, the latest benchmark revision.
"Weakest Since …" Estimates Move Back in Time. As shown in the following graphs, annual growth rates in key economic series have continued to tumble. The three-month moving average of the annual decline in housing starts now stands at a contraction of 43.0%, the weakest showing since the double-dip 1980’s recession.
With the annual contraction in the three-month moving average of real retail sales now at 9.4%, it has hit the lowest level of growth in the history of the two historical series that are combined in order to track the numbers back into the late-1940s. Aside from any distortions around World War II, this likely is the weakest showing since the Great Depression.
With annual contraction in industrial production at 7.8%, such is the weakest showing since the 1973/1975 recession.
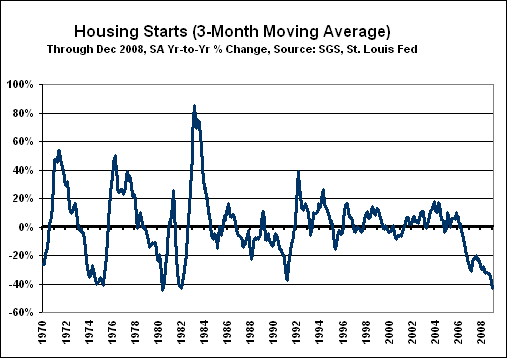
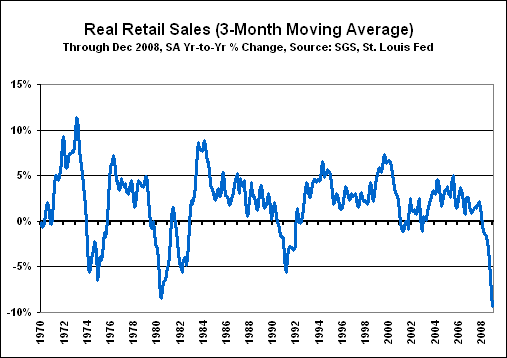
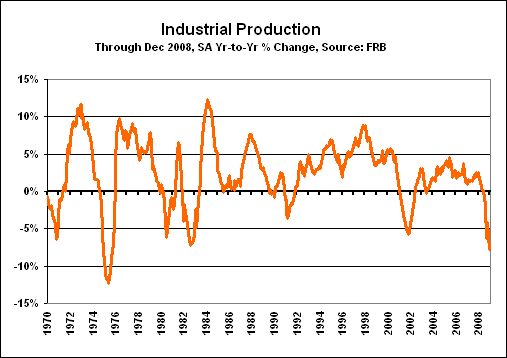
As discussed in the Reporting Perspective, a depression is defined (SGS) as a recession where peak-to-trough contraction in inflation-adjusted economic activity exceeds 10%. That level of contraction currently is exceeded in annualized terms by fourth-quarter 2008 real retail sales, industrial production, new orders for durable goods and housing starts.
Bailout Package Falters as Treasury and Fed Promise More Cash. Treasury Secretary Geithner put forth his latest version of the financial system bailout, promising adequate capital for banks, new stress tests to see which banks are worthy of saving, a public-private investment fund to buy bad assets from troubled banks, extensions of FDIC guarantees, and greater political oversight of banks receiving federal money. With no details provided beyond the usual huffing, puffing and wishful thinking, the stock market tanked in response.
Although the depository system has been salvaged, at least temporarily, the banking system itself remains effectively insolvent, with both the Fed and the Treasury throwing around new trillion-dollar promises as though a trillion dollars is nothing anymore (it quickly would become so in a hyperinflation). Despite some signs of systemic stability, as evidenced by renewed growth in broad money supply, there also are possible signs again of increasing stress (see M3 comments that follow). The depths of the economic and systemic solvency crisis are so severe, the Fed and the Treasury likely are not going to be able to stabilize the banking system without eventual nationalization of at least some of the larger banks. However it unfolds, Messrs. Bernanke and Geithner will create and spend whatever money they have to in order to prevent a systemic collapse, and they will do so until such point as they may have destroyed the purchasing power of the U.S. dollar.
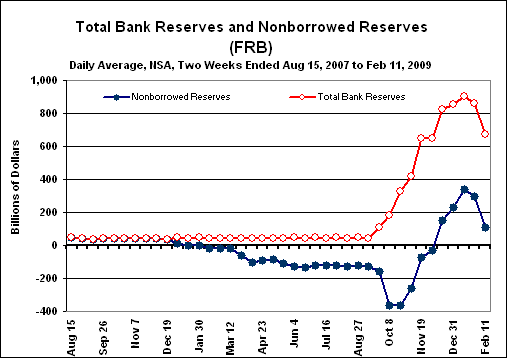
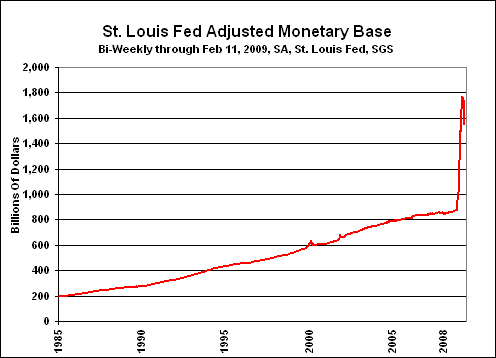
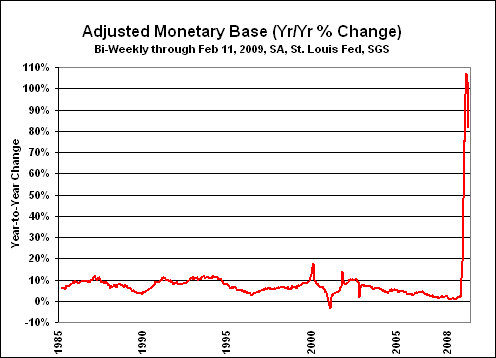
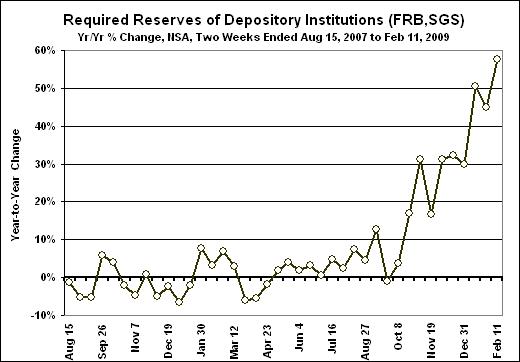
Annual Monetary Base Growth Slows to 81.9% but Required Reserves Jump 57.7%. Friday’s (February 13th) release of bank reserves data showed the annual growth in the St. Louis Fed’s Adjusted Monetary Base easing to 81.9% in the two weeks ended February 11th, versus 103.3% in the two weeks ended January 28th, and a record 107.2% in the two weeks ended January 14th. The slowing growth entirely was due to declining excess reserves, where banks had been parking funds they might otherwise have been lending. If those funds have been shifted into the regular stream of commerce, such is positive news for systemic stability.
Of greater significance to the broader money measures, however, annual growth in required reserves (seasonally-unadjusted) surged to 57.7% in the latest two weeks, up from 45.0% in the prior period and versus 50.4% in the period before that. This record post-World War II annual growth suggests ongoing growth in depository accounts.
The following four graphs are updated for the latest detail in terms of bank reserves and the monetary base (basically currency plus bank reserves). Again, the most significant development is in the continued surge in required reserves growth.

January Annual M3 Growth at 12.0%. As shown above, the annual growth in the SGS-Ongoing M3 measure for January 2009 is estimated at 12.0%, up from 11.4% in December and from the near-term growth trough of 9.8% in November. In the latest reporting (week ended February 2nd), however, weekly declines in seasonally-adjusted M2 and large time deposits largely offset a gain in institutional money funds. While weekly growth patterns vary sharply, any continued faltering of growth in the published M3 components could be a signal of renewed and intensified stress in the banking system. The reserve changes discussed earlier (two weeks ended February 11th), however, suggest increasing broad money growth ahead. Detail will continue in Flash Updates as developments warrant.
The downtick in January’s annual M1 growth just reflects a shifting of funds from checking accounts (M1) to savings accounts (M2).
Inflation Remains the Concern. Mr. Bernanke is dedicated to debasing the U.S. dollar, in order to create inflation and to avoid deflation (he outlined such plans as a Federal Reserve Governor in 2002). The broad money supply has started to grow again, annual growth in required reserves at depository institutions is soaring, and the velocity of money likely is rising again, all suggestive of double-digit consumer inflation later in 2009.
Yet, with some early suggestion of a possible renewed stall in the growth of the broader money measures, the systemic solvency crisis may be intensifying again, frustrating Fed efforts to get more cash into the system. Ahead lies an opportunity for the Fed, with heavy Treasury fundings needed to cover the stimulus package and an otherwise recession-driven deterioration in the federal government’s fiscal condition. With likely light foreign and domestic demand for the Treasury securities, Federal Reserve monetization of that debt would be a reasonably easy option for Mr. Bernanke to help reignite inflationary pressures. The Fed mentioned the possibility of such purchases in its most recent FOMC statement.
All factors considered, the estimated timing for the onset of the hyperinflationary great depression discussed in the Hyperinflation Special Report of April 8, 2008 remains in a range of late-2009 to 2014.
Over the shorter term, volatile oil prices still will move the CPI. With both oil and gasoline prices having bottomed in December — at least temporarily — the January 2009 CPI likely will show a seasonally-adjusted monthly increase and likely will hold around zero on a year-to-year basis, not showing any further significant softening relative to December. Any renewed strength in oil prices would start to boost short-term consumer inflation concerns, anew.
U.S. Dollar Fundamentals Weak — U.S. Generally Worse Off than Rest of World. Despite ongoing strength in the U.S. dollar, I remain extremely bearish on the U.S. currency over the long haul. As discussed later, the underlying fundamentals remain terrible, and despite recent market hype of relatively stronger fundamentals in the U.S. versus its major European trading partners, the reverse is more accurate.
The deepening economic contraction and systemic solvency crisis in the U.S. are much worse than are the related problems among the United States’ major trading partners, particularly against the backdrop of an effective U.S. bankruptcy that was in place before the current crises broke (see the Reporting/Market Focus of prior SGS Newsletter No. 48).
The U.S. dollar ultimately faces a massive selloff, along with dumping of foreign held dollar-denominated assets. The timing of this remains open, but it could break at any time, with little warning. It also could linger in the offing for months. At such time as the greenback comes under heavy selling pressure, U.S. dollar-denominated commodities, particularly oil, will suffer upside dollar pricing pressures as a result of the dollar weakness.
Over the long-term, the broad outlook is little changed. The markets remain highly volatile and dangerous. As to the equity and credit markets, extremely difficult times still lie ahead, with impaired corporate revenues and profits (and the economy) worse than current expectations, and with long-term interest rates likely to move much higher. Rates should rise as financial-panic pressures subside and funds flow out of U.S. Treasuries in response to ongoing dollar debasement (inflation). Also, over the long-term, the U.S. dollar should suffer significant selling, with resulting upside pressure on domestic long-term interest rates. Over the long-term, both gold and silver should rally sharply, in response to the greenback’s eventual problems as well as to mounting flight-to-safety issues.
PLEASE NOTE: A "General background note" provides a broad background paragraph on certain series or concepts. Where the language used in past and subsequent newsletters usually has been or will be identical, month-after-month, any text changes in these sections will be highlighted in bold italics upon first usage. This is designed so that regular readers may avoid re-reading material they have seen before, but where they will have the material available for reference, if so desired.
Alternate Realities. This section updates the Shadow Government Statistics (SGS) alternate measures of official GDP, unemployment and CPI reporting. When a government economic measure does not match common public experience, it has little use outside of academia or the spin-doctoring rooms of the Federal Reserve, White House and Wall Street. In these alternate measures, the effects of gimmicked methodological changes have been removed from the official series so as to reflect more accurately the common public experience, as embodied by the pre-Reagan-Era CPI and GDP and the pre-Clinton Era unemployment rate. Methodologies for the GDP and CPI series are discussed in the August 2006 SGS.
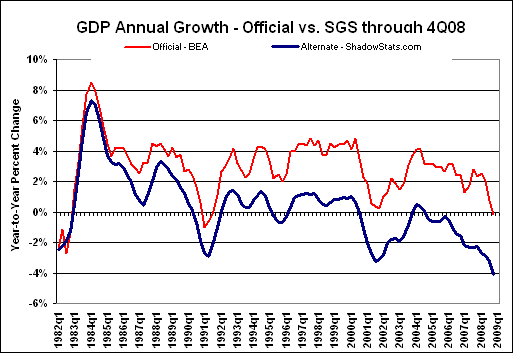
GDP. The alternate fourth-quarter 2008 GDP growth reflects the "advance" estimate, with many of the methodological gimmicks of recent decades removed. The alternate fourth-quarter inflation-adjusted annual growth rate (year-to-year, as opposed to the popularly-touted annualized quarter-to-quarter rate) for GDP was a decline of roughly 4.1% versus the official year-to-year contraction of 0.2%. The official, annualized real quarter-to-quarter change stands at a 3.8% contraction. While the quarterly growth number is popularly followed, its significant inaccuracies are expanded to the fourth-power in reporting. The alternate measure safely would have shown an annualized quarterly contraction in the fourth quarter of more than seven-percent.
General background note: Historical data on both the official and SGS-Alternate GDP series are available for download on the Alternate Data page of www.shadowstats.com. The Alternate GDP numbers tend to show deeper and more protracted recessions than have been reported formally or reflected in related official reporting. Nonetheless, the patterns shown in the alternate data are broadly consistent with the payroll employment and industrial production series, which are major indicators used by the National Bureau of Economic Research in determining the official timing of U.S. business cycles.
Unemployment Rate. Shown are two official seasonally-adjusted unemployment measures, U.3 and U.6, and the SGS-Alternate Unemployment Measure. The various measures moved sharply higher again in January, reflecting continued rapid deterioration in labor-market conditions. The January rates stood respectively at 7.6%, 13.9% and 18.0%, up from 7.2%, 13.5% and 17.5% in December.
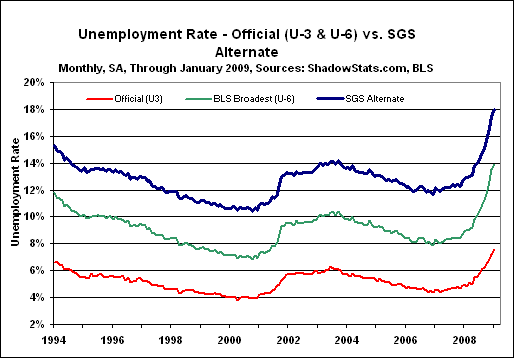
General background note: U.3 is the popularly followed unemployment rate published by the Bureau of Labor Statistics (BLS), while U.6 is the broadest unemployment measure published by the BLS. U.6 is defined as total unemployed, plus all marginally attached workers, plus total employed part time for economic reasons, as a percent of the civilian labor force plus all marginally attached workers. Marginally attached workers include the discouraged workers who survived redefinition during the Clinton Administration. The SGS-Alternate Unemployment Measure simply is U.6 adjusted for an estimate of the millions of discouraged workers defined away during the Clinton Administration — those who had been "discouraged" for more than one year.
General background note: Historical data on both the official and SGS-Alternate unemployment series are available for download on the Alternate Data page of www.shadowstats.com. The Alternate numbers are reported from the 1994 series redefinitions forward. It is planned to take the alternate series further back in time.
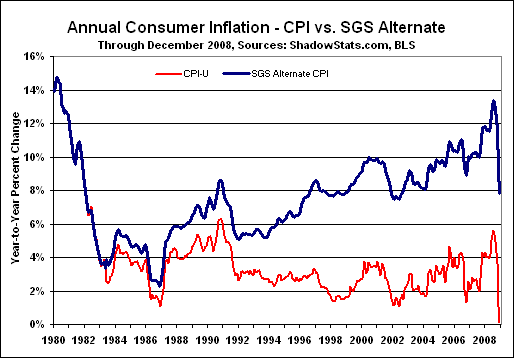
CPI. Once again absorbing sharp declines in energy prices, December’s annual full inflation rates eased sharply, while "core" inflation continued to soften as well. Curiously, the PCE Deflator (I.5 in the accompanying table), which tends to track closely with the C-CPI-U (I.6), again showed annual inflation holding well above the C-CPI. Such remains suggestive of conflicting issues in handling the energy cost decline in the government’s various inflation measures.
With oil and gasoline prices moving higher in January, the December annual inflation rates should be at or near the trough of the current cycle. Spiking broad money growth threatens much higher inflation ahead this year, with risk of a sharp dollar decline and oil price spike offering near-term upside risk.
General background note: Historical data on both the official and SGS-Alternate CPI series are available for download on the Alternate Data page of www.shadowstats.com. The Alternate CPI numbers tend to show significantly higher inflation over time, generally reflecting the reversal of hedonic adjustments, geometric weighting and the use of a more traditional approach to measuring housing costs, measures all consistent with the reporting methodology in place as of 1980. Available as a separate tab at the SGS homepage www.shadowstats.com is the SGS Inflation Calculator that calculates the impact of inflation between any two months, 1913 to date, based on both the official CPI-U and the SGS-Alternate CPI series.
Please Note: At Subscriber request, we have expanded the consumer inflation list to 10 ten indices, adding the CPI-W (urban wage earners and clerical workers), which tracks the more popularly followed CPI-U closely, but which is more heavily weighted toward the basic necessities of living. Accordingly, the I.1 to I.10 numbering scale has been changed to reflect the additions.
|
Ten Levels of Consumer Inflation
Annual Inflation for September to December 2008 |
|||||
|
Measure
|
Sep
|
Oct
|
Nov
|
Dec
|
|
|
I.1
|
Core PCE Deflator (BEA)
|
2.3%
|
2.0%
|
1.9%
|
1.7%
|
|
I.2
|
Core Chained-CPI-U (BLS)
|
2.2%
|
1.9%
|
1.6%
|
1.3%
|
|
I.3
|
Core CPI-U (BLS)
|
2.5%
|
2.2%
|
2.0%
|
1.8%
|
|
I.4
|
Core CPI-W (BLS)
|
2.4%
|
2.1%
|
2.0%
|
1.7%
|
|
I.5
|
PCE Deflator (BEA)
|
4.1%
|
3.2%
|
1.4%
|
0.6%
|
|
I.6
|
Chained-CPI-U (BLS)
|
4.3%
|
3.3%
|
0.7%
|
-0.5%
|
|
I.7
|
CPI-U (BLS)
|
4.9%
|
3.7%
|
1.0%
|
0.1%
|
|
I.8
|
CPI-W (BLS)
|
5.4%
|
3.8%
|
0.7%
|
-0.5%
|
|
I.9
|
Pre-Clinton CPI-U (SGS)
|
8.3%
|
6.9%
|
4.4%
|
3.4%
|
|
I.10
|
SGS Alternate Consumer Inflation
|
12.9%
|
11.6%
|
9.3%
|
7.8%
|
|
Sources: SGS, BLS (Bureau of Labor Statistics), BEA (Bureau of Economic Analysis).
Notes: I.1 to I.4 reflect the core inflation rates, respectively, of the substitution-based personal consumption expenditure (PCE) deflator, the substitution-based Chained-CPI-U, and the geometrically-weighted CPI-U and CPI-W. I.5 to I.8 are the same measures, as standardly reported, with energy and food inflation included. The CPI-U (I.7) "all urban consumers" is the measure popularly followed by the financial press, when the media are not hyping core inflation. The CPI-W (I.8) "urban wage earners and clerical workers is a narrower measure, more heavily weighted in basics such as gasoline, and used in calculating cost-of-living adjustments for items such as Social Security Payments. I.9 is the CPI-U with the effects of geometric weighting (Pre-Clinton Era as estimated by SGS) reversed. This is the top series in the CPI graph on the SGS home page www.shadowstats.com. I.10 reflects the SGS Alternate Consumer Inflation measure, which reverses the methodological gimmicks of the last 25 years or so, plus an adjustment for the portion of Clinton-Era geometric weighting that is not otherwise accounted for in BLS historic bookkeeping. |
|||||
End of Section One
(View all Sections of this Issue)