Issue Number 50: Markets Perspective
Section Two
(View all Sections of this Issue)
MARKETS PERSPECTIVE
The three best bets I can offer are: (1) The U.S. economy does not face imminent recovery. (2) The U.S. dollar faces an extreme sell-off against most major currencies. (3) The U.S. economy will see double-digit inflation driven by factors other than economic demand; a circumstance that eventually will evolve into hyperinflation. None of these factors is happy for the traditional equity and credit markets. The timing on the economy is ongoing. Despite intermittent hype and occasional bottom-bouncing, the better-quality economic reporting will show ongoing recession/depression and a likely grudging recognition of same by Wall Street. Timing on the dollar and inflation remain open, but the moves are just a matter of time, with implications so severe for the system that they hard to ignore. The markets remain unstable and extremely dangerous.
|
Closing Financial-Market Indicators at April 17, 2009
Indicator 2nd-Qtr-to-Date 2009 1st-Qtr 2009 Year-End 2008 |
|||||||||||
|
|
Level |
YTD |
Yr/Yr |
Level |
YTD |
Yr/Yr |
Level |
Yr/Yr |
|
||
|
|
|
|
|
|
|
|
|
|
|
||
|
Equity Market(1) |
|
|
|
|
|
|
|
|
|
||
|
DJIA |
8,131.33 |
-7.35% |
-35.57% |
7,608.92 |
-13.30% |
-37.95% |
8,776.39 |
-33.84% |
|
||
|
S&P 500 |
869.60 |
-3.73% |
-35.48% |
797.87 |
-11.67% |
-39.68% |
903.25 |
-38.49% |
|
||
|
DJ Wilshire 5000 |
8,889.25 |
-2.18% |
-36.32% |
8,001.90 |
-11.94% |
-39.98% |
9,087.17 |
-38.68% |
|
||
|
NASDAQ Comp |
1,673.07 |
6.09% |
-28.58% |
1,528.59 |
-3.07% |
-32.93% |
1,577.03 |
-40.54% |
|
||
|
|
|
|
|
|
|
|
|
|
|
||
|
Credit Market (2) |
|
|
|
|
|
|
|
|
|
||
|
Fed Funds (3) |
0.00% |
0bp |
-225bp |
0.00% |
0bp |
-225bp |
0.00% |
-425bp |
|
||
|
3-Mo T-Bill |
0.14% |
3bp |
-109bp |
0.21% |
10bp |
-117bp |
0.11% |
-325bp |
|
||
|
2-Yr T-Note |
0.99% |
23bp |
-114bp |
0.81% |
5bp |
-81bp |
0.76% |
-229bp |
|
||
|
5-Yr T-Note |
1.91% |
36bp |
-99bp |
1.67% |
12bp |
-79bp |
1.55% |
-190bp |
|
||
|
10-Yr T-Note |
2.98% |
73bp |
-77bp |
2.71% |
46bp |
-74bp |
2.25% |
-179bp |
|
||
|
30-Yr T-Bond |
3.79% |
110bp |
-75bp |
3.56% |
87bp |
-74bp |
2.69% |
-176bp |
|
||
|
|
|
|
|
|
|
|
|
|
|
||
|
Oil(4) US$ per Barrel |
|||||||||||
|
West Texas Int. |
50.33 |
1.35% |
-56.18% |
49.66 |
11.35% |
-51.12% |
44.60 |
-53.55% |
|
||
|
|
|
|
|
|
|
|
|
|
|
||
|
Currencies/Dollar Indices(5) US$/Unit |
|||||||||||
|
Pound Sterling |
1.4784 |
1.13% |
-25.74% |
1.4300 |
-2.18% |
-27.32% |
1.4619 |
-26.33% |
|
||
|
Euro |
1.3026 |
-6.42% |
-18.30% |
1.3261 |
-4.73% |
-16.10% |
1.3919 |
-4.68% |
|
||
|
Swiss Franc |
0.8566 |
-8.57% |
-14.13% |
0.8776 |
-6.33% |
-12.94% |
0.9369 |
6.14% |
|
||
|
Yen |
0.0101 |
-8.52% |
2.99% |
0.0101 |
-8.43% |
0.71% |
0.0110 |
23.04% |
|
||
|
Canadian Dollar |
0.8230 |
0.73% |
-16.82% |
0.7933 |
-2.90% |
-17.87% |
0.8170 |
-19.27% |
|
||
|
Australian Dollar |
0.7210 |
3.25% |
-23.05% |
0.6925 |
-0.83% |
-24.17% |
0.6983 |
-20.43% |
|
||
|
Weighted Currency Units/US$ (Jan. 1985 = 100) |
|||||||||||
|
Financial (FWD) |
54.05 |
2.97% |
21.41% |
54.95 |
4.04% |
22.14% |
52.49 |
11.07% |
|
||
|
Change US$/FX |
– |
-2.89% |
-17.63% |
– |
-3.88% |
-18.13% |
– |
-9.96% |
|
||
|
Trade (TWD) |
59.35 |
3.85% |
17.80% |
59.89 |
4.79% |
18.38% |
57.15 |
8.40% |
|
||
|
Change US$/FX |
– |
-3.71% |
-15.11% |
– |
-4.58% |
-15.53% |
– |
-7.75% |
|
||
|
|
|
|
|
|
|
|
|
|
|
||
|
Precious Metals(6) US$ per Troy Ounce |
|||||||||||
|
Gold |
870.50 |
0.09% |
-7.98% |
916.50 |
5.38% |
-1.82% |
869.75 |
4.32% |
|
||
|
Silver |
11.98 |
11.03% |
-35.45% |
13.11 |
21.50% |
-27.13% |
10.79 |
-26.90% |
|
||
|
|
|
|
|
|
|
|
|
|
|
|
|
|
bp: Basis point or 0.01%. (1) Wall Street Journal, dowjonesindexes.com. (2) Treasuries are constant-maturity yield, U.S. Treasury. (3) Current Fed Funds target is 0.00% to 0.25%. (4) Department of Energy. (5) Shadow Government Statistics, Wall Street Journal, Federal Reserve Board (see Dollar Index Section for definitions). |
|
||||||||||
General background note: I continue to argue that investors should be looking at the long-term and at preserving their wealth and assets in what eventually will become a hyperinflationary great depression. With severe economic, inflation and currency displacements ahead in the United States, those who can ride out the turmoil eventually should see tremendous investment opportunities. As to preserving capital and assets for someone in a U.S. dollar-denominated environment, holding some assets in physical gold (and some silver), and holding some assets outside the dollar (i.e. the Swiss franc, Canadian dollar) in high-quality, liquid assets, remain the best long-range hedges against all the real risks facing investors and the system.
Again, this is for the long haul. Short-term conditions still can show extreme volatility in the U.S. dollar and precious metals, as seen in the last year. Putting aside risks of political instabilities tied to the economic turmoil or any short-term liquidity concerns, real estate also remains a prime long-term hedge against the severe currency debasement that lies ahead.
With the ongoing crises in systemic solvency and in a severely contracting economy with pending inflation problems, the long-term outlook holds: U.S. equities will continue to suffer in a severe bear market; long-term U.S. Treasury yields will spike in response to inflation, eventual dollar dumping and mounting Treasury borrowing needs against a market with weakening demand; selling will intensify against the U.S. dollar, evolving into dollar dumping and dumping of dollar-denominated assets. Precious metals, particularly gold, will rally against mounting monetary and inflation pressures (and likely higher oil prices from a weakening dollar), weakness in the dollar, and as safe-haven hedges against increasing systemic and global political instability. (End of general background note.)
U.S. Equities — Despite recent strong rallies — somewhat reminiscent of the strong rallies seen during the broad stock market decline in 1929 to 1932 — equities generally remain in a savage bear market, off their all-time highs of last October. Downside potential remains in the range of a peak-to-trough contraction in the vicinity of 90%, as seen in the 1929 to 1932 period (see note below). This outlook remains over the longer term, and is in the context of ongoing extreme volatility, including likely intervening sharp rallies.
The recession rapidly is turning to depression, with no end in sight foe the downturn. The Fed’s dollar debasement program likely will intensify selling of the U.S. dollar and dollar-denominated paper assets. The result either will be a liquidity squeeze as the U.S. markets move to absorb the dollar-denominated paper, or, more likely, the Fed will heavily monetize the dumped dollar assets, accelerating the move to a hyperinflation. None of this is good for the real value of stocks.
General background note: Equities have begun to catch-up with the underlying economic, financial and systemic fundamentals, but the aggregate downside adjustments to stock prices still should be quite large over a number of years, eventually rivaling the total 90% decline in equities seen in the 1929 crash and ensuing three years. The current decline might have to be measured in real terms, however, as a hyperinflation eventually will kick in, with the Fed moving to liquefy the system and monetize federal debt. Stocks do tend to follow inflation, since revenues and earnings get denominated in inflated dollars. Hence with a hyperinflation, a DJIA of 100,000 or 100,000,000 could be expected, but such still would be well below today’s levels, adjusted for inflation (see the Hyperinflation Special Report of April 8, 2008).
U.S. Credit Market — With the targeted fed funds rate at 0.00% to 0.25% and with the Fed buying longer-term Treasuries, the market is heavily rigged, with downside potential on controlled yields. Eventually, rapid inflation and dollar dumping will spike U.S. interest rates, assuming regular market forces remained in play. Further boosting yields would be rapidly mounting concerns as to U.S. government solvency.
General background note: If inflation rises strongly in the year ahead, as I expect (but before hitting hyperinflationary levels), it would tend to support double-digit long-term yields, again, assuming normal market forces are allowed to play out.
U.S. Dollar — Developments of recent weeks have included an accelerating pace of U.S. dollar debasement, along with increasingly public complaints from major trading partners as to U.S. excesses in doing same. Central bankers have a pretty good sense of what lies ahead for the U.S. currency, and no one can be particularly happy with heavy holdings of the greenback, particularly China.
Weakening global demand for U.S. Treasuries already has surfaced. In a related area, any demand on the U.S. to issue its debt denominated in something other than dollars would place severe strains on the U.S. dollar as well as on the United States’ sovereign credit rating. In like manner, any efforts to replace the U.S. dollar as the world’s reserve currency would be met by heavy dollar selling.
General background note: The long-term outlook for the dollar remains for a massive sell-off, with flight from the dollar eventually evolving into a flight to safety outside the dollar. The U.S. dollar’s portfolio of underlying fundamentals generally could not be much worse. Relative to major trading partners, the U.S. economy is much weaker; interest rates are lower; inflation has been and again will be higher; fiscal and monetary conditions are worse in the extreme; relative trade-balance conditions still are horrendous; and relative political/systemic concerns are high, with mounting disgruntlement among major U.S. trading partners as to the outlook for the dollar and its status as the world’s reserve currency.
General background note: The proximal trigger for a full dollar panic already may be in place, given the Fed and Treasury’s responses to the ongoing systemic solvency crisis. Otherwise it could come from a particularly bad economic statistic, political missteps by the Administration (i.e. a Treasury Secretary contemplating changing the U.S. dollar’s reserve status), negative trade or market developments outside the United States, or a terrorist attack or expansion of U.S. military activity. When the trigger is pulled, what likely will be broad selling pressure will turn into an outright panicked dumping of the greenback, which should overwhelm any short-lived central bank intervention and roil the domestic financial markets, further. Generally, the greater the magnitude of the dollar selling, the greater will be the ultimate inflation pressure and liquidity squeeze in the U.S. capital markets, on top of an otherwise ongoing systemic and intensifying economic crisis.
As shown in the accompanying graph, the strength in the U.S. dollar — since the market distortions and interventions following the Bear Stearns crisis — generally has continued amidst ongoing volatility. The financial- and trade-weighted indices rose in both February and March, but they have softened slightly as of the U.S. market close on April 17th.
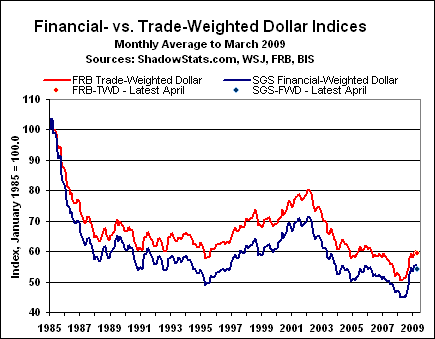
Please Note: As of January 1, 2009, the Federal Reserve ceased publishing its daily noon exchange rates on a timely basis. Where the daily rate or monthly average for a currency or index used in the newsletter or indices has been based on Federal Reserve reporting, such will continue when possible. Otherwise, the exchange rate or index will be based on daily rates published in the Wall Street Journal. When full Federal Reserve data are available, the monthly indices will be updated to reflect same in the regular postings on the Alternate Data tab at www.shadowstats.com.
U.S. Dollar Indices. The Shadow Government Statistics’ Financial-Weighted U.S. Dollar Index (FWD) is based on dollar exchange rates weighted for respective global currency trading volumes. For March 2009 the FWD gained 0.1% for the month after a 2.6% increase in February. The March 2009 monthly average index level of 55.33 (base month of January 1985 = 100.00) was up by 20.5% from March 2008, down from February’s 23.3% annual gain. As of April 17th, the FWD stood at 54.05.
Also increasing in March 2009 was the Federal Reserve’s Major Currency Trade-Weighted U.S. Dollar Index (TWD). The March average rose by 0.9% for the month, following a 2.6% increase in February. The March 2009 index level of 60.33 (base month of January 1985 = 100.00) was up by 17.1% from March 2008, versus an annual 19.2% increase in February. As of April 17th, the TWD closed at 59.35.
The differences in the two series can be accounted for largely by the much heavier weighting of the Canadian dollar in the TWD series.
General background note: Historical data on both dollar series are available for download on the Alternate Data page of www.shadowstats.com. See the July 2005 SGS Newsletter for methodology.
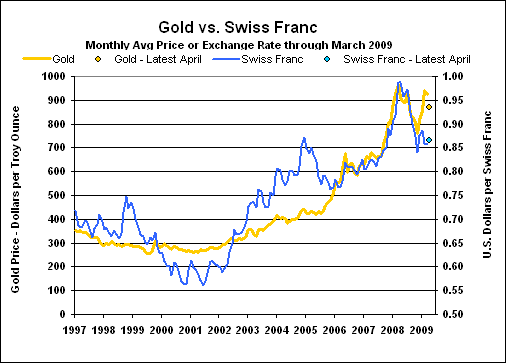
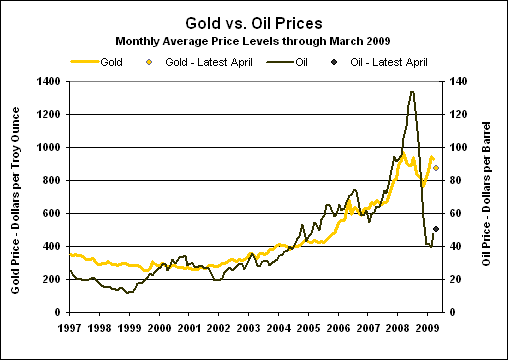
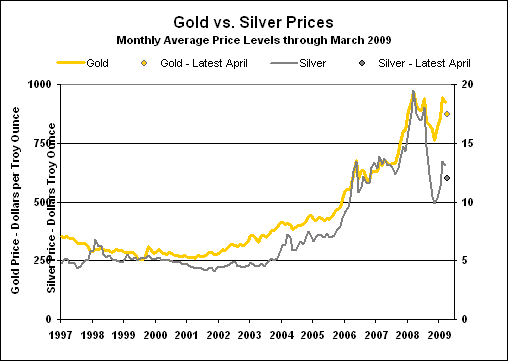
Gold and Silver — Despite recent some softness, gold and silver have received occasional support from sporadic selling of the U.S. dollar, as well as increasing safe-haven flight in response to accelerated attempts at official debasing of the greenback. Physical holdings of gold and silver remain the best long-term hedges against all the craziness that will be unfolding in the U.S. markets in the year or two ahead. In the short-term, however, extreme price volatility continues as a fair risk, as seen during the last year.
Falling from its all-time high London afternoon fix of $1,011.25 per troy ounce on March 17, 2008, amidst extreme volatility, gold hit a subsequent bottom of $712.50 in October. It closed April 17th at $870.50. In like manner, silver plunged from its March 17, 2008 high of $20.92 per troy ounce, hitting a subsequent low close of to $8.88 in October. It closed on April 17th at $11.98.
For March 2009 (per Kitco.com for both and silver prices), the monthly average London gold afternoon fix was $924.27 per troy ounce, down from $943.16 in February. Silver averaged $13.12 per troy ounce in March, down from $13.41 in February.
Inflation-Adjusted Historic Gold and Silver Highs. Even with the March 17, 2008 historic high of $1,011.25, the prior all-time high of $850.00 (London afternoon fix, per kitco.com) of January 21, 1980 still has not been hit in terms of inflation-adjusted dollars. Based on inflation through March 2009, the 1980 gold price peak would be $2,324 per troy ounce, based on not-seasonally-adjusted-CPI-adjusted dollars, and would be $6,906 per troy ounce in terms of SGS-Alternate-CPI-adjusted dollars.
In like manner, the all-time high price for silver in January 1980 of $49.45 (London afternoon fix, per silver institute.org) has not been hit since, including in terms of inflation-adjusted dollars. Based on inflation through March 2009, the 1980 silver price peak would be $135 per troy ounce, based on not-seasonally-adjusted-CPI-adjusted dollars, and would be $402 per troy ounce in terms of SGS-Alternate-CPI-adjusted dollars.
General background note: As discussed in the Hyperinflation Special Report (April 2008), the eventual collapse of the U.S. dollar — the world’s reserve currency — will force the creation of a new international currency system. Gold likely will be structured into any replacement system, in an effort by those organizing the new currency structure to gain public acceptance.
The updated gold versus oil, Swiss franc and silver graphs show March monthly average price levels, as well as added points for closing prices at April 17th, with gold at $870.50, silver at $11.98, oil at $50.33 and the Wall Street Journal’s closing rate for the Swiss franc at $0.8566. As current market distortions subside, all four measures should trade significantly higher in the year ahead, eventually breaking the highs seen otherwise during 2008.
End of Section Two
(View all Sections of this Issue)