Issue Number 51: Overview
Section One
(View all Sections of this Issue)
__________
Number 51
July 20, 2009
__________
Current Recession Now Longest Since Great Depression
June U-6 Unemployment Rate Topped 20% (25% SGS) in
Michigan, Oregon, Nevada, California, South Carolina and Rhode Island
Pressures Will Mount for New Stimulus and Bailouts
Spreading Depression Creates Its Own Statistical Distortions
Inflation Signs Begin to Surface
U.S. Dollar Remains the Key to the Markets and Inflation
__________
OVERVIEW — OPENING COMMENTS
Equity Markets Gyrate in Heavily Orchestrated Fantasy World
The U.S. economic and systemic solvency crises show no signs of abating, despite the happy hype out of Washington and Wall Street. While the pending second-quarter GDP estimate likely will show a narrowing quarterly contraction, such will be against a deepening annual downturn and revisions that should show the recession to have been not only longer and deeper than previously reported, but also the most severe recession since the shutdown of war production after World War II. Irrespective of media excitement around the fluttering of often statistically-insignificant or seasonally-warped monthly numbers, annual growth rates in key series have been holding at or pushing to new historic or post-war lows.
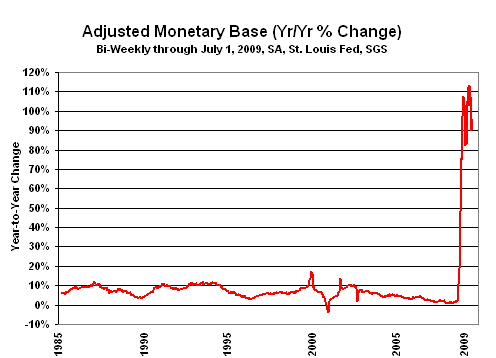
On the systemic liquidity front, circumstances appear to be deteriorating, once again. Significant flow-through from the near-100% annual growth in the monetary base to the broad money measures has not happened, signaling ongoing systemic liquidity stress. Both consumers and businesses have suffered as a result. The Fed’s attempt at extreme systemic liquefaction eventually will succeed, when it is "forced" into further significant monetization (overtly or covertly) of U.S. Treasury debt.
The ongoing tumble in business activity and the intensifying systemic liquidity crisis still appear to have the worst ahead of them, and that promises a likely second stimulus package out of Washington, as well as ongoing and expanded bailout efforts in the financial system, in the months ahead.
Higher oil prices have helped to bottom the downside inflationary pressures from the collapse in oil prices that started about one year ago. Declining annual inflation appears to have bottomed in both the CPI and PPI, while the June purchasing managers surveys both have higher prices-paid components that no longer are in deflation territory.
In the markets, stocks have rebounded off their lows of four months ago but still are well shy of their October 2007 highs, and the underlying fundamentals remain bleak. Ongoing problems with the economy, the U.S. dollar and domestic interest rates promise an eventual further sharp decline in equity prices. At such time as dollar selling intensifies, so too should inflationary pressures and upside movement in precious metals prices.
In general, the broad outlooks for the economy, the financial system and the financial markets are unchanged.
Worst Recession Since the Great Depression. July 2009 marks the 19th month of official recession and the longest U.S. economic contraction since the first downleg of the Great Depression (43 months in 1929 to 1933). The prior record duration of a post-Great Depression recession was 16 months, seen for both the 1973 to 1975 and 1981 to 1982 downturns, and that was passed in May. The second dip of the Great Depression in 1937 to 1938 lasted 13 months. Recession durations are as estimated by the National Bureau of Economic Research (NBER).
Further, with annual growth in key economic series holding at or pushing to new post-World War II lows, there are no meaningful indications that the business contraction has run its course. Despite all the reporting gimmicks in the GDP series, pending revisions and the "advance" estimate of second-quarter GDP should show that the current downturn has been the worst since quarterly GDP estimates were started in 1947. As discussed in the Key Indicators section, close to a decade of economic growth has been wiped out in this recession.
Despite the usual six-to-nine month lead time between efforts at economic stimulus and the resulting impact on economic activity, the severe and protracted economic downturn will barrel ahead, showing only a minor bump, if that, from the existing stimulus. The current loss of business activity will prove generally unresponsive to existing and any likely additional stimuli, because little has been or is likely to be done to address the structural issues tied to consumer income, which are driving the depression.
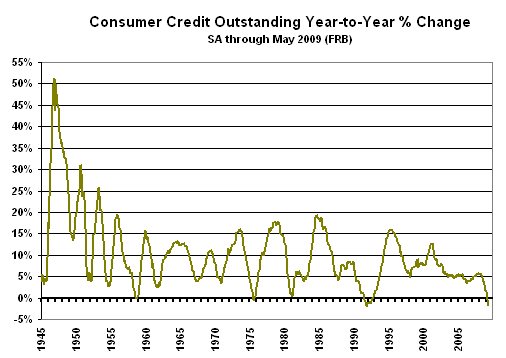
Specifically, without sustained real (inflation-adjusted) income growth, sustained real economic growth is not possible, shy of perpetual consumer debt expansion. At present, actual growth in real, disposable consumer income is inadequate to support ongoing growth in real personal consumption, and heavy expansion of consumer debt is not pending. As will be discussed in the key economic indicators section, in the ongoing systemic solvency crisis, annual growth in nominal (not adjusted for inflation) consumer credit outstanding is contracting at a pace not seen since 1991, a rate of decline otherwise not seen in the post-World War II era. (For expanded detail, see the general background note "Deepening Structural Depression Will Be Protracted, Eventually Feeding into a Hyperinflation," following the section showing the graphs of key indicators).
The Federal Reserve recently updated its economic forecasts — based on the outlooks of the regional Fed presidents — with apparently contradictory results showing a narrower real GDP contraction for 2009 (on average 0.4% better) but a higher unemployment rate (on average 0.5% worse). Beyond playing to perceived market needs, what could be at work here is foreknowledge by the Fed of pending downside revisions to 2008 GDP (due July 31st). With greater economic weakness growth thrown back into 2008, the Fed could even lower the level of its 2009 GDP forecasts but still show better relative annual growth.
Economic restatements aside, noting that the economy has turned out to be weaker than they expected, per the Vice President, some such as Obama economic advisor Laura Tyson already have raised prospects of a second stimulus package. Though that concept has been rejected officially by the President, it will keep surfacing and likely will be acted upon in the next several months, as the hoped-for economic turnaround fails to materialize, and the Democrats increasingly worry about the 2010 mid-term election.
Compounding the current economic difficulties has been a series of major actions taken by the White House and Democrat controlled Congress. The stimulus package, the nationalization of much of the U.S. automotive industry, the cap-and-trade environmental package, and the pending national healthcare package all were or are being pushed through Congress with limited or no public debate, despite their massive impacts on society and the economy. A further nationalization of much of the U.S. banking industry still remains a likely outcome of the ongoing systemic solvency crisis.
The U.S. government never has been a particularly efficient operator of businesses, even with efforts at quasi-independent operations such as seen with the U.S. Postal Service and Amtrak. Parlay those "successes" into government control of the auto and banking industries and into open competition with private insurance companies, and robust growth in those areas not only will be lacking, but the inevitable problems will prove a heavy drain on the U.S. taxpayer and will hamper U.S. economic competitiveness against the rest of the world, competitiveness that already has been severely impaired by excessive government intervention and faulty trade policies. Of course, the cap-and-trade and healthcare packages will have heavy costs to the system in fees and taxes, including proposed punitive taxes on those earning high incomes, as the Administration and Congress move to redistribute income and wealth.
Although free and open markets have been lacking in the United States for many years, the open marketplace generally resolves unhappy business or economic issues. While the solutions may be painful (i.e., recessions and bankruptcies), the outcomes usually allow for ongoing, healthy and happy economic growth, albeit with an ongoing economic cycle of booms and busts. Efforts at forced income and wealth redistribution, and at centralized government control of businesses and society, usually end up fostering economies that are in a state of perpetual bottom-bouncing, as was seen with the former Soviet Union.
As an important aside, raising taxes or imposing "fees" during a recession usually is akin to economic suicide. This applies not only to the federal government, but also to state and local governments, where recession-enhanced fiscal crises generally are being approached with higher taxes and limited spending cuts. As suggested by the regional unemployment rates discussed in the Reporting/Market Focus, some of the particularly troubled states already are in what I would define as formal depression.
Depression-Induced Economic Reporting Distortions. A note of caution: The severe shocks to the U.S. economic and financial system from the crises of the last two years could be expected to disrupt standard economic reporting, and, indeed, distortions from same have started to surface. In particular, major bankruptcies and other financial stresses that have changed the regular behavior of consumers, businesses and governments can severely distort seasonally-adjusted data. Seasonal adjustments are made to most economic series in order to remove patterns of regularly-recurring activity, such as school years, holiday-season shopping and retooling automobile lines for the next year’s models. When the regular patterns are disrupted, and the reporting is adjusted for "normal" seasonal variations, the resulting data can be skewed terribly, either to the plus-side or down-side.
Such was seen recently in the reported sharp decline in seasonally-adjusted weekly new claims for unemployment, where regular adjustments for the retooling of automobile lines artificially reduced claims, when full normal retooling did not take place. Distortions from automotive, banking, retail and other industries in upheaval, distortions from severe foreclosure activity and credit contraction, all can produce misleading seasonally-adjusted monthly economic reporting. Accordingly, year-to-year change on a not-seasonally-adjusted basis likely is the safest way to interpret most numbers, but even there, the spreading depression is having impact.
The economy has been in contraction for an extended period of time, longer than any other downturn since the Great Depression. As shown shortly in the graphs of key economic indicators, year-to-year comparisons now are going against prior year periods of collapsing activity. As a result, annual growth rates in a number of series have started to plateau at record-low levels; some series are showing a slight easing in the year-to-year declines; others still are pushing to new lows. Any apparent bottom-bouncing here largely is an artifact of the protracted collapse and is not due to a rebound in business activity.
Key Indicators Continue to Show Severe Loss of Business Activity. The still-unfolding depression has wiped out most of the economic growth of the last decade. June’s housing starts (actual number of starts, not a growth measure) reflected a low level of activity (outside of recent months) not seen since the World War II. June’s level of industrial production activity was the lowest since July 1998. Outside of other recent reporting, June’s level of real retail sales was the lowest since September 2001, in the wake of the terrorist attacks of 9/11. June payroll employment was at its lowest level since August of 2004.
Indeed, despite ongoing hype to the contrary, the U.S. economic activity has continued to collapse, as shown in the accompanying graphs of annual growth in payroll employment, industrial production, housing starts, retail sales and consumer credit outstanding. Except for payrolls and consumer credit, which are within a month or two of hitting the lowest annual growth rates seen since the Great Depression (ignoring the extreme special-circumstance distortions placed on system and the economy by World War II), the other series already have crossed that extreme benchmark.
A new graph in this newsletter is annual nominal growth in consumer credit outstanding. Credit remains a key constraint on consumer economic activity.
As mentioned in the preceding section on reporting distortions, both housing starts and retail sales are showing patterns of extreme annual contraction plateauing or bottoming at record-low levels of growth.
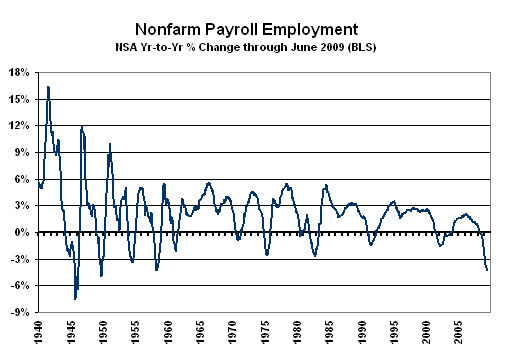
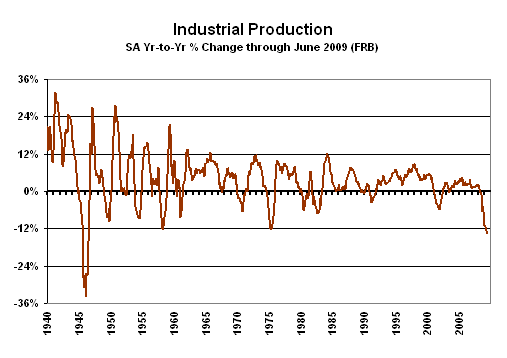
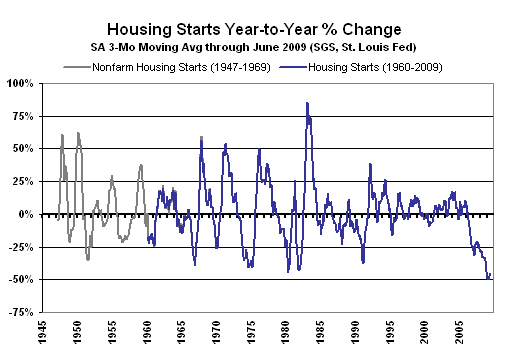
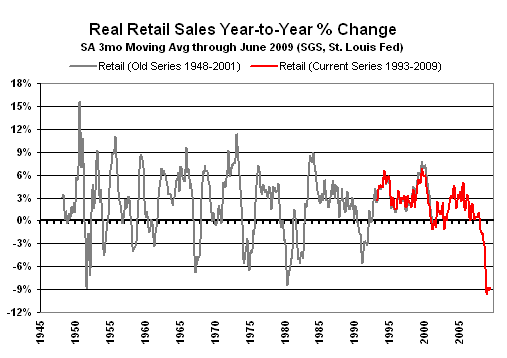
Second-Quarter GDP Contractions Likely Will Be Less Severe Quarterly, More Severe Annually. While the degree of contraction in real GDP has been severely understated by the Bureau of Economic Analysis, year-to-year change in second-quarter GDP would show its deepest annual contraction since World War II, even if quarter-to-quarter growth were unchanged. Such an outcome, however, could be altered by a severe downward revision to 2008 GDP in the upcoming benchmark revision (see the GDP section in the Reporting Perspective). Nonetheless, the outcome of the pending revisions and first estimate of second-quarter growth should leave the current recession with the clear status of being the worst since the Great Depression.
Recently reported quarterly real GDP changes have not followed the patterns of key underlying economic indicators. That said, current reporting generally has shown less-severe annualized quarterly contractions in the second-quarter indicators, and such likely will be reflected in the second-quarter GDP and embraced by the Administration and the markets as evidence of an improving economy. In contrast, the deepening annual contraction will indicate ongoing economic deterioration.
In terms of respective annualized quarterly growth in the second quarter versus the first quarter, seasonally-adjusted nonfarm payrolls contracted by 4.6% versus 5.9%, retail sales contracted by 3.0% versus 3.1%, industrial production contracted by 11.6% versus 19.1%, and housing starts actually expanded at an annualized pace of 10.5% in the second quarter, against an annualized 58.6% contraction in the first quarter.
PLEASE NOTE: A "General background note" provides a broad background paragraph or section on certain series or concepts that is used in more than one SGS newsletter. Where language used in a past newsletter is repeated in subsequent newsletters (or used repetitively month-after-month),any text changes in such a section are highlighted in italics upon first usage. This is done so that regular readers may avoid re-reading material they have seen before, but where they will have the material available for reference, if so desired.
Deepening Structural Depression Will Be Protracted, Eventually Feeding into a Hyperinflation. General background note(this immediate section and the next on "Structural Economic Issues"): As discussed in further detail in Shadow Government Statistics Newsletters Nos. 47, 48, 49 and 50 (incorporated here by reference), the U.S. economy has entered a long-term structural recession, which rapidly is deepening into a depression.
The SGS definition of depression is a peak-to-trough contraction in inflation-adjusted economic activity in excess of 10%. A great depression is a peak-to-trough contraction in inflation-adjusted economic activity in excess of 25%.
The current depression may be subject to multiple dips, and it is not subject to an easy or quick fix. It is deep enough to absorb the recent stimulus package without the economy breaking above water.
The stimuli put forth by the government and Fed do little to address the structural issues, and thus should have only limited positive impact on economic activity. The government and Fed’s actions, however, do offer the promise of much higher inflation. Such, in conjunction specifically with recent Fed moves to accelerate monetization of Treasury debt, and calls among major central banks to replace the U.S. dollar as the global reserve currency, significantly increase the risk of triggering a near-term U.S. hyperinflation as soon as late-2009 or early in 2010. A hyperinflation already was inevitable in the next five years — before the current systemic solvency crisis — based on extreme pre-crisis U.S. fiscal abuses. My best estimate on U.S. hyperinflation timing remains in the period from late-2009 to 2014, with particularly high risk in the year ahead. That outlook will be reviewed and detailed in a pending update and expansion the SGS Hyperinflation Special Report of April 8, 2008.
The structural nature of the downturn is tied to the loss of high paying domestic production or technical jobs in recent decades to offshore competition, or where jobs were moved offshore, with a result that U.S. household income has not kept up with inflation. If the consumer’s disposable income cannot grow faster than inflation, then neither can economic activity, shy of temporary debt expansion or savings liquidation, which have been stretched to their limits.
Debt expansion has been used in recent decades to fuel U.S. economic growth and to mask the growing structural limitations with consumer income. Given the recent credit market problems, debt expansion no longer can fuel economic expansion, either from the standpoint of consumers, or to an increasing extent from the standpoint of businesses. The only sector of the economy expanding its debt significantly is the federal government. While government borrowing from the public is not inflationary, government borrowing from the Fed is extremely inflationary. Therein lies the problem for ongoing federal debt expansion. With willing purchasers of U.S. Treasuries beginning to dry up, the Federal Reserve stands as a lender of last resort, monetizing federal debt (and other instruments) at an accelerating pace, limited only by its ability to print money and by the eventual costs from the resulting inflation
Structural Economic Issues. Direct impact of this circumstance [loss of high-paying production/technical jobs] has been seen in deteriorating U.S. household income, net of taxes and inflation. Using the government’s numbers, real (inflation-adjusted) average weekly earnings (Bureau of Labor Statistics) in June 2009 were down 16% from the October 1972 high. Average weekly earnings never regained their pre-1973/1975 recession high. Partially as a result, households that once tended to have one breadwinner, now tend to have multiple breadwinners, out of necessity. Even so, the latest poverty survey published by the Census Bureau showed that real household income (average and median) in 2007 still had not regained its pre-2001 recession highs.
The numbers are much worse if the SGS-Alternate Consumer Inflation estimates are used for deflating the income measures. The SGS measure is an attempt to reflect the rate of inflation inherent in maintaining a constant standard of living, as reflected in earlier CPI reporting methodologies. In the real world, average household income has not kept up with the cost of maintaining a constant standard of living, and that shortfall has been met in recent decades, at least partially, by consumers taking on increasing levels of debt.
Indeed, without growth in inflation-adjusted income, real economic growth cannot be sustained, other than through temporary measures such as debt expansion. Aware of this circumstance, former Federal Reserve Chairman Alan Greenspan et al did their best to keep the economy growing in recent decades by encouraging unsustainable debt growth, with a resultant economic growth effectively borrowed from the future. The current downturn is akin to something of a payback period.
What I refer to as the "debt standard" was created during the Franklin Roosevelt Administration as replacement for the gold standard. Its expansion through the decades has led to excessive use of debt by government, industry and individuals. In recent years, creative derivative and structured financial instruments have allowed for even greater leverage, building debt excess upon debt excess.
Now, as the debt excesses begin to implode, the federal government, and unusually large segments of local and state governments and the commercial and private sector, face financial distress and possible insolvency. Fallout has been seen in the rapidly intensifying economic contraction.
The current recession, however, began before the solvency/liquidity issues came to a head and was itself instrumental in triggering the systemic liquidity crisis. The systemic liquidity crisis, in turn, has severely exacerbated the economic contraction. Neither President Obama’s stimulus package nor Messrs. Geithner and Bernanke’s still-evolving systemic bailout program will turn the economy fundamentally or provide any lasting prop for the equity market. What these packages do promise is an ongoing effort to maintain a functioning system of depository institutions, and higher — much higher — inflation.
End of general background note.
Inflation Signals Begin to Surface. Both the June CPI and PPI topped consensus expectations for monthly inflation, and the decline in annual inflation for both series appeared to be bottoming. At the same time, the June prices-paid components of both the manufacturing and non-manufacturing purchasing managers surveys moved to 50.0 or above, no longer signaling contracting prices.
At work here are higher oil and related energy prices, as well as the regular reversal of seasonal factors that depress reporting of energy inflation in the first half of the year. Also, on a year-to-year basis, current energy prices will be measured against the collapsing prices of the year before. Ongoing weakness in the U.S. dollar and mounting global political tensions should keep net upside pressure on oil prices, irrespective of any near-term price volatility, with related general upside pressure on consumer inflation in the months ahead.
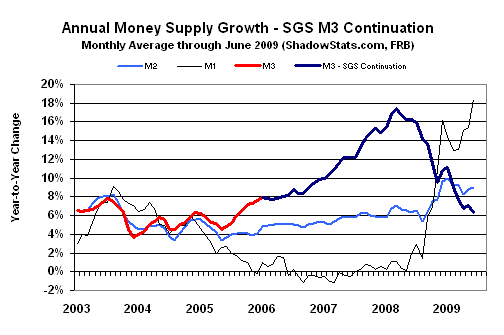
Monetary Base Expansion Fluctuates Minimally. Despite all efforts by the Fed and the U.S. Treasury to debase the U.S. dollar, broad money growth has stalled anew (see the Money Supply section in the Reporting Perspective), suggesting an intensifying solvency crisis, with new or expanded Fed actions likely. Again, however, broad money growth should pick up with escalating Fed monetization of Treasury debt. In response to the dollar debasement efforts, however, the U.S. dollar generally has weakened in the currency markets in the last several months, as global investors increasingly have shunned the greenback. Eventually, intense dollar weakness will push dollar-based prices, such as oil, much higher, igniting consumer inflation that ultimately will feed into a U.S. hyperinflation.
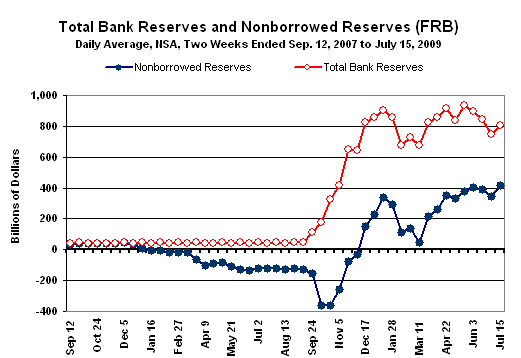
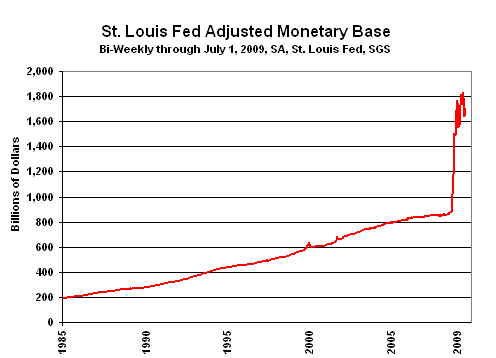
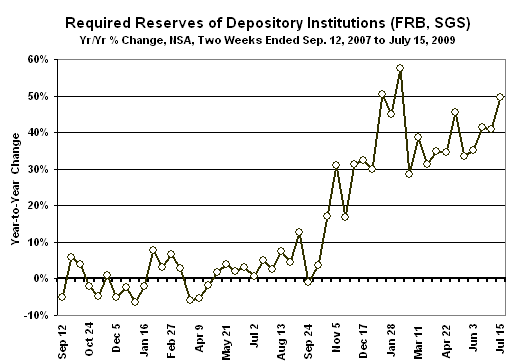
In terms of the monetary base — the Fed’s primary tool, in theory, for affecting the money supply — year-to-year change rebounded to 95.7% in the two week period ended July 15th, after having slipped to 89.9% in the prior two-week period, as reflected in the seasonally-adjusted St. Louis Fed’s adjusted series. The monetary base consists basically of currency in circulation plus bank reserves, and the fluctuation in annual growth largely was reflected in excess reserves. Of continued significance to the broader money measures, however, annual growth in required reserves (not-seasonally-unadjusted), jumped to 49.7% in the latest two weeks, the strongest showing since February, up from 40.9% annual growth in the prior two-week period.
Inflation Remains the Concern: No Practical Way Out for the Fed in Reversing Dollar Debasement Actions. General background note(this immediate section): Mr. Bernanke is dedicated to debasing the U.S. dollar, in order to create inflation and to avoid deflation (he outlined such plans to avoid deflation while a Federal Reserve Governor in 2002). Accordingly, it seems somewhat silly for the Fed to assure the markets that its policies will not create inflation, where such actually is the intent of the policies. The assurances here presumably are that inflation will not get out of control, but control is not easily or likely had.
The problems here are at least twofold. First, any return to economic or financial-market normalcy is years off in the future. To the extent that the Fed’s programs work in restoring economic and systemic normalcy, such would have to be in place and moving solidly under its own power, before the Fed would pull the plug on its various supports, potentially risking a relapse of the systemic crash. Inflation likely would have a strong footing before then.
Second, with a looming massive sell-off in the U.S. dollar, the Fed will have no market for the Treasuries it has been and will be monetizing. The Fed’s eventual choices would be to dump its Treasury holdings, spiking U.S. rates and tanking the U.S. markets and economy, or to continue to monetize the growing and increasingly unwanted federal debt, further fueling inflationary pressures.
End of general background note.
Financial Markets Remain Volatile and Unstable. Over the long haul, the general outlook is unchanged: a hyperinflationary great depression, much lower stock prices (at least in inflation-adjusted terms), much higher interest rates, severe dollar selling against most major currencies, and much higher prices for precious metals, particularly gold and silver. With unstable economic and systemic solvency issues, the current financial markets remain in extreme flux, unstable and dangerous, with high volatility, tremendous gimmicking and likely at least sporadic, government-coordinated market manipulations. Accordingly, over the short-term, almost anything remains possible in the markets.
Alternative Realities. This section updates the Shadow Government Statistics (SGS) alternative measures of official GDP, unemployment and CPI reporting. When a government economic measure does not match common public experience, it has little use outside of academia or the spin-doctoring rooms of the Federal Reserve, White House and Wall Street. In these alternative measures, the effects of gimmicked methodological changes have been removed from the official series so as to reflect more accurately the common public experience, as embodied by the pre-Reagan-Era CPI and GDP and the pre-Clinton Era unemployment rate. Methodologies for the GDP and CPI series are discussed in the August 2006 SGS.
GDP. The alternate first-quarter 2009 GDP growth reflects the "final" estimate, with many of the methodological gimmicks of recent decades removed. The alternate first-quarter inflation-adjusted annual growth rate (year-to-year, as opposed to the popularly-touted annualized quarter-to-quarter rate) for GDP was a decline of roughly 5.1% versus the official year-to-year contraction of 2.5%. The official, annualized real quarter-to-quarter change for the first quarter stands at a 5.5% contraction. While the quarterly growth number is popularly followed, its significant inaccuracies are expanded to the fourth-power in reporting. The alternate measure safely would have shown an annualized quarterly contraction in the first quarter in excess of eight-percent.
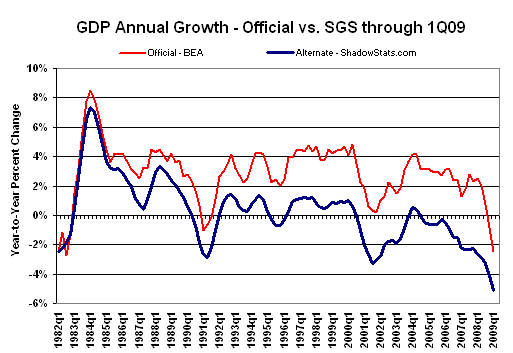
General background note: Historical data on both the official and SGS-Alternate GDP series are available for download on the Alternate Data page of www.shadowstats.com. The Alternate GDP numbers tend to show deeper and more protracted recessions than have been reported formally or reflected in related official reporting. Nonetheless, the patterns shown in the alternate data are broadly consistent with the payroll employment and industrial production series, which are major indicators used by the National Bureau of Economic Research in determining the official timing of U.S. business cycles. GDP historical growth patterns back to 1929 are subject to a grand benchmark revision on July 31st. An SGS special report will detail those revisions.
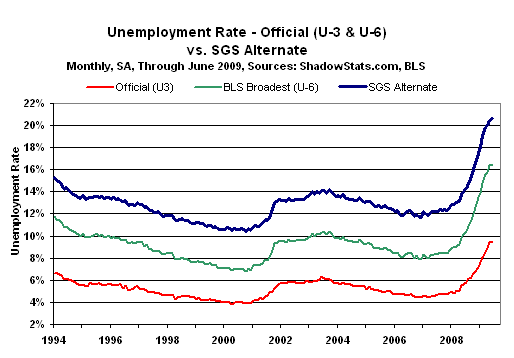
Unemployment Rate. Shown are two official seasonally-adjusted unemployment measures, U.3 and U.6, and the SGS-Alternate Unemployment Measure. The various measures inched higher in June, reflecting continued deterioration in labor-market conditions. The June rates stood respectively at 9.5%, 16.5% and 20.6%, up from 9.4%, 16.4% and 20.5% in May. Estimates of June state-by-state unemployment rates at the U.3, U.6 and SGS-Alternate levels are explored in this month’s Reporting/Market Focus
The average person has a pretty good sense as to whether or not he or she is unemployed, regardless of varying official definitions. It is to the broad, common-experience unemployment measure that the SGS-Alternate Unemployment Measure is addressed; its calculation is described below. Ask people simply if they are employed or unemployed, and the response likely would indicate an unemployment rate much closer to 20.6% than to 9.5%.
As to how the rates line up historically, the widely circulated estimate of 25% peak unemployment in 1933 of the Great Depression was guesstimated from a variety of sources, well after the fact. Unemployment was not surveyed in the 1930s; such was started by the government in 1940. The 1933 estimate appears to reflect what I would call a broad unemployment definition. Where roughly 28% of employment in 1933 was agricultural, the nonfarm unemployment rate was estimated then at a peak of 34%. With less than 2% of current employment accounted for by agriculture, the 34% unemployment rate might be the better one to use in comparing the 1933 circumstance with today’s.
Putting the SGS-Alternate Unemployment Measure into perspective, in the best of times, it would have fallen perhaps into the 8% to 9% range. Now topping 20%, it likely is comparable to the depths of the 1973 to 1975 recession and still is well shy of the 34% peak reported in 1933.
General background note: U.3 is the popularly followed unemployment rate published by the Bureau of Labor Statistics (BLS), while U.6 is the broadest unemployment measure published by the BLS. U.6 is defined as total unemployed, plus all marginally attached workers, plus total employed part time for economic reasons, as a percent of the civilian labor force plus all marginally attached workers. Marginally attached workers include short-term discouraged workers who survived redefinition during the Clinton Administration. The SGS-Alternate Unemployment Measure simply is U.6 adjusted for an estimate of the millions of long-term discouraged workers defined away in 1994 — those who had been "discouraged" for more than one year.
General background note: Historical data on both the official and SGS-Alternate unemployment series are available for download on the Alternate Data page of www.shadowstats.com. The Alternate numbers are reported from the 1994 series redefinitions forward. While it had been planned to take the alternate series further back in time, such appears to be impractical at the moment, given the lack of ongoing or parallel alternate data, as well as lack of good quality estimates of the impact of methodological shifts.
CPI. Reflecting higher oil and gasoline prices, as well as a washing out of regular seasonal adjustments that depress gasoline price reporting in the first half of the year, monthly inflation rebounded some in June, while the decline in year-to-year CPI inflation began to flatten out. Curiously, the May PCE Deflator (I.5 in the accompanying table), which tends to track closely with the C-CPI-U (I.6), continued to hold above zero and well above the C-CPI-U.
Despite any near-term faltering in oil prices, current annual inflation rates should be at or near the trough of the current cycle, as year ago comparisons begin to be against the collapse in oil prices. Prospective stronger broad money growth and a prospective weaker U.S. dollar (higher related oil prices) still threaten much higher inflation in the year ahead.
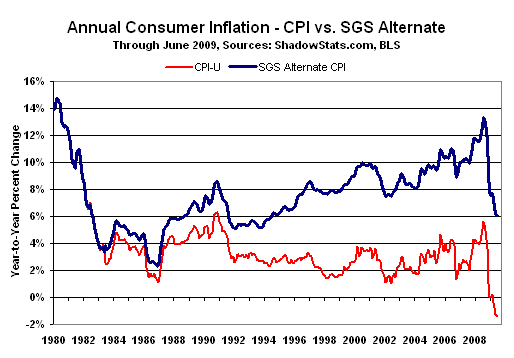
General background note: Historical data on both the official and SGS-Alternate CPI series are available for download on the Alternate Data page of www.shadowstats.com. The Alternate CPI numbers tend to show significantly higher inflation over time, generally reflecting the reversal of hedonic adjustments, geometric weighting and the use of a more traditional approach to measuring housing costs, measures all consistent with the reporting methodology in place as of 1980. The changes made are additive, reflecting BLS estimates of the impact of the various methodological changes on the aggregate annual inflation rate. Available as a separate tab at the SGS homepage www.shadowstats.com is the SGS Inflation Calculator that calculates the impact of inflation between any two months, 1913 to date, based on both the official CPI-U and the SGS-Alternate CPI series.
|
Ten Levels of Consumer Inflation |
|||||
|
Measure |
Mar 09 |
Apr |
May |
Jun |
|
|
I.1 |
Core PCE Deflator (BEA) |
1.8% |
1.9% |
1.8% |
n.a. |
|
I.2 |
Core Chained-CPI-U (BLS) |
1.3% |
1.4% |
1.4% |
1.3% |
|
I.3 |
Core CPI-U (BLS) |
1.8% |
1.9% |
1.8% |
1.7% |
|
I.4 |
Core CPI-W (BLS) |
1.8% |
2.0% |
2.0% |
1.9% |
|
I.5 |
PCE Deflator (BEA) |
0.6% |
0.5% |
0.1% |
n.a. |
|
I.6 |
Chained-CPI-U (BLS) |
-0.8% |
-1.1% |
-1.4% |
-1.3% |
|
I.7 |
CPI-U (BLS) |
-0.4% |
-0.7% |
-1.3% |
-1.4% |
|
I.8 |
CPI-W (BLS) |
-0.9% |
-1.3% |
-1.9% |
-2.0% |
|
I.9 |
Pre-Clinton CPI-U (SGS) |
2.9% |
2.6% |
2.0% |
1.9% |
|
I.10 |
SGS Alternate Consumer Inflation |
7.3% |
6.7% |
6.1% |
6.1% |
|
Sources: SGS, BLS (Bureau of Labor Statistics), BEA (Bureau of Economic Analysis). |
|||||
End of Section One
(View all Sections of this Issue)