No. 409: Revised GDP, November Durable Goods, New Home Sales
COMMENTARY NUMBER 409
Revised GDP, November Durable Goods, New Home Sales
December 23, 2011
__________
GDI Indicates No U.S. Economic Growth in Either Second- or Third-Quarter 2011
Durable Goods Orders and New Home Sales Show Stagnation
Treasury Releases 2011 GAAP-Based Financial Report on U.S. Government
__________
PLEASE NOTE: A Special Commentary now is planned for Monday, December 26th, with an initial analysis of the just-released 2011 Financial Report of the United States Government. The next regular Commentary is scheduled for Friday, January 6th, covering the estimates of December 2011 employment and unemployment. No major economic releases are scheduled and no other Commentaries currently are planned for next week, the period between Christmas and New Year’s Day. See Schedule for month ahead.
Best wishes to all for a very merry and joyous Christmas and for a happy, healthy and prosperous New Year! — John Williams
Opening Comments and Executive Summary. The U.S. Treasury offered its Christmas Eve present to the markets with this morning’s (December 23rd) release of the 2011 Financial Report of the United States Government. The 254-page document will require careful analysis and will be discussed in a Special Commentary planned for December 26th.
A quick glance at the statement detail shows a raw, GAAP-based 2011 annual deficit of about $4.3 trillion, but that likely will change, based on accounting issues related to Fannie Mae and Freddie Mac (GSEs), as well as questions on projected Medicare savings, as raised by the government’s auditor, the GAO (Government Accountability Office, previously known as the General Accounting Office). Among the happy news reflected in the statements is that the government saw a sharp reduction in its liabilities tied to the GSEs.
An assessment of the most recent economic releases follows. The latest GDP revision suggests that U.S. economy activity has been flat for the last two quarters, while November durable goods orders and new home sales indicated no change in current bottom-bouncing economic activity. An updated Hyperinflation Watch is deferred to the Monday (December 26th) Special Commentary.
GDP Revision. Third-quarter 2011 gross domestic income (GDI) stands just 0.11% above the first-quarter level. Adjusted for inflation, on a non-annualized basis, third-quarter GDI topped second-quarter GDI by 0.06%, with the second-quarter topping the first-quarter by 0.05%. This lack of growth reported for GDI, the gross domestic product’s (GDP) statistical equivalent, is more realistic than the more-heavily-hyped and politically-massaged headline GDP annualized growth rates (non-annualized real third-quarter GDP growth versus the first-quarter now is up by 0.78%). Nonetheless, the GDI reporting still is overstated.
Otherwise, the downward revision to headline third-quarter GDP growth (inflation-adjusted and annualized) to 1.8% from 2.0%, and parallel downside revisions in the GDI and GDP, were little more than statistical noise.
Impact of Existing Home Sales Revisions on GDP Reporting. Several subscribers have queried as to the impact on GDP reporting from the massive downside revisions published on December 21st (Commentary No. 408) for existing home sales. The effects should be nil in recent years, with perhaps a downside blip sometime back in 2007 or so. Whatever the revisions to GDP, the initial impact of the home sales revisions would surface in the next round of GDP benchmark revisions on July 27, 2012.
Unlike new home sales, which reflect the completion of new home construction and are included in GDP reporting of "residential construction," existing home sales, like used cars, are more transactional than representing new production, in nature.
Accordingly, and per conversations with the BEA, the revisions will show up primarily in personal consumption, under broker services (commissions), where the National Association of Realtors (NAR) data are relied upon. Given the way the NAR data were revised, so as to preserve most of the previously reported patterns of monthly activity, however, the change in relative GDP activity will be limited largely to the initial drop in revised level of existing home sales activity in the first-quarter of 2007. Yet, 2007 is outside the scope of the upcoming GDP benchmark, and the initial 2007 revision appears to be the beginning of a disjointed series as discussed in the prior Commentary. The BEA has yet to assess how the historical data will be handled that far back, whether, for example, the BEA national income accounts might be opened for special revisions back to 2007 just for the NAR-related issues.
New Orders for Durable Goods and New Home Sales. There were no surprises in this morning’s reporting of November new orders for durable goods and new home sales. The 3.8% jump in monthly orders was accounted for almost entirely by a 73.3% monthly surge in the highly volatile nondefense aircraft orders category. These long-range aircraft sales rarely have meaningful impact on near-term economic activity.
As is usual, the monthly change in new home sales was statistically meaningless in November, up 1.6% +/- 14.2%, suggestive of the ongoing bottom-bouncing in the series.
__________
REPORTING DETAIL
GROSS DOMESTIC PRODUCT—GDP (Third-Quarter 2011, Third Estimate, Second Revision)
GDP-Related Definitions. For purposes of clarity and the use of simplified language in the following text, here are definitions of key terms used related to GDP reporting:
"Gross Domestic Product (GDP)" is the headline number and the most widely followed broad measure of U.S. economic activity. It is published quarterly by the Bureau of Economic Analysis (BEA), with two successive monthly revisions and with an annual revision the following July.
"Gross Domestic Income (GDI)" is the theoretical equivalent to the GDP, but it is not followed by the popular press. Where GDP reflects the consumption side of the economy and GDI reflects the offsetting income side. When the series estimates do not equal each other, which almost always is the case, the difference is added to or subtracted from the GDI as a "statistical discrepancy." Although the BEA touts the GDP as the more accurate measure, the GDI is relatively free of the monthly political targeting the GDP goes through.
"Gross National Product (GNP)" is the broadest measure of the U.S. economy published by the BEA. Once the headline number, now it rarely is followed by the popular media. GDP is the GNP net of trade in factor income (interest and dividend payments). GNP growth usually is weaker than GDP growth for net-debtor nations. Games played with money flows between the United States and the rest of the world tend to mute that impact on the reporting of U.S. GDP growth.
"Real" means growth has been adjusted for inflation.
"Nominal" means growth or level has not been adjusted for inflation. This is the way a business normally records revenues or an individual views day-to-day income and expenses.
" GDP Implicit Price Deflator (IPD)" is the inflation measure used to convert GDP data from nominal to real. The adjusted numbers are based on "Chained 2005 Dollars," at present, where the 2005 is the base year for inflation, and "chained" refers to the methodology which gimmicks the reported numbers so much that the total of the deflated GDP sub-series misses the total of the deflated total GDP series by nearly $40 billion in "residual" as of second-quarter 2010.
"Quarterly growth," unless otherwise stated, is in terms of seasonally-adjusted, annualized quarter-to-quarter growth, i.e., the growth rate of one quarter over the prior quarter, raised to the fourth power, a compounded annual rate of growth. While some might annualize a quarterly growth rate by multiplying it by four, the BEA uses the compounding method, raising the quarterly growth rate to the fourth power. So a one percent quarterly growth rate annualizes to 1.01 x 1.01 x 1.01 x 1.01 = 1.0406 or 4.1%, instead of 4 x 1% = 4%.
"Annual growth" refers to the year-to-year change of the referenced period versus the same period the year before.
The GDP series remains the most heavily politicized of the government’s popularly followed economic reports. Related issues generally were explored most recently in Commentary No. 401.
GDP. Published yesterday, December 22nd, by the BEA, the third estimate (second revision) of third-quarter 2011 gross domestic product (GDP) showed revised annualized real quarterly growth of 1.81% (previously 2.00%, initially 2.46%) +/- 3% (95% confidence interval), versus an estimated annualized gain of 1.33% for second-quarter 2011. Not annualized, third-quarter GDP growth was a revised 0.45% (previously 0.50%, initially 0.61%), against 0.33% in the second-quarter. In this most worthless of major economic series, the reported annualized growth rates for the last three quarters are little more than statistical noise around the unchanged level, and they possibly have been massaged to keep the quarterly growth rates in minimally-positive as opposed to minimally-negative territory.
The downside revision in the third-quarter’s third estimate was little more than statistical noise, with the revised components dominated by weaker personal consumption of health care services, offset partially with a less-negative shift in private inventories.
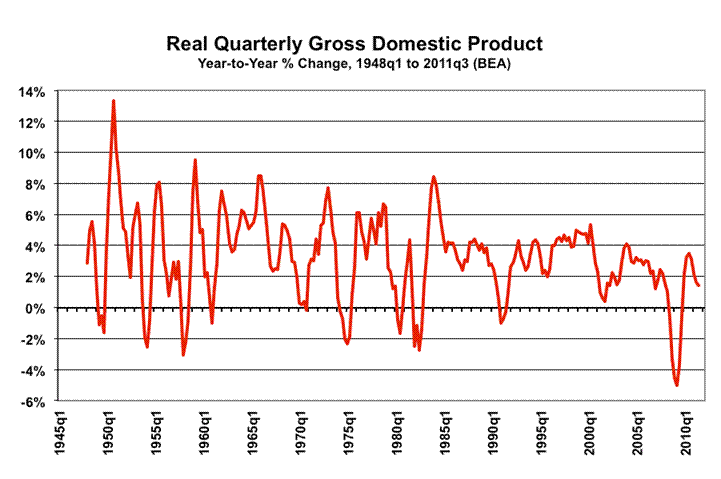
Year-to-year real change in third-quarter 2011 GDP slowed minimally to a revised 1.46%, previously 1.51% and initially 1.62%, versus 1.63% annual growth in the second-quarter. Current annual growth continued moving well off the near-term peak in reported growth of 3.51% during third-quarter 2010.
The estimate of the third-quarter GDP implicit price deflator (IPD) revised to 2.56%, previously 2.50% and initially 2.52%, versus 2.59% in the second-quarter. In contrast, annualized seasonally-adjusted quarterly inflation for the CPI-U in the third-quarter eased to 3.07% from 4.09% in the second-quarter. On a year-to-year basis, the third-quarter IPD was up by 2.41% against 2.40% in previous and initial reporting, versus 2.10% in the second-quarter. In contrast, annual growth in third-quarter CPI-U rose to 3.76% versus 3.43% in the second-quarter.
The lower the inflation rate used in deflating the GDP, the stronger is the resulting inflation-adjusted number and vice versa. A slightly more realistic inflation number would have flattened the reported third-quarter GDP growth rate, as discussed in Commentary No. 401.
The SGS Alternate-GDP estimate for third-quarter 2011 remains an approximate annual contraction of 2.9% versus the official unrevised estimate (at the first decimal point) of a 1.5% gain. Such is slightly more negative than the alternate 2.8% annual contraction (1.6% official gain) estimate for the second-quarter (see the Alternate Data tab). While annualized real quarterly growth is not estimated formally on an alternative basis, a quarter-to-quarter contraction appears to have been realistic for the third-quarter, as it was in both the first- and second-quarters, in what generally has been a protracted period of business bottom-bouncing.
Adjusted for gimmicked inflation and other methodological changes, the business downturn that began in 2006/2007 is ongoing; there has been no meaningful economic rebound.
GDI. Real U.S economic activity has been virtually unchanged for the last two quarters (second and third quarters) of 2011, per the first revision to the third-quarter 2011 gross domestic income (GDI) estimate, the reporting equivalent of GDP. Straight quarter-to-quarter growth was less than 0.1% for both the second- and third-quarters (0.048%, which rounds to zero the way the BEA works it, and 0.057%, respectively). With the usual hype around using the annualized quarterly rates for these series, annualized, real quarterly GDI grew at a revised 0.23% (initially 0.36%) in the third-quarter, versus 0.19% growth in second-quarter GDI.
On a year-to-year basis, third-quarter GDI growth slowed to a revised 1.08% (previously 1.11%), versus 1.65% in the second-quarter, and against 2.55% in the first-quarter.
GNP. The first revision of third-quarter gross national product (GNP) also was to the downside. GNP is the broadest measure of U.S. economic activity, where GDP is GNP net of trade in factor-income, or interest and dividend payments. Countries suffering net-debtor status tend to prefer reporting GDP, instead of GNP, as the GDP tends to show stronger growth net of payment outflows to whom money is owed. Recent GNP reporting has been heavily skewed by flows tied to global systemic bailout efforts.
Annualized real growth for third-quarter GNP was a revised 1.90% (previously 2.08%), down from 2.16% in the second-quarter, but up from 1.45% in the first-quarter. Year-to-year GNP growth in the third-quarter was a revised 1.79% (previously 1.84%), somewhat slower than the 2.01% estimated for the second-quarter.
NEW ORDERS FOR DURABLE GOODS (November 2011)
November Durable Goods Orders Gain Due to Irregular Surge in Aircraft Orders. The Census Bureau reported today, December 23rd, that the regularly-volatile, seasonally-adjusted new orders for durable goods jumped by 3.8% (by 4.7% before prior-period revisions) for the month of November 2011, following a revised level of unchanged activity (previously a 0.7% monthly contraction) in October.
As often is the case, the monthly change was dominated by irregular and highly volatile long-term nondefense aircraft orders. November’s 3.8% monthly gain would have been 0.6%, but for a 73.3% monthly surge in such bookings, a category that showed a revised 14.0% (previously 16.4%) decline in October. Airplane orders usually are placed years in advance of delivery and rarely impact near-term economic activity.
Current durable goods reporting remains subject to many of the same sampling and concurrent-seasonal-adjustment problems that are seen with retail sales and payroll reporting. Unusual seasonal-factor volatility raises issues as to the significance of the latest adjusted monthly changes, although unadjusted year-to-year change has shown some recent flattening or softening in annual growth in the latter half of 2011. The numbers here are not adjusted for inflation.
Unadjusted, year-to-year growth in total November 2011 new orders was 12.2%, versus a revised 7.8% (previously 6.9%) annual gain in October, and against 4.2% annual gain previously reported for September.
The widely followed nondefense capital goods orders also rose in November, up 8.1% (up by 9.9% before prior-period revisions) for the month, versus a revised monthly 3.5% (previously 4.6%) contraction in October orders. The November gain here also was dominated by surging aircraft sales. Month-to-month orders were down by 1.2% net of nondefense aircraft. For November, the unadjusted year-to-year growth in the series bounced to 12.1%, having been at a revised 2.7% (previously 0.6%).
NEW HOME SALES (November 2011)
November New-Home Sales Continued to Bottom-Bounce. November new home sales continued bottom-bouncing, in line with November housing starts. See prior Commentary No. 408 for detail on the latest housing starts and existing home sales reporting.
This morning’s (December 23rd) release of November new-home sales (counted based on contract signings, Census Bureau) showed an ongoing pattern of stagnation at an historically-low level of activity. November’s 1.6% monthly gain (an increase of 2.5% before prior-period revisions) +/- 14.2% (95% confidence interval) versus October was statistically meaningless. In turn, October’s monthly gain was unrevised at 1.3% versus September. The year-to-year change in November 2011 new-home sales was a statistically-insignificant gain of 9.8% +/- 23.3% (95% confidence interval). October’s annual gain was revised to 9.9% (previously 8.9%).
Recent volatility in annual change was due to the effects of lapsing housing stimulus efforts a year ago. Also, as with existing home sales, part of the new sales volume is due to foreclosure activity, but the Census Bureau does not provide an estimate of foreclosure volume.

Week Ahead. Recognition of an intensifying double-dip recession as well as an escalating inflation problem still is sporadic. The political system would like to see the issues disappear until after the 2012 election, the media does its best to avoid publicizing unhappy economic news during the holiday shopping season, and the financial markets will do their best to avoid recognition of the problems for as long as possible, problems that have horrendous implications for the markets and for systemic stability.
Until such time as financial-market expectations move to catch up fully with underlying reality, or underlying reality catches up with the markets, reporting generally will continue to show higher-than-expected inflation and weaker-than-expected economic results in the months and year ahead. Increasingly, previously unreported economic weakness should show up in prior-period revisions.
No Major Economic Releases Scheduled in the Week Ahead.
Unemployment Rate and Payroll Employment (December 2011). Nonfarm payrolls and the unemployment rate for December 2011 are the next major economic releases due for publication, on Friday, January 6, 2012. This first major indicators of December economic activity likely will signal ongoing deterioration in broad economic conditions. A pattern of weaker-than-expected reporting remains a good bet, against a likely stronger payroll consensus expectation, and against a likely unchanged unemployment rate expectation.
Payrolls still remain at risk of showing an outright monthly contraction. Yet, as seen again with last month’s change in headline payrolls, whatever is reported likely will include a payroll contraction within the 95% statistical reporting confidence interval of +/- 129,000 for payroll change.
The headline unemployment rate dropped meaningfully (by 0.4%) in November, reflecting a large number of unemployed—unable to find jobs—abandoning active job searching, leaving the headline labor force and entering the government’s classification of a short-term discouraged worker.
Unusual seasonal-adjustment patterns, though, also were at work in the November unemployment detail, and some catch-up is likely in December or January reporting. Keep in mind that monthly changes in the unemployment rate that are within the 95% confidence interval of +/- 0.2% are not statistically meaningful.
__________