No. 437: April CPI, Real Earnings, Retail Sales, Euro
COMMENTARY NUMBER 437
April CPI, Real Earnings, Retail Sales, Euro
May 15, 2012
__________
“Core” CPI-U Inflation Hits Cycle High
April Year-to-Year Inflation Softens: 2.3% (CPI-U), 2.4% (CPI-W), 9.9% (SGS)
Real Average Weekly Earnings in Ongoing Year-to-Year Decline
Retail Sales Were Stagnant, Statistically Insignificant
__________
PLEASE NOTE: The next regular Commentary is scheduled for tomorrow, Wednesday, May 16th, covering April industrial production and housing starts, followed by a Commentary on Friday, May 18th, which will examine the annual benchmark revision to new orders for durable goods.
The Public Commentary on Inflation Measurement will posted later today as Commentary No. 438, in the “Latest Newsletter” or left-hand column of http://www.ShadowStats.com.
Best wishes to all — John Williams
Opening Comments and Executive Summary. Note: a more complete economic review will follow in tomorrow’s May 16th Commentary. Seasonal factors once again reduced reported gasoline price inflation, which, in turn, offset rising prices elsewhere. The April CPI-U was unchanged month-to-month, with annual inflation slowing to 2.30% versus 2.65% in March. The annual changes are against the year-ago initial inflation surge that followed the Fed’s introduction of QE2.
The effects of the resulting high oil prices still are spreading throughout the broad economy, though, with year-to-year “core” CPI-U inflation rising to its cycle peak of 2.31% in April, up from 2.26% in March and actually topping the full CPI-U by a minimal amount.
The annual core inflation rates for both the CPI and PPI are plotted in the following graph.

Despite the low monthly inflation, real average weekly earnings, as reported by the Bureau of Labor Statistics (BLS) continued to contract on a year-to-year basis in April, down 0.2% for all employees on private nonfarm payrolls, and down 0.4% for production and nonsupervisory employees. Again, the income picture remains structurally impaired, with consumer spending unable to sustain positive economic growth. Spending constraints from contracting inflation-adjusted income growth are exacerbated by limited or no growth in consumer credit, as discussed in the prior Commentary No. 436.
The consumer’s structural liquidity problems were evident in the lack of statistically-significant monthly growth in retail sales. The April 0.1% monthly gain was accounted for by an equivalent downside revision to the March activity, a further revision subsequent to the downside benchmark revisions published on April 30th. With monthly inflation unchanged, real retail sales were equally flat and were statistically insignificant.
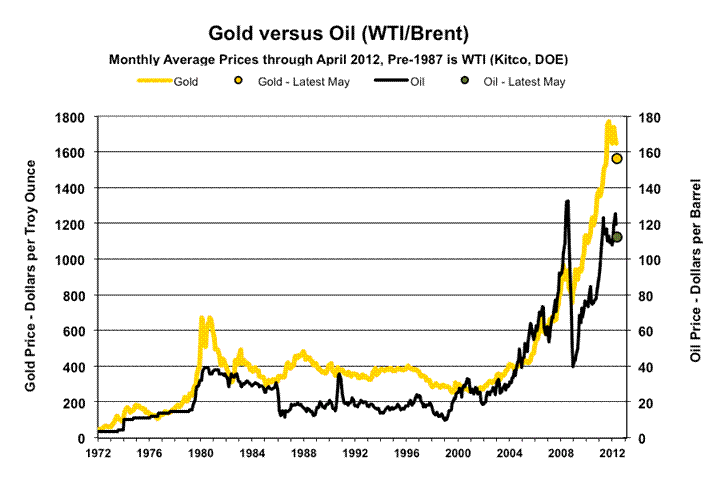
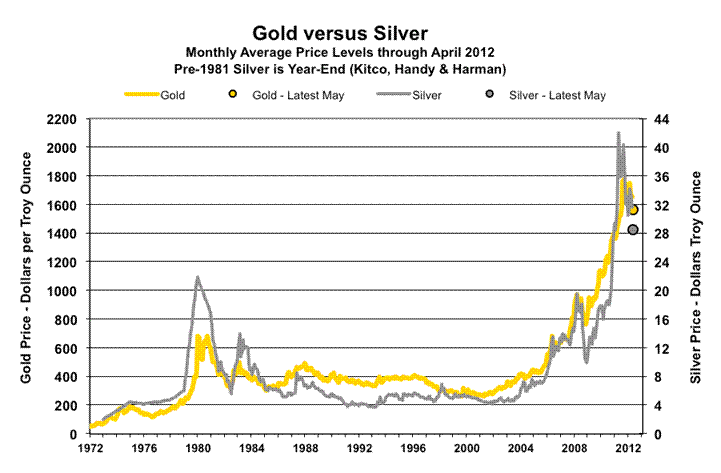
Hyperinflation Watch—Euro Woes. Again, the currency with the biggest problems remains the U.S. dollar, and that will be reflected in the global markets at some point. Near-term selling pressure against the euro has boosted the dollar, which in turn has hit precious metals and oil, as reflected in the regular graphs related to gold, silver, oil and the Swiss franc. I would expect the euro weakness versus the U.S. currency to be relatively short-lived, eventually reversing as dollar selling kicks in. The timing is anyone’s guess, but the underlying fundamentals remain in place against the dollar and strongly favoring the precious metals and the healthier Western currencies.
As discussed in the prior Commentary, potential triggers for the market shift against the dollar include, but are not limited to, new Fed accommodation and/or banking system problems, a particularly nasty presidential campaign, and/or a shock economic statistic that hits the financial markets the wrong way.
Otherwise, in the context of the updated background published in Special Commentary No. 426 and Special Commentary No. 429, and with full consideration of subsequent economic, inflation and financial-market developments, the broad economic, inflation and hyperinflation outlooks discussed in the January 25th Hyperinflation 2012 have not changed.

__________
REPORTING DETAIL
CONSUMER PRICE INDEX—CPI (April 2012)
Seasonal Adjustments Suppressed Gasoline Price Inflation. Once again, negative seasonal adjustments to gasoline prices largely offset rising prices elsewhere in the economy, with seasonally-adjusted CPI-U unchanged month-to-month in April. Accordingly, the so-called “core” CPI-U inflation rate—net of food and energy—jumped by 0.24% in the month, with annual “core” inflation rising to a cycle high of 2.31% in the period since Fed Chairman Bernanke began jawboning for QE2 late in 2010.
Notes on Different Measures of the Consumer Price Index. The Consumer Price Index (CPI) is the broadest inflation measure published by U.S. Government, through the Bureau of Labor Statistics (BLS), Department of Labor: The CPI-U (Consumer Price Index for All Urban Consumers) is the monthly headline inflation number (seasonally adjusted) and is the broadest in its coverage, representing the buying patterns of all urban consumers. Its standard measure is not seasonally adjusted, and it never is revised on that basis except for outright errors, The CPI-W (CPI for Urban Wage Earners and Clerical Workers) covers the more-narrow universe of urban wage earners and clerical workers and is used in determining cost of living adjustments in government programs such as Social Security. Otherwise its background is the same as the CPI-U. The C-CPI-U (Chain-Weighted CPI-U) is an experimental measure, where the weighting of components is fully substitution based. It generally shows lower annual inflation rate than the CPI-U and CPI-W. The latter two measures once had fixed weightings—so as to measure the cost of living of maintaining a constant standard of living—but now are quasi-substitution-based. Since it is fully substitution based, the series tends to reflect lower inflation than the other CPI measures. Accordingly, the C-CPI-U is the "new inflation" measure being proffered by Congress and the White House as a tool for reducing Social Security cost-of-living adjustments by stealth. Moving to accommodate the Congress, the BLS announced pending changes to the C-CPI-U estimation and reporting process on October 22, 2014, which are described in Commentary No. 668 The ShadowStats Alternative CPI-U measures are attempts at adjusting reported CPI-U inflation for the impact of methodological change of recent decades designed to move the concept of the CPI away from being a measure of the cost of living needed to maintain a constant standard of living.
The BLS reported a not-seasonally-adjusted 1.8% monthly gain in April gasoline prices, versus a 1.3% monthly gain indicated by the more comprehensive surveying of the DOE. Seasonal adjustments in April depressed gasoline price inflation, turning that unadjusted 1.8% monthly gain in gasoline into a seasonally-adjusted 2.6% contraction.
After 16 of the last 17 months showing rising annual “core” CPI-U inflation (net of food and energy inflation), the April 2012 core rate increased to a cycle-high 2.31%, up from 2.26% in March. That remained well above the core inflation of 0.61%, in November 2010, when Mr. Bernanke introduced QE2 in a successful effort to debase the dollar, with the effect of spiking oil prices. The core annual inflation numbers for both the CPI-U and PPI reflect the ongoing impact of higher energy prices in the broad economy (see the graph and comments in the Opening Comments and Executive Summary).
April 2012 unadjusted year-to-year CPI-U inflation dropped to 2.30% from 2.65% in March.
Year-to-year total CPI-U inflation would increase or decrease in next month’s May 2012 reporting, dependent on the seasonally-adjusted monthly change, versus the 0.27% gain in the adjusted monthly level reported for May 2011. I use the adjusted change here, since that is how consensus expectations are expressed. To approximate the annual unadjusted inflation rate for May 2012, the difference in May’s headline monthly change (or forecast of same) versus the year-ago monthly change should be added to or subtracted directly from the April 2012 annual inflation rate of 2.30%.
CPI-W. The narrower, seasonally-adjusted CPI-W, which has greater weighting for gasoline than does the CPI-U, also effectively was unchanged for the month, down by 0.03% (up by 0.31% unadjusted) in April 2012, versus a gain of 0.33% (up by 0.89% unadjusted) in March.
Unadjusted, April 2012 year-to-year CPI-W inflation was 2.38%, down from 2.85% in March.
C-CPI-U. Year-to-year inflation in the April 2012 C-CPI-U eased to 2.07% from 2.36% in March.
The chain-weighted CPI-U is the fully substitution-based series that gets touted as a CPI replacement by inflation apologists and by those who oppose use of the existing CPI-U and CPI-W, including a number of politicians looking to cut deficit spending by using the C-CPI-U to reduce Social Security annual cost of living (COLA) adjustments artificially. The series is reported only on an unadjusted basis and is revised annually for the prior two years, unlike the unadjusted CPI-U, which never is revised, except for outright calculation errors.
Alternate Consumer Inflation Measures. Adjusted to pre-Clinton (1990) methodology, annual CPI inflation was roughly 5.6% in April 2012, versus 6.0% in March. The SGS-Alternate Consumer Inflation Measure, which reverses gimmicked changes to official CPI reporting methodologies back to 1980, was about 9.9% (9.94% for those using the extra digit) in April 2012, against March’s 10.3%.
The SGS-Alternate Consumer Inflation Measure adjusts on an additive basis for the cumulative impact on the annual inflation rate of various methodological changes made by the BLS (the series is not recalculated). Over the decades, the BLS has altered the meaning of the CPI from being a measure of the cost of living needed to maintain a constant standard of living, to something that neither reflects the constant-standard-of-living concept nor measures adequately most of what consumers view as out-of-pocket expenditures. Roughly five percentage points of the additive SGS adjustment reflect the BLS’s formal estimate of the annual impact of methodological changes; roughly two percentage points reflect changes by the BLS, where SGS has estimated the impact not otherwise published by the BLS. (See the Public Commentary on Inflation Measurement to be published later today as Commentary No. 438 at www.ShadowStats.com, left-hand column, for further detail.)
Gold and Silver Highs Adjusted for CPI-U/SGS Inflation. Despite the September 5, 2011 historic-high gold price of $1,895.00 per troy ounce (London afternoon fix), and despite the multi-decade-high silver price of $48.70 per troy ounce (London fix of April 28, 2011), gold and silver prices have yet to re-hit their 1980 historic levels, adjusted for inflation. The earlier all-time high of $850.00 (London afternoon fix, per Kitco.com) of January 21, 1980 would be $2,514 per troy ounce, based on April 2012 CPI-U-adjusted dollars, $9,220 per troy ounce based on SGS-Alternate-CPI-adjusted dollars (all series not seasonally adjusted).
In like manner, the all-time high price for silver in January 1980 of $49.45 per troy ounce (London afternoon fix, per silverinstitute.org), although approached in 2011, still has not been hit since 1980, including in terms of inflation-adjusted dollars. Based on April 2012 CPI-U inflation, the 1980 silver price peak would be $146 per troy ounce and would be $536 per troy ounce in terms of SGS-Alternate-CPI-adjusted dollars (again, all series not seasonally adjusted).

As shown in Table 1 on page 50 of Hyperinflation 2012, over the decades, the increases in gold and silver prices have compensated for more than the loss of the purchasing power of the U.S. dollar as reflected by CPI inflation, while they effectively have compensated fully for the loss of purchasing power of the dollar based on the SGS-Alternate Consumer Price Measure (1980 Methodologies Base).
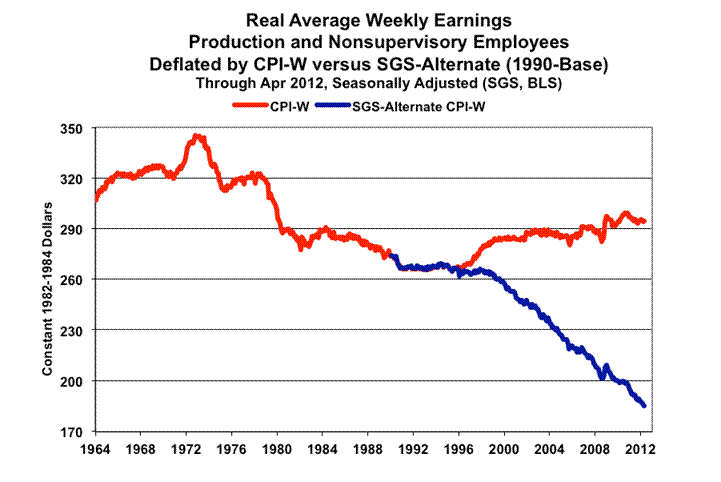
Real Earnings. Coincident with today’s (May 15th) CPI release, the BLS published real (inflation-adjusted) average weekly earnings for April 2012. For all employees on private nonfarm payrolls, real average weekly earnings (deflated by the CPI-U) were unchanged in April, following a 0.1% decline in March. Year-to-year, earnings fell by 0.2% in April, after a 0.1% decline in March.
For all production and nonsupervisory employees on private nonfarm payrolls, real average weekly earnings (deflated by the CPI-W) were up by 0.2% for the month, following a 0.1% decline in March. Year-to-year, earnings fell by 0.4% in April, after a 0.4% decline in March. The production and nonsupervisory employees series is the only one with meaningful historical data, and it is plotted in the following graph, reflecting both CPI-W deflation and deflation using the SGS-Alternate Inflation Measure (1990-Base).
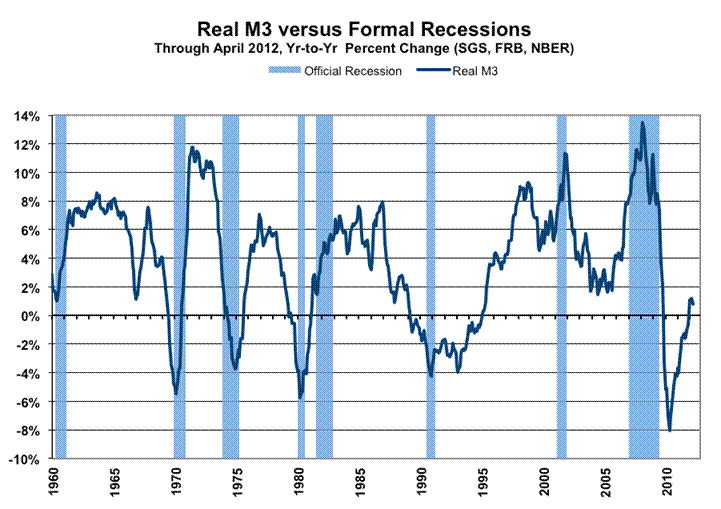
Real Money Supply M3. The signal for a double-dip or ongoing recession, based on annual contraction in the real (inflation-adjusted) broad money supply (M3), discussed in the in Hyperinflation 2012, remains in place and continues, despite real annual M3 growth having turned to the upside. Based on the April 2012 CPI-U report and the latest April SGS-Ongoing M3 Estimate, the annual growth in real M3 for April 2012 slowed to 0.8%, versus a revised 1.1% (previously 1.0%) gain estimated for March. As with the nominal M3 series, the pick-up in annual growth appears to have stalled.
The signal for a downturn or an intensified downturn is generated when annual growth in real M3 first turns negative in a given cycle; the signal is not dependent on the depth of the downturn or its duration. Breaking into positive territory does not generate a meaningful signal one way or the other for the broad economy. The current downturn signal was generated in December 2009. The broad economy tends to follow in downturn or renewed deterioration roughly six-to-nine months after the signal. Weaknesses in a number of series continued in 2011, with some new softness seen in recent reporting. A renewed downturn in official data should be obvious to most observers by mid-2012—before the election—eventually leading to recognition of a double-dip recession.
RETAIL SALES (April 2012)
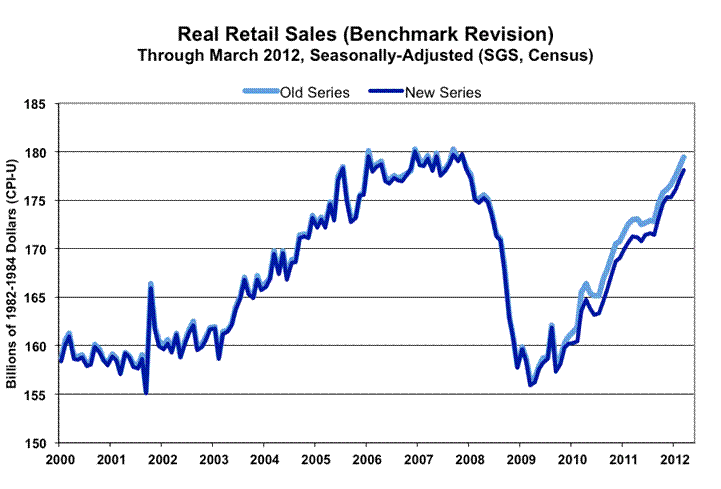
Benchmark Revision. The annual benchmark revision to retail sales was published on April 30th, showing a downside restatement to retail sales activity of recent years. Those revisions were discussed in Commentary No. 433, and they are used as the base for the new retail data published this morning, May 15th. The following graph was published in the benchmark Commentary. It does not include updated data from the April release.
Minimal Growth in Retail Sales Was Not Statistically Meaningful. With effectively no seasonally-adjusted inflation in April, monthly retail sales were negligible both before and after adjustment for inflation. The headline growth numbers were not statistically significant.
The reporting quality issues for this series were seen anew in the April reporting, with revisions on top of the benchmark revisions. They reflected unstable seasonal-factor readjustments from the concurrent seasonal-adjustment issues and broader distortions seen otherwise in other seasonal-adjustment factors and sampling methodologies, as discussed in Hyperinflation 2012.
The stability of the seasonal-adjustment process and sampling methods have been disrupted severely by the unprecedented depth and length of the current economic downturn in the post-World War II era (the period of modern economic reporting).
Under such circumstances, where the markets effectively are flying blind as to actual economic activity, consideration of broad underlying fundamentals is essential. Consumer income and credit remain structurally impaired, as discussed recently in Special Commentary No. 429 and in Commentaries Nos. 434 and 436. Those factors continue to signal economic deterioration, not recovery, with the broad economy remaining in serious trouble.
Nominal (Not-Adjusted-for-Inflation) Retail Sales. Today’s (May 15th) report on April 2012 retail sales—issued by the Census Bureau—indicated a statistically-insignificant, seasonally-adjusted monthly gain of 0.15% (unchanged or 0.00% before prior-period revisions) +/- 0.6% (all confidence intervals are at the 95% level). April’s increase followed a post-benchmark revised March monthly gain of 0.68%.
April 2012 retail sales were reported up by 6.36% +/- 0.8%, where year-to-year growth in March 2012 retail sales was 6.63%.
Core Retail Sales. Assuming that the bulk of non-seasonal variability in food and gasoline sales is in pricing, instead of demand, “core” retail sales—consistent with the Federal Reserve’s preference for ignoring food and energy prices when “core” inflation is lower than full inflation—are estimated using two approaches:
Version I: April 2012 versus March 2012 seasonally-adjusted retail sales series—net of total grocery store and gasoline station revenues—was up by 0.18%, versus an official gain of 0.15%.
Version II: April 2012 versus March 2012 seasonally-adjusted retail sales series—net of the monthly change in revenues for grocery stores and gas stations—was up by 0.14% versus an official gain of 0.15%.
Real (Inflation-Adjusted) Retail Sales. Based on today’s April CPI-U reporting, inflation- and seasonally-adjusted April 2012 retail sales rose by 0.11% for the month, where, before inflation-adjustment, the current number was up by 0.15%. March real retail sales were up by 0.39% versus nominal growth of 0.68%. Net of the increases in retail prices, the implied current and recent monthly gains in the physical volume of goods and services sold have not been statistically meaningful.
April real retail sales rose at a year-to-year pace of 3.97%, versus 3.88% in March.
The ongoing “recovery” in real retail sales is reflected in the latest regular monthly graphs of the levels of CPI- and seasonally-adjusted activity, as well as an “inflation-corrected” real retail sales graph, which adjusts the deflation process to reflect the use of the SGS-Alternate CPI Inflation, removing the dampening effects on reported inflation from the post-1990 methodological changes in the CPI reporting. As discussed in Hyperinflation 2012 and a number of subsequent Commentaries, deflation by too-low an inflation number (such as the CPI-U) results in the deflated series overstating economic growth.
The first graph shows the post-World War II real (deflated by the CPI-U) retail sales activity. The second graph shows the same numbers in greater detail since 2000. The third graph shows the second graph with the deflation adjusted to the levels of the SGS-Alternate CPI (1990-Base).


As official consumer inflation picks up again, and as overall retail sales suffer from the ongoing consumer liquidity squeeze, these data should turn down meaningfully in what eventually will become a formal double-dip recession.
There has been no change in the underlying fundamentals. There is nothing that would support a sustainable turnaround in retail sales, personal consumption or in general economic activity. There is no recovery, just general bottom-bouncing. Accordingly, real retail sales levels in the months ahead should turn negative.
Week Ahead. Recognition of an intensifying double-dip recession as well as an escalating inflation problem remains sporadic. The political system would like to see the issues disappear until after the election; the media does its best to avoid publicizing unhappy economic news; and the financial markets will do their best to avoid recognition of the problems for as long as possible, problems that have horrendous implications for the markets and for systemic stability.
Until such time as financial-market expectations move to catch up fully with underlying reality, or underlying reality catches up with the markets, reporting generally will continue to show higher-than-expected inflation and weaker-than-expected economic results in the months and year ahead. Increasingly, previously unreported economic weakness should show up in prior-period revisions.
Industrial Production (April 2012). April data on industrial production are due for release tomorrow, Wednesday, May 16th. Weakness in consumer demand has led to an involuntary build-up in inventories, and early efforts at reducing that excess stock of goods was a factor in the lack of production growth reported for March. Despite indications of strong market expectations for the headline production number, inventory issues likely were a constraining factor on April production, as well. Accordingly, there is a fair risk of a downside reporting surprise versus consensus forecasts.
Residential Construction (April 2012). Data on April housing starts also are due for release tomorrow, Wednesday, May 16th. The series likely has continued its four-year pattern of stagnation at an historically low level of activity. As has been the case for some time, any reported monthly gain likely will not be statistically significant.
New Orders for Durable Goods (Benchmark Revision). The annual benchmark revision to new orders for durable goods is due for release on Friday, May 18th. The general pattern there should be one of downside revisions, as seen recently in retail sales and industrial production. Where more complete data are available, the economy in 2010 should be reported as having been weaker than estimated previously. Data subsequent to 2011 likely will be built up with the same overly-optimistic underlying assumptions that currently are in place, but growing off a weaker base.
__________