No. 595: Fed Policy, Household Income, Durable Goods, Home Sales, Money Supply Revisions
COMMENTARY NUMBER 595
Fed Policy, Household Income, Durable Goods, Home Sales, Money Supply Revisions
January 28, 2014
__________
Seen Again: U.S. Dollar Has Lost Safe-Haven Status
Ongoing Fed Tapering Likely to Stall, Reverse
Money Growth Shows Mounting Systemic Stress
December New Home Sales and Durable Goods Orders
Hit by Corrective, Broad-Based Pullbacks and Downside Revisions
December Household Income Remained Stagnant, Near Cycle Low
__________
PLEASE NOTE: The next regular Commentary is scheduled for Thursday, January 30th, covering the advance estimate of fourth-quarter 2013 GDP.
Best wishes to all — John Williams
OPENING COMMENTS AND EXECUTIVE SUMMARY
Dollar Vulnerability Increases Amidst Unstable Markets and Corrective Economic Reporting. With a variety of troubled financial circumstances around the world, one factor that should be disturbing to those living in a U.S. dollar-denominated environment is that global markets have been seeking safety elsewhere.
In last week’s financial-market turmoil, flight-to-safety was seen in gold, the Swiss franc and the Japanese yen, not the U.S. dollar, as had been the tradition for decades of the post-World War II era. This altered state of global financial perceptions has been in place since at least the onset of the “Arab Spring” of 2011, when political turmoil in the Middle East and North Africa again was met with a flight to safety in gold and the Swiss franc, not the U.S. dollar. That circumstance was not helped by the downgrade in the sovereign rating of the United States later that year.
Fed Tapering Still Not Likely. The market instabilities were coincident with stories that the U.S. Federal Reserve was ready to taper again. In theory, such an act would be a plus for the U.S. currency. Continued sharp deterioration in monetary stability, as discussed in the Hyperinflation Watch section, combined with last week’s market turmoil, however, would seem to argue against an imminent, further tightening move by the Fed.
Nonetheless, if conventional wisdom prevails and the Fed does taper tomorrow (January 29th), the reduction in QE3 likely again would be minimal and tied to the politics of the change in control of the Federal Reserve Board. With the Fed facing intensifying, not lessening, financial-system stress, incoming Fed Chairman Janet Yellen likely will find herself soon under pressure to increase easing, anew, irrespective of any policy action or inaction out of tomorrow’s FOMC meeting.
As long as a specific liquidity problem or systemic-vulnerability issue—domestic or global—is recognized enough in advance, the Federal Reserve and U.S. Treasury can and will do to their best to mitigate its impact on the financial system. Beyond anticipated issues, though, it most often is the “surprise” or an official action of outright stupidity that tends to trigger the great financial panics. All those elements await the new Fed Chairman.
Corrective Reporting and Revisions Have Begun to Dampen the Economic Outlook. Given the apparent, heavily-positive distortions in recent economic reporting, from the impact of the government shutdown (see Commentary No. 585), some corrective downside revisions and reported pullbacks have begun to surface. Such was seen in the housing sector and in new orders for durable goods, and is reviewed in today’s (January 28th) Commentary.
At the same time, the latest indicators of consumer liquidity conditions continue to show no improvement, suggesting, again, that the broad economy is not recovering, but turning down in a new recession.
December 2013 New Orders for Durable Goods—Decline Went Well Beyond Commercial-Aircraft Orders Volatility. The headline 4.3% decline in December 2013 durable goods orders was broadly based, extending well beyond the impact of the headline 17.5% monthly drop in irregular commercial aircraft orders. Net of the aircraft orders that so often dominate the monthly change in aggregate order activity, orders still fell by 3.0%. Included in the broad orders weakness, new orders for automobiles declined by 5.8%, orders for computers and electronic products fell by 7.8%, and orders for defense capital goods were down by 21.5%.
The aggregate reporting for December likely not only reflected some corrective pullback in orders, but also some corrective downside revisions to the reporting of prior activity. Separately, in nominal terms, before adjustment for inflation, year-to-year or annual growth in new orders was just 0.1%. In real terms, after adjustment for inflation, annual orders declined by 0.9%.
All factors considered, the December pullback in new orders for durable goods broadly was outside the bounds of normal monthly volatility. As a result, the ongoing longer-term pattern of stagnation remained in place for the series—particularly when viewed net of inflation—despite any short-term blips, but the recent slight uptrend in the pattern of stagnation now may have turned to a downtrend. The growth patterns in this series remain of a nature that commonly precedes or coincides with a recession or deepening business downturn.
Nominal (Not-Adjusted-for-Inflation) December 2013 Reporting. The headline, seasonally-adjusted nominal level of December 2013 new orders for durable goods fell by 4.30%, following a revised November gain of 2.60% (previously 3.50%). Before prior-period revisions, total new orders in December fell by 4.71%.
The reporting of contractions and surges in commercial aircraft orders is seen in an irregularly-repeating process throughout the year. These extremely volatile orders, which usually dominate the aggregate durable goods growth numbers, are booked well into the future and are indicative more of longer-term, rather than shorter-term prospects for manufacturing activity.
Nondefense (or commercial) aircraft orders fell by 17.51% in December, following a revised 21.08% gain in November. Net of prior-period revisions, December commercial-aircraft orders fell by 17.99%. Net of the aircraft numbers, total new orders fell by 2.98%, versus a revised 1.05% (previously 1.97%) gain in November.
What these numbers show over the last seven months is no meaningful change (down by 1.49%)—effectively stagnation—in new orders for durable goods, net of commercial-aircraft order activity and before any consideration for the effects of inflation. The seven-month change is down by 2.08% net of the PPI capital goods inflation.
Aircraft-order volatility also impacted year-to-year change in seasonally-adjusted, total new orders. Total orders in December 2013 were up by 0.10%, down by 1.65% ex-commercial aircraft, versus a revised November gain of 9.98%, up by a revised 6.50% ex-commercial aircraft.
Further affected by aircraft-order activity were the seasonally-adjusted new orders for nondefense capital goods, which fell by 4.97% in the month of December, down by 0.75% ex-commercial aircraft, versus a revised 7.84% gain in November, up by a revised 4.01% ex-commercial aircraft.
Real (Inflation-Adjusted) Durable Goods Orders—December 2013. Headline monthly inflation in the December PPI finished goods, capital equipment measure was a seasonally-adjusted 0.12%, month-to-month gain, versus a 0.06% monthly gain in November. On an annual basis, December 2013 inflation was reported at 1.04% versus 0.98% in November.
Adjusted for that inflation, and as reflected in the accompanying graphs, real month-to-month aggregate orders fell by 4.42% in December, versus a revised 2.54% gain in November. Ex-commercial aircraft, they fell for the month by 3.10% in December, and rose by a revised 0.99% in November. Real year-to-year aggregate orders fell by 0.93% in December, versus a revised 8.91% gain in November, and, ex-commercial aircraft, they declined by 2.66% in December, following a revised gain of 5.47% in November.
Graphs of Inflation-Adjusted and Smoothed Durable Goods Orders. As usually shown and discussed in the Commentaries covering new orders for durable goods, the following two graphs plot the new orders for durable goods, adjusted for inflation. These graphs show monthly as well as a six-month moving average of the activity level. The first graph shows the aggregate new orders series. The second series is net of the unstable commercial-aircraft order sector, and, accordingly, it is somewhat smoother than the first graph.
In terms of inflation-adjusted activity, both of these series have shown a slowing uptrend and flattening-out in the last two-to-three years—with a dip and upside bouncing into 2013, and renewed downturn with December 2013 reporting. Broadly, there has been a recent general pattern of stagnation or bottom-bouncing evident in the orders—clearly not the booming recovery that is seen in official GDP reporting. The real (inflation-adjusted) level of orders in December 2013 remained at or below both the pre-2001 and pre-2007 recession highs. The pattern of recent stagnation in the inflation-adjusted series also is one that commonly precedes or is coincident with a recession.
The capital spending inflation measure from the PPI, which is used here to adjust durable goods orders for inflation, understates inflation. That has the effect of overstating inflation-adjusted growth. If the deflation measure here were corrected meaningfully for the hedonic-adjusted understatement of the respective PPI inflation measure (see Public Comment on Inflation), the post-2009 uptrend in real orders likely would be little more than a flat line, reflecting ongoing bottom-bouncing along a low-level plateau of economic activity, with a pattern of renewed downturn now well entrenched.
December 2013 New Home Sales—Pullback and Downside Revisions. With December new-home sales falling by 7.0%, in the context of downside revisions to earlier data, reporting of the housing-industry numbers appears to have entered a corrective phase. The headline December sales level reflected a statistically-insignificant 4.5% gain from December 2012, and should turn negative year-to-year in January 2014. December 2013 activity still was down by 70.2% from the pre-recession peak activity seen in June 2005. With the December data reported and restated a little closer to reality, reporting of the next several months should continue to move in that general direction, along with eventual corrective annual revisions to the series.
Underlying Fundamentals Show No Relief for the Housing Market. The problem for the housing market, along with much of the broad economy, ties directly to the severe, structural liquidity problems impairing consumer spending and consumption. There have been no developments in underlying economic fundamentals, consumer conditions or otherwise, that would suggest a pending housing-industry turnaround or a rebound in broad business activity. Underlying reality favors a renewed downturn in general economic activity, as increasingly suggested by the existing-home-sales, new orders for durable goods and other series.
Updating Commentary No. 590 on these liquidity issues are the two graphs that follow. The first graph reflects real (inflation-adjusted) median household income as of December 2013, as published by www.SentierResearch.com, based on monthly surveying by the Census Bureau. While the monthly index level was unchanged at the first decimal point, median household income continued to hold near the cycle trough of the series. As the broad economy purportedly rebounded from June 2009, household income instead plunged into 2011, and it generally has been stagnant at a low level of activity, ever since.
Along with consumer confidence, seen in the second graph, household income has shown a broad pattern of plunge-and-stagnation in the current economic crisis, as opposed to the GDP’s purported pattern of plunge, recovery and expansion. Those issues will be reviewed in Commentary No. 596 of January 30th, following the release of the “advance” estimate of fourth-quarter 2013 GDP (see the Week Ahead section).
The Conference Board’s January 2014 reading of consumer confidence showed a small, monthly increase, but the level of confidence remained deep in historical recession territory, well shy of levels—perhaps 60% higher—that tend to signal the type of booming economic recovery currently reported in the GDP, let alone any economic recovery at all.
December New-Home Sales Reporting Reflected Both Current-Reporting Catch Up and Downside Revisions. Headline December 2013 new-home sales (counted based on contract signings) fell by a statistically-insignificant 7.0%, following a revised 3.9% (previously 2.1%) decline in November, which followed a revised 14.9% (previously 17.6%, initially 25.4%) gain in October. Before prior-period revisions, December sales fell by 10.8% for the month.
Year-to-year, December 2013 sales rose by a statistically-insignificant 4.5%, and the series should turn negative year-to-year with January’s reporting. The December annual gain was against a revised year-to-year increase of 11.8% in November.
New-Home Sales Graphs. The regular monthly graph of new-home sales activity follows, along with graphs of December 2013 housing starts and existing-home sales (respectively from Commentary No. 593 and Commentary No. 594) for comparison.
In the first graph, even with the still-big upswing in October sales, new-home sales activity in 2013 appears to have been stagnant, on average, with December reporting pulling back to pre-bloat levels (before the apparent upside distortions that came out of the data gathering process surrounding the government shutdown). Similar adjustments are likely to follow in subsequent reporting of housing starts activity (second graph).
Smoothed for irregular distortions, the existing-home sales series (third graph) remained statistically consistent with a period of broad stagnation, turning into a faltering downtrend.
[For greater detail on December new orders for durable good and new-home sales,
see the Reporting Detail section.]
__________
HYPERINFLATION WATCH
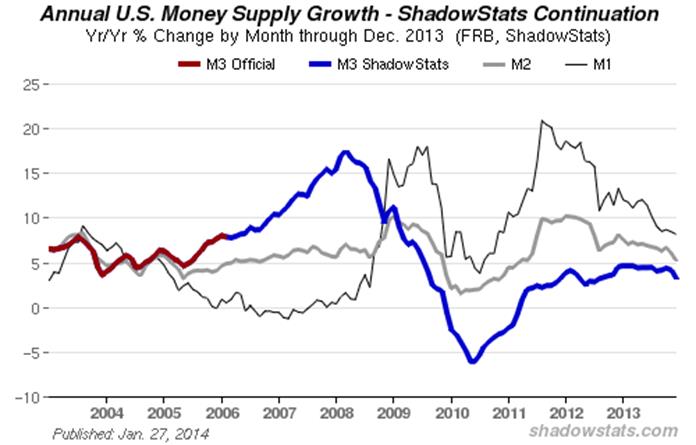
New Money Supply Numbers. On January 23rd, the Federal Reserve published its annual revisions to seasonal adjustments in the “Money Stock” as well as a new quarterly benchmark revision. Per the Fed, “The revisions to the seasonal factors resulted in a higher growth rate for seasonally adjusted M2 in the first half of 2013 and a lower growth rate for seasonally adjusted M2 in the second half.” The annual growth differences tend to be less than 0.2% in terms of year-to-year change.
Where M2 is the largest single component of M3, and other M3 components were affected, the ShadowStats-Ongoing M3 Estimate has been revised in tandem (full definitions of the various money measures are found in the Money Supply Special Report. All the updated M1, M2 (includes M1) and M3 (includes M2) numbers are published on the Alternate Data tab of www.shadowstats.com, and plotted in the accompanying graph.
The slowing pattern of annual growth in M3 that had been in place, continues in place and appears to be ongoing, with a very early projection of year-to-year growth in M3 for January 2014 slowing to around 3.0% (see comments and graphs ahead on the monetary base) from the 3.2% currently estimated for M3 in December 2013. The last point in the following graph is for December 2013.
Annual Growth in Monetary Base Tops Off As Year-Ago Comparison Takes In QE3 Expansion. Mirroring the ongoing QE3 activity, the monetary base has continued in uncharted territory in terms of historical level. Year-to-year growth for the near-term cycle, however, is topping out at the moment, since the year-ago comparison is taking in the initial monetary base pick-up from the expansion of QE3 in at the onset of 2013.
As shown in the accompanying graphs, the monetary base (St. Louis Fed) was at a seasonally-adjusted (SA) two-week average level of $3,819.2 billion as of January 22nd, an all-time high, with year-to-year growth at 36.6%. The regular fortnightly data are reflected in the next two graphs following.
Monetary Base versus M3—Expanded “Tapering” of QE3 Still Remains Unlikely. The monetary base is currency in circulation (part of M1 money supply) plus bank reserves (not part of the money supply) (again, see a more-complete definition in the Money Supply Special Report). Traditionally, the Federal Reserve has used the monetary base to increase or decrease growth in the money supply, but that has not had its normal impact in the post-2008 crisis period.
Instead, financially-troubled banks have been holding their excess reserves with the Federal Reserve, not lending the available cash into the normal flow of commerce. When the Fed monetizes U.S. Treasury securities, as it has been doing, that usually adds directly to the broad money supply, and it contributes to selling pressure against the U.S. dollar. Unresponsive year-to-year growth in broad money supply M3, in this circumstance, tends to be an indication of mounting systemic stress in the banking industry.
While there has been no significant flow-through to the broad money supply from the expanded monetary base—a problem directly related to banking-system solvency—there still appears to have been some impact. As shown in the updated graph (third graph following), there is a correlation between annual growth in the St. Louis Fed’s monetary base estimate and annual growth in M3, as measured by the ShadowStats-Ongoing M3 Estimate. The correlations between the growth rates are 58.1% for M3, 39.9% for M2 and 36.7% for M1, all on a coincident basis versus growth in the monetary base.
Increasing Stress in the Banking System. The Fed’s easing activity of recent years has been aimed primarily at supporting banking-system solvency and liquidity, not at propping the economy. When the Fed boosts its easing, but money growth slows or does not respond, there is a suggestion of mounting financial stress within the banking system.
Indeed, the divergence between the patterns of annual growth in M3 and the monetary base has increased in recent months. This includes January 2014, despite the somewhat slower pace of annual growth in the monetary base. The divergence seen in the accompanying (third) graph still is suggestive of intensifying liquidity stresses in the banking system.
Further, underlying U.S. economic reality remains perilously weak, and the Fed knows that recent data—such as the unemployment rate—have not been as strong as hyped in the popular media. With global and domestic markets continuing on the brink of turmoil, with increasing signs of banking-system stress, the Fed most likely will to continue to provide banking-system liquidity at its current pace, taking ongoing political cover for its quantitative easing from the still-weakening economy. Circumstances easily could evolve into a renewed expansion of quantitative easing, irrespective of any action or inaction taken by the Federal Open Market Committee (FOMC) tomorrow, January 29th.

Hyperinflation Outlook. With the First Installment of Hyperinflation 2014—The End Game Begins published on January 7th, a new Hyperinflation Summary for this section will be added shortly. The publication of the Second Installment, which covers historical and prospective economic activity, as well as possible protective and preventative actions and reactions at both a personal and federal level, versus the unfolding circumstance, should be published in the week following the February 7th release of the 2013 benchmark revision to payroll employment. The new material in the Second Installment will supplement and update the basic material already available to ShadowStats readers in Chapters 4, 5 and 9 of Hyperinflation 2012.
__________
REPORTING DETAIL
NEW ORDERS FOR DURABLE GOODS (December 2013)
Decline in December Orders Went Well Beyond Commercial-Aircraft Orders Volatility. The headline 4.3% decline in December 2013 durable goods orders was broadly based, extending well beyond the impact of the headline 17.5% monthly drop in irregular commercial aircraft orders. Net of the aircraft orders that so often dominate the monthly change in aggregate order activity, orders still fell by 3.0%. Included in the broad orders weakness, new orders for automobiles declined by 5.8%, orders for computers and electronic products fell by 7.8%, and orders for defense capital goods were down by 21.5%.
The aggregate reporting for December likely not only reflected some corrective pullback in orders, but also some corrective downside revisions to the reporting of prior activity. Separately, in nominal terms, before adjustment for inflation, annual growth in new orders was just 0.1%. In real terms, after adjustment for inflation, annual orders declined by 0.9%.
All factors considered, the December pullback in new orders for durable goods broadly was outside the bounds of normal monthly volatility. As a result, the ongoing longer-term pattern of stagnation remained in place for the series—particularly when viewed net of inflation—despite any short-term blips, but the recent slight uptrend in the pattern of stagnation now may have turned to a downtrend. The growth patterns in this series remain of a nature that commonly precedes or coincides with a recession or deepening business downturn.
Nominal (Not-Adjusted-for-Inflation) December 2013 Reporting. The Census Bureau reported today, January 28th, that the regularly-volatile, seasonally-adjusted nominal level of December 2013 new orders for durable goods fell by 4.30%, following a revised November gain of 2.60% (previously 3.50%), and a revised 0.69% (previously 0.72%, initially 1.98%) contraction in October. Before prior-period revisions, total new orders in December fell by 4.71%.
The reporting of contractions and surges in commercial aircraft orders is seen in an irregularly-repeating process throughout the year. These extremely volatile orders, which usually dominate the aggregate durable goods growth numbers, are booked well into the future and are indicative more of longer-term, rather than shorter-term prospects for manufacturing activity.
Nondefense (or commercial) aircraft orders fell by 17.51% in December, following a revised 21.08% (previously 21.76%) gain in November, and a revised 5.29% (previously 5.28%, initially 15.86%) monthly decline in in October. Net of prior-period revisions, December commercial-aircraft orders fell by 17.99%. Net of the aircraft numbers, total new orders fell by 2.98%, versus a revised 1.05% (previously 1.97%) gain in November, and a revised 0.28% (previously 0.32%, initially 0.75%) decline in October.
What these numbers show over the last seven months is no meaningful change (down by 1.49%)—effectively stagnation—in new orders for durable goods, net of commercial-aircraft order activity and before any consideration for the effects of inflation. The seven-month change is down by 2.08% net of the PPI capital goods inflation.
Aircraft-order volatility also has impacted year-to-year change in seasonally-adjusted, total new orders. Total orders in December 2013 were up by 0.10%, down by 1.65% ex-commercial aircraft, versus a revised November gain of 9.98% (previously 10.90%), up by a revised 6.50% (previously 7.42%) ex-commercial aircraft.
Further affected by aircraft-order activity were the seasonally-adjusted new orders for nondefense capital goods, which fell by 4.97% in the month of December, down by 0.75% ex-commercial aircraft, versus a revised 7.84% (previously 9.38%) gain in November, up by a revised 4.01% (previously 5.79%) ex-commercial aircraft.
Caution: Current durable goods reporting remains subject to many of the same sampling and concurrent-seasonal-adjustment problems that are seen with retail sales, payroll and unemployment reporting. Unusual seasonal-factor volatility raises issues as to the significance of reported seasonally-adjusted monthly and annual changes. While those issues are brought into balance, temporarily, with an annual benchmark revision to durable goods orders (usually in May), subsequent reporting makes all historical reporting prior to October 2013 inconsistent with the current headline numbers.
Real (Inflation-Adjusted) Durable Goods Orders—December 2013. Headline monthly inflation in the December PPI finished goods, capital equipment measure was a seasonally-adjusted 0.12%, month-to-month gain, versus a 0.06% monthly gain in November. On an annual basis, December 2013 inflation was reported at 1.04% versus 0.98% in November.
Adjusted for that inflation, and as reflected in the graphs of the Opening Comments section, real month-to-month aggregate orders fell by 4.42% in December, versus a revised 2.54% (previously 3.44%) gain in November. Ex-commercial aircraft, they fell for the month by 3.10% in December, and rose by a revised 0.99% (previously 1.91%) in November. Real year-to-year aggregate orders fell by 0.93% in December, versus a revised 8.91% (previously 9.83%) gain in November, and, ex-commercial aircraft, they declined by 2.66% in December, following a revised gain of 5.47% (previously 6.38%) in November.
Graphs of Inflation-Adjusted and Smoothed Durable Goods Orders. The usual two inflation-adjusted graphs are found in the Opening Comments section. Those graphs show the monthly as well as a six-month moving average activity for both the aggregate new orders series and the series net of the unstable commercial-aircraft order sector. The moving-average levels in both series have been holding in a pattern of near-stagnation, with some upside trend, now turning to the downside
In terms of inflation-adjusted activity, both of those series have shown a slowing uptrend and flattening-out in the last two-to-three years, with the real levels of the December 2013 orders remaining at or below both the pre-2001 and pre-2007 recession highs. The pattern of recent stagnation in the inflation-adjusted series also is one that commonly precedes or is coincident with a recession.
If the deflation measure here were corrected meaningfully for the hedonic-adjusted understatement of the respective PPI inflation measure, the post-2009 uptrend in real orders likely would be little more than a flat line, reflecting ongoing bottom-bouncing along a low-level plateau of economic activity, with a pattern of renewed downturn now well entrenched. Please note that the inflation series here will be revised after the publication of the revamped producer price index series, on February 19, 2014 (see Commentary No. 591).
NEW-HOME SALES (December 2013).
Some Correction to, and Back Off from, Recent Unstable Reporting. With December 2013 new-home sales falling by 7.0%, in the context of downside revisions to earlier data, reporting of housing- industry data appears to have entered a corrective phase. The headline December sales level reflected a statistically-insignificant 4.5% gain from December 2012, and should turn negative year-to-year in January 2014. December 2013 activity still was down by 70.2% from pre-recession peak activity, seen in June 2005.
Discussed in Commentary No. 586, November 2013 new-home sales reporting had been particularly unstable in the post-government shutdown period. With the December data reported and restated a little closer to reality, reporting of the next several months should continue moving in that general direction, along with eventual corrective annual revisions to the series.
No Fundamental Relief for the Housing Market. The problem for the housing market, along with much of the economy, remains tied directly to the severe, structural liquidity problems impairing consumer spending and consumption, as discussed in Commentary No. 590 and updated in the Opening Comments section. There have been no developments in underlying economic fundamentals, consumer conditions or otherwise, that suggest a pending housing-industry turnaround or an economic recovery. Underlying reality favors a renewed, broad downturn in the economy, as increasingly suggested by the housing-industry data, among others.
December New-Home Sales Reporting Reflected Both Current-Reporting Catch Up and Downside Revisions. As reported yesterday (January 27th) by the Census Bureau, December 2013 headline new-home sales (counted based on contract signings) fell by a statistically-insignificant 7.0% +/- 20.5% (all confidence intervals are at the 95% level), following a revised 3.9% (previously 2.1%) decline in November, which followed a revised 14.9% (previously 17.6%, initially 25.4%) gain in October. Due to other prior-period revisions, the November sales level actually revised lower by 4.1%. Before prior-period revisions, December sales fell by 10.8% for the month.
Year-to-year, December sales rose by a statistically-insignificant 4.5% +/- 23.2%; the series should turn negative year-to-year with January’s reporting. The December annual gain was against a revised year-to-year increase of 11.8% (previously 16.6%) in November, versus a revised annual gain of 26.8% (previously 29.9%, initially 21.6%) in October. Again, the numbers here are unstable and not reliable.
New-Home Sales Graphs. The regular monthly graph of new-home sales activity is included in the Opening Comments section, along with graphs of the latest existing-home sales and housing starts. Even with the still unusually large upswing into October sales, new-home sales activity appears to be stagnant, having declined anew to pre-bloat levels, where the unusual October sales surge likely was more a function of distorted surveying and data gathering, resulting from the government shutdown, than anything else.
__________
WEEK AHEAD
Weaker-Economic and Stronger-Inflation Reporting Likely in the Months and Year Ahead. At the moment, markets generally appear to still be overly optimistic as to the economic outlook, based on data that likely were puffed-up in the process of going through the data-gathering and reporting distortions of the October shutdown to the federal government. Expectations should soften anew, quickly, with the increasing likelihood of corrective reporting and revisions in the months ahead. The early stages of that process were seen in elements of recent reporting of the December payroll data, retail sales, new home sales and new orders for durable goods.
That corrective circumstance and underlying weak economic fundamentals remain highly suggestive of deteriorating business activity. Accordingly, weaker-than-consensus economic reporting should become the general trend.
Stronger inflation reporting remains likely. Upside pressure on oil-related prices should reflect intensifying impact from a weakening U.S. dollar in the currency markets, and from ongoing political instabilities in the Middle East. The dollar faces pummeling from continuing QE3, the ongoing U.S. fiscal-crisis debacle, a weakening U.S. economy and deteriorating U.S. political conditions (see Hyperinflation 2014—The End Game Begins). Particularly in tandem with a weakened dollar, reporting in the year ahead generally should reflect much higher-than-expected inflation.
A Note on Reporting Quality Issues and Systemic Reporting Biases. Significant reporting-quality problems remain with most major economic series. Headline reporting issues are tied largely to systemic distortions of seasonal adjustments. The data instabilities were induced by the still-ongoing economic turmoil of the last seven-to-eight years, which has been without precedent in the post-World War II era of modern economic reporting. These impaired reporting methodologies provide particularly unstable headline economic results, where concurrent seasonal adjustments are used (as with retail sales, durable goods orders, employment and unemployment data), and they have thrown into question the statistical-significance of the headline month-to-month reporting for many popular economic series.
PENDING RELEASES:
Gross Domestic Product—GDP (Fourth-Quarter 2014, “Advance” or First-Estimate). The Bureau of Economic Analysis (BEA) has scheduled release of the “advance” estimate of fourth-quarter 2013 GDP for Thursday, January 30th. Market expectations appear to be for some slowing in the fourth-quarter versus the last headline estimate of 4.1% annualized, quarter-to-quarter, real (inflation-adjusted) growth in third-quarter 2013. These numbers are particularly unstable, given the impact of the government-shutdown on data gathering and reporting. Not only was the reporting of third-quarter growth bloated by the shutdown issues, the potential exists for some carry-through into the fourth-quarter report.
Net of an unusually-large inventory gain in the third-quarter, and subsequent upside revisions to same, the 4.1% third-quarter growth was about 2.5%. While problematic data suggest that fourth-quarter growth would exceed that 2.5%, inventory swings and catch-up reporting could take the growth rate either way. Rather than making corrective adjustments in the fourth-quarter GDP, for third- and fourth-quarter reporting issues, the BEA most likely will hold off in adjusting for those problems until the annual GDP revisions in July. Under those circumstances, with the BEA targeting its advance estimate, as usual, against the consensus outlook, which appears to be to the plus-side of 3%, the consensus is as good a bet as anything for the initial reporting. Underlying economic reality suggests much-weaker growth, if not an outright quarterly contraction.
Keep in mind, again, that there could be unusually wild reporting with this number. As the dust settles on the shutdown-related, reporting-quality issues for third- and fourth-quarter 2013 GDP, look for an outright quarterly contraction in first-quarter 2014 GDP, with downside revisions in July 2014 for the reporting of the earlier quarters.
__________