No. 783: Fourth-Quarter GDP, Consumer and Monetary Conditions
COMMENTARY NUMBER 783
Fourth-Quarter GDP, Consumer and Monetary Conditions
January 29, 2016
___________
Annualized Real GDP Growth Slowed to 0.69% in Headline Reporting,
Poised for Headline Contraction in February 26th First Revision
Difference Between the Headline Fourth-Quarter GDP Growth and an
Outright Quarterly Contraction Was Not Statistically Significant
Worst Real Trade Deficit in Eight Years
Velocity of Money Slowed; January M3 Annual Growth Slowed Markedly;
Monetary Base Has Stabilized
___________
PLEASE NOTE: The next regular Commentary, scheduled for Friday, February 5th, will cover January 2016 labor conditions and the annual payroll benchmark revision, plus the December trade deficit and construction spending. Dependent on the complexities of the payroll benchmarking, elements of the revision and related payroll detail may be rolled over into a follow-up Commentary.
Best wishes to all — John Williams
OPENING COMMENTS AND EXECUTIVE SUMMARY
Closing in on a Headline GDP Contraction. The “advance” estimate of 0.69% annualized growth in real fourth-quarter 2015 Gross Domestic Product (GDP) was no more than statistical noise. Simply put, there was no statistically-significant difference between the “advance” headline quarterly gain and an outright quarterly contraction. An outright contraction likely looms in the first revision.
Given the accelerating downside trend in most near-term, headline economic reporting, including the durable goods orders detailed in yesterday’s No. 782, the consensus outlook for broad economic activity should be shifting rapidly to the downside. Negative expectations for the first revision to fourth-quarter GDP on February 26th, and the actual reporting of same should follow.
Discussed frequently, the GDP does not reflect properly or accurately the changes to the underlying fundamentals that drive the economy. Underlying real-world economic activity has shown that the broad economy began to turn down in 2006 and 2007, plunged into 2009, entered a protracted period of stagnation thereafter—never recovering—and then began to turn down anew in recent quarters.
The GDP simply remains the most worthless of the popular government economic series, in terms of determining what really is happening to U.S. business activity. The series is the most heavily-modeled, politically-massaged and gimmicked government indicator of the economy. It has been so since at least the 1960s, when President Lyndon Johnson reportedly reviewed the numbers before their release, and then would return them to the Commerce Department, if Commerce had gotten them “wrong,” and would keep doing so until Commerce got the numbers “right.”
Nonetheless, despite all the upside biases and gimmicks built into the GDP reporting, the real world occasionally surfaces in formal GDP estimates, and that is close, but still in the process of unfolding. With major monthly economic series such as retail sales, industrial production, durable goods orders and housing-market measures showing regular indications of recession, underlying reality has become weak enough, once again, for headline GDP, GNP and/or GDI to show an ongoing, formal “new” recession. That initial recognition likely looms within the now-unfolding reporting timeframe of the first-quarter 2016 GDP and its revisions.
Today’s Commentary (January 29th). The balance of these Opening Comments provides summary coverage of the “advance” estimate of fourth-quarter 2015 GDP, and an update to consumer liquidity conditions.
The Hyperinflation Watch includes the reformatted Hyperinflation Outlook Summary (unrevised from yesterday’s reporting), along with an update on Monetary Conditions.
The Week Ahead previews January 2016 employment and unemployment reporting, the payroll-survey benchmark revision and the December trade deficit and construction spending.
Gross Domestic Product (GDP)—Fourth-Quarter 2015 GDP, “Advance” or First Estimate—No Statistically-Significant Difference Between the Headline Growth and a Contraction. Headline fourth-quarter 2015 GDP growth slowed sharply, to somewhat below consensus, and well within striking range of a headline quarterly contraction come the first revision. Of significance was renewed deterioration in the trade deficit, where the real or inflation-adjusted net-export account hit its worst reading in eight years. In conjunction with weakening new orders and slowing inventory growth, that already has started to move consensus expectations towards a contracting economy. In turn, the shifting economic outlook should move the Bureau of Economic Analysis (BEA) into a viable position for publishing a contraction its first revision to the fourth-quarter GDP.
The first estimate of fourth-quarter 2015 GDP showed a statistically-insignificant, real (inflation-adjusted), annualized, quarterly headline gain of 0.69%. That was down from headline growth of 1.98% in third-quarter 2015 and 3.92% in second-quarter 2015 GDP, but it was minimally higher than the benchmarked gain of 0.64% [a pre-benchmarking contraction of 0.17% (-0.17%)] in first-quarter 2015.
Headline year-to-year real growth in fourth-quarter 2015 slowed markedly to 1.80%, the slowest annual growth in seven quarters, when the quarterly GDP contracted in first-quarter 2014. The annual growth was down from 2.15% in third-quarter 2015, from 2.72% in second-quarter 2015 and from 2.88% in first-quarter 2015. In terms of annual-average real growth, 2015 GDP gained 2.38% versus 2014, where 2014 had gained 2.43% versus 2013. The latest headline levels of, and year-to-year changes in the GDP are reflected in the various graphs of the Reporting Detail section.
Fourth-Quarter 2015 GDP Growth Distribution. Despite the severely-limited significance of the following detail, it is included for those interested in the reported internal patterns of GDP growth, as indicated by the Bureau of Economic Analysis (BEA). The first estimate of annualized quarterly fourth-quarter 2015 real GDP growth was 0.69%, versus annualized quarterly real gains of 1.98% in third-quarter 2015, 3.92% in second-quarter 2015 and 0.64% in first-quarter 2015.
The BEA’s first guess at real fourth-quarter GDP growth is detailed in the following aggregation of contributed growth. The annualized growth number in each sub-category is the additive contribution to the total, headline change in GDP, where 1.46% - 0.41% - 0.47% + 0.12% = 0.69%, with a rounding difference. Commentary No. 775 of December 22nd detailed the growth-distribution estimate for the third estimate of third-quarter GDP.
Contributing Factors. Headline growth came largely from personal consumption, which added roughly 1.5% to the headline GDP growth rate. One third of that consumption strength came from the non-productive and otherwise heavily-gimmicked healthcare sector. Also on the plus-side was seasonally-adjusted defense spending. Contrary to private-reporting indications, personal residential construction more than offset losses in non-residential construction, while a widening trade deficit—the worst deficit in eight years—and a weakening pace of inventory building each knocked roughly 0.5% (-0.5%) off the headline GDP-growth number.
· Consumer Spending Contributed 1.46% to Fourth-Quarter GDP Growth; Third-Quarter Growth Contribution was 2.04%. The contribution from personal consumption was split about evenly between goods, non-healthcare services and healthcare, with healthcare contributing 0.43% to the 0.69% headline GDP growth rate.
· Business/Residential Investment Subtracted 0.41% (-0.41%) from Fourth-Quarter GDP Growth; Subtracted 0.11% (-0.11%) from Third-Quarter GDP Growth. Dominant here was a slower pace of inventory building, which reduced headline GDP growth by 0.45% (-0.45%). Accordingly, final sales (GDP net of inventories) increased by 1.14% in fourth-quarter 2015, down from 2.69% in third-quarter 2015. Otherwise, residential (real estate) investment and nonresidential (structures, equipment and intellectual property) investment offset each other.
· Net Exports Subtracted 0.47% (-0.47%) from Fourth-Quarter GDP Growth; Subtracted 0.26% (-0.26%) from Third-Quarter Growth. Widening to the worst trade shortfall since first-quarter 2008, fourth-quarter 2015 net exports reduced the headline GDP growth rate by 0.47% (-0.47%).
· Government Spending Contributed 0.12% to Fourth-Quarter GDP Growth; Contributed 0.32% to Third-Quarter Growth. Dominated by seasonally-adjusted defense spending, federal government spending added 0.18% to the headline GDP growth, where there was a minimally-offsetting, negative GDP growth contribution of 0.6% (-0.6%) by state and local governments. The third-quarter GDP contribution came entirely from state and local government spending.
Implicit Price Deflator (IPD). As general guidance, the weaker the inflation rate used in deflating an economic series, the stronger will be the resulting inflation-adjusted growth. The first estimate of fourth-quarter 2015 GDP inflation, or the implicit price deflator (IPD), was an annualized quarterly increase of 0.82%, versus 1.30% in third-quarter 2015, versus 2.13% in second-quarter 2015 and a benchmarked gain of 0.12% in the first-quarter 2015. Year-to-year, fourth-quarter 2015 IPD was 1.08%, versus 0.90% in third-quarter 2015, versus 0.98% in second-quarter 2015 and a benchmarked 1.01% annual gain in first-quarter 2015. In terms of annual average inflation, initial estimate of the 2015 IPD was 1.10%, versus 1.09% in 2014. For CPI-U comparisons, see the Reporting Detail.
Gross National Product (GNP) and Gross Domestic Income (GDI). The initial estimates of fourth-quarter 2015 GNP and GDI will not be published until March 25th, given data-quality issues, a problem common with headline GDP (see Reporting Detail for further information on these series).
Underlying Economic Reality. The U.S. economy continues in an as-yet-unrecognized “new” recession, although headline activity is moving at an accelerating pace towards such recognition. The headline “advance” fourth-quarter 2015 GDP growth of 0.69% likely will revise into a headline quarterly contraction on February 26th, as consensus estimates of the revision begin to fall below zero.
The initial fourth-quarter GDP estimate followed headline growth of 1.98% in third-quarter 2015, 3.92% in second-quarter 2015 and 0.64% in first-quarter 2015. First-quarter 2015 GDP had turned negative in its first revision, only to be pushed back into positive territory with the 2015 GDP benchmarking in July 2015. The pending GDP benchmarking of July 29, 2016 should not be so kind, and that date serves as an outside event for triggering recognition of a “new” recession that likely will be timed from December 2014. Recognition of the “new” recession should follow shortly upon revised fourth-quarter 2015 GDP turning negative, quarter-to-quarter.
Formal headline activity continues to run well above economic reality as signaled by a number of business indicators, such as corporate revenues, domestic freight activity and a variety of better-quality economic series, such as industrial production, new orders for durable goods and real retail sales. Even housing starts and construction spending are signaling a fourth-quarter contraction. These circumstances have been detailed recently in No. 777 Year-End Special Commentary, No. 780, No. 781 and No. 782.
Accordingly, the broad ShadowStats economic outlook has not changed, and the gist of most of the following text remains along the lines of other recent GDP Commentaries. The details and numbers, however, have been updated to reflect today’s reporting.
Discussed in Commentary No. 739, which covered the 2015 GDP annual revisions, annual benchmarkings increasingly are reshaping the GDP-reporting history into a post-2007 collapse pattern of successive multiple dips. By the likely next comprehensive GDP benchmark revision in July 2018, post-2007 historical GDP reporting should be confirming a non-recovering, multiple-dip economic collapse.
That circumstance should encompass the evolving, current downturn in broad, domestic economic activity, discussed previously in No. 777 and No. 742 Special Commentary: A World Increasingly Out of Balance. Where again, the present “new” recession or multiple-dip downturn remains likely to be timed from December 2014, without headline back-to-back contractions of quarterly GDP currently in place, formal recognition of same remains pending. Recognition of the onset of the December 2007 recession was not formalized until November 28, 2008. Ongoing monthly economic-reporting detail for key series, however, increasingly should confirm the patterns of declining economic activity, which should engender a formal recession call, irrespective of the timing of actual, headline quarterly contractions in real GDP.
Frequently discussed here, the headline GDP does not reflect properly or accurately the changes to the underlying fundamentals that drive the economy, at present. Again, fundamental, real-world economic activity shows that the broad economy began to turn down in 2006 and 2007, plunged into 2009, entered a protracted period of stagnation thereafter—never recovering—and then began to turn down anew in recent quarters. Irrespective of the reporting gimmicks introduced in the July 2013 and July 2014 GDP benchmark revisions—including a recent pattern of inclusion and estimation of highly-questionable data on the Affordable Care Act (ACA)—a consistent, fundamental pattern of faltering historical activity is shown in the accompanying “corrected” GDP graphs.
Please note that the pattern of activity shown for the “corrected” GDP series is much closer to the patterns shown in the graphs of unemployment (see Commentary No. 779), monthly real median household income and other consumer measures (see No. 777 and the following Consumer Conditions section). This also has been detailed in No. 742 Special Commentary: A World Increasingly Out of Balance and No. 692 Special Commentary: 2015 - A World Out of Balance. Similar patterns are found in economic series not otherwise reliant on understated inflation for their reported growth, such as housing starts (see Commentary No.781 and 2014 Hyperinflation Report—Great Economic Tumble – Second Installment).
With liquidity-strapped consumers unable to fuel sustainable growth in consumption, a full business recovery could not have taken place since 2009, and a recovery will not be forthcoming until consumer structural income and liquidity problems are resolved, including more-normal credit functioning of the domestic banking system.
Official and Corrected GDP. Usually discussed in these Commentaries covering the quarterly GDP reporting and monthly updates, the full economic recovery indicated by the official, real GDP numbers remains an illusion. It is a statistical illusion created at least partially by using too-low a rate of inflation in deflating (removing inflation effects) from the GDP series. The accompanying two sets of graphs tell that story, updated for today’s first estimate of fourth-quarter 2015 GDP.
The first set of graphs (2000-to-date) is the one that traditionally has been incorporated in the GDP Commentaries. Graphs 1 and 2 show short-term detail, expressed on an index base where first-quarter 2000 = 100.0. The second set of graphs (Graphs 3 and 4) updates the longer-term detail (1970-to-date), expressed in billions of 2009 dollars as used in the headline GDP reporting. The graphs also show official periods of recession as shaded areas, with ShadowStats-defined recessions indicated by the lighter shading in Graph 4, the second graph of the second set, as detailed and published initially in 2014 Hyperinflation Report—Great Economic Tumble – Second Installment.
Shown in the first graph of each set (Graphs 1 and 3) of official Headline Real GDP, GDP activity has been reported above pre-2007 recession levels—in full recovery—since second-quarter 2011, and headline GDP has shown sustained growth since (growth pauses or interruptions for second-half 2012 and first-quarter 2014 excepted). Adjusted for official GDP inflation (the implicit price deflator - IPD), the headline fourth-quarter 2015 GDP currently stands at 9.7% above its pre-recession peak-GDP estimate of fourth-quarter 2007. In contrast, the “corrected” GDP version, in the second graph of each set (Graphs 2 and 4), shows fourth-quarter 2015 GDP activity down by 7.3% (-7.3%), from its pre-recession peak of first-quarter 2006.
Further, discussed broadly in the second installment of the Hyperinflation Report, no other major economic series has shown a pattern of official full economic recovery and meaningful expansion thereafter, consistent with the headline GDP reporting. Such is covered in the recent discussions on industrial production, real retail sales and real durable goods orders (again, see respectively No. 780, No. 781 and No. 782. Either the GDP reporting is wrong, or all other major economic series are wrong. While the GDP is heavily modeled, imputed, theorized and gimmicked, it also encompasses reporting from those various major economic series and private surveys, which still attempt to measure real-world activity. Flaws in the GDP inflation methodologies and simplifying reporting assumptions have created the “recovery.”
Again, the second graph in each series (Graphs 2 and 4) plots the Corrected Real GDP, corrected for the understatement inherent in official inflation estimates (see Public Commentary on Inflation Measurement), with the deflation by the implicit price deflator (IPD) adjusted for understatement of roughly two-percentage points of annual inflation in recent years. The inflation understatement has resulted from hedonic-quality adjustments, also as discussed in the Hyperinflation Reports.
[See Graphs 1 to 4 starting on the next page.]
Graph 1: Real GDP Index – Headline Real GDP (2000-2015)

Graph 2: “Corrected” Real GDP Index (2000-2015)

Graph 3: Real GDP Index (1970-2015)

Graph 4: “Corrected” Real GDP (1970-2015)
Consumer Liquidity Conditions – Update. Supplemental to the full review of consumer liquidity conditions in No. 777 Year-End Special Commentary and updated material in No.780, consumer conditions are updated here for full-January 2016 readings for the Conference Board’s Consumer-Confidence measure (January 26th) and for University of Michigan’s Consumer-Sentiment measure (today, January 29th), as shown in Graphs 5 to 7.
For purposes of showing the Consumer Confidence and Consumer Sentiment measures on a comparable basis, the graphs reflect both measures re-indexed to January 2000 = 100 for the monthly reading. Standardly reported, the Conference Board’s Consumer Confidence Index is set with 1985 = 100, while the University of Michigan’s Consumer Sentiment Index is set with January 1966 = 100.
Graph 5: Consumer Confidence to January 2016

Graph 6: Consumer Sentiment to January 2016

Graph 7: Comparative Consumer Confidence and Sentiment (6-Month Moving Averages) since 1970
The Conference Board’s seasonally-adjusted [unadjusted data are not available] Consumer-Confidence Index (Graph 5) notched higher in January, while the University of Michigan’s not-seasonally-adjusted Consumer-Sentiment Index (Graph 6) notched lower, following monthly increases for both series in December 2015.
Both measures remain below near-term peaks. The Confidence and Sentiment series tend to mimic the tone of headline economic reporting in the press (see discussion in Commentary No. 764), and often are highly volatile month-to-month, as a result. With increasingly-negative, headline financial and economic reporting and circumstances at hand and ahead, successive negative hits to both the confidence and sentiment readings remain highly likely in the months ahead.
Smoothed for irregular, short-term volatility, the two series remain at levels seen typically in recessions. Suggested in Graph 7—plotted for the last 45 years—the latest readings of Confidence and Sentiment generally have not recovered levels preceding most formal recessions of the last four decades. Broadly, the consumer measures remain well below, or are inconsistent with, periods of historically-strong economic growth seen in 2014 and as indicated in for second-and third-quarter 2015 GDP growth.
[The Reporting Detail section includes additional GDP information and graphs.]
__________
HYPERINFLATION WATCH
MONETARY CONDITIONS—VELOCITY OF MONEY
The Velocity of Money Slowed Minimally in Third-Quarter 2015. Incorporating the headline detail of nominal fourth-quarter 2015 GDP, as well as detail from the Federal Reserve annual benchmark revisions to money-supply-related data through fourth-quarter 2015 (published last night, January 28th), Graphs 8 and 9 show estimates of the velocity of money, broken out for money supply M1, M2 and M3 (the ShadowStats Ongoing-M3 Measure).
Generally notching lower into third- and fourth-quarter 2015 for each money-supply measure, velocity last had moved slightly higher in second-quarter activity. Where nominal GDP is in the numerator and the nominal money measure is in the denominator of the velocity ratio, slowing velocity here indicates a relatively faster decline in nominal economic growth than in money growth. While nominal headline annual GDP growth slowed in fourth-quarter 2015 to 2.90%, from 3.07% in the third quarter, annual growth in the money measures slowed more sharply. Headline annual nominal M3 growth slowed in the fourth quarter to 4.88%, from 5.60% in the third quarter, as discussed further in the next section.
Velocity had plunged into first-quarter 2015 for M1 and M2. Since the end of 2010, however, the broader measure of M3 velocity had been steady through third-quarter 2014, when it also turned lower. While all velocity measures turned minimally higher in second-quarter 2015, the pattern reversed with the third- and fourth-quarter estimates.
As to M1, consider that perhaps 70% or more of the cash-in-circulation component of that measure (with cash accounting for about 43% of M1) could be physically outside the United States, per the Federal Reserve. Where that has been an increasing trend, a true measure of domestic M1 velocity well could be showing a significant uptrend. In like manner, where M1 includes cash, M2 includes M1, and M3 includes M2, M2 and M3 velocities also would be somewhat higher (cash is roughly 11% of M2, 8% of M3).
M3 versus M1 and M2 had been showing opposite patterns since 2011, because growth in M3 had been weaker than growth in M1 and M2. The reason behind that difference was that much of the relatively stronger M1 and M2 growth reflected cash moving out of M3 categories—such as large time deposits and institutional money funds—into M2 or M1 accounts. The clarity of what happened there is why ShadowStats still tracks what had been the broadest money measure (M3) available.
Subscribers often ask for specifics on the velocity of the money supply, with the result that this section has become a standard feature for Commentaries covering the “advance” GDP reporting of a given quarter. The nature of velocity is discussed in some detail in the 2008 Money Supply Special Report. Velocity simply is the number of times the money supply turns over in the economy in a given year, or the ratio in nominal terms (not adjusted for inflation) of GDP to the money supply. It is a residual number, not otherwise open to calculation or independent surveying.
Graph 8: Velocity of Money Supply M1
Graph 9: Velocities of Money Supply M2 and M3

Velocity has theoretical significance. In combination with money-supply growth, it should be a driving force behind inflation. Yet, since velocity is a ratio of two not-particularly-well or realistically-measured numbers, its actual estimate is of limited value. As an inflation predictor, it has to be viewed in the context of accompanying money-supply growth, and vice versa, generally as a coincident indicator. Again, full definitions can be found in the Money Supply Special Report.
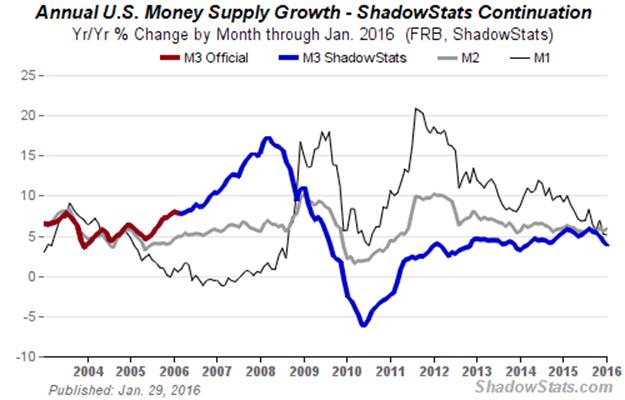
Annual M3 Growth Continued to Drop Sharply in January to 3.8%, from a Downwardly-Revised 4.3% in December. An early estimate of January 2016 annual growth in broad money supply—the ShadowStats Ongoing M3-Measure—is published here, a week in advance of its normal release with the headline employment data, for two reasons.
First is the annual benchmark revision to the underlying data, as published by the Federal Reserve Board (FRB) yesterday, January 28th. The revisions lowered recent annual growth estimates of M1, M2 and the ShadowStats M3 (the latest numbers are available on the Alternate Data tab of www.ShadowStats.com). For example, where annual growth in M3 had slipped to 4.5% in December 2015, down from 5.2% in November and a near-term peak growth of 6.0% in August 2015, those respective annual growth rates revised lower to 4.3%, 5.0% and 5.9%.
The second reason is that annual growth in M3 continued to slow rapidly in January 2016. In the context of the benchmark revisions, annual growth is on track to drop to 3.8% in January 2016, from 5.0% in December, as reflected in Graph 10.
Graph 10: Comparative Money Supply M1, M2 and M3 Year-to-Year Changes through Preliminary January 2016
This detail will be updated in the next Commentary No. 784, when it usually would have been published in the context of more-complete underlying detail, including the usual annual and monthly changes for the headline measures of M1, M2 and M3 (ShadowStats).
Graph 11: Monetary Base Level, Bi-Weekly through January 20, 2016

Graph 12: Monetary Base, Year-to-Year Percent Change, through January 20, 2016

Monetary Base Returns to Pre-FOMC Rate Hike Levels. Noted in Commentary No. 779 and No.779-A, the St. Louis Fed’s monetary base declined to a seasonally-adjusted, 28-month low in the two-week period ended January 6, 2016. Plunging year-to-year by 7.4% (-7.4%), such was the steepest annual decline in the 30-year history of the series. Much of the activity there was due to the New York Fed’s Open-market operations, post-FOMC rate hike, aimed at setting in place the new target range of 0.25% to 0.50% for the federal funds rate.
Graphs 11 and 12 show the subsequent reporting of the St. Louis Fed’s Monetary Base for the two-week period ended January 20th. While the period-to-period plunge in the monetary base more than reversed in the latest two-week period, annual change remained down year-to-year by 5.3% (-5.3%), the second-worst year-to-year decline in the series, following the prior-period’s historic annual drop of 7.4% (-7.4%). These data also will be updated in the next Commentary No. 784.
HYPERINFLATION OUTLOOK SUMMARY
Massive Sell-Off Remains Likely Soon for Extremely Overvalued U.S. Dollar. Other than for references to headline detail from this morning’s fourth-quarter GDP report, or for the regular updating of internal links, this Hyperinflation Summary Outlook is unrevised from the prior version published in yesterday’s No. 782. Going forward as of the February 2016 Commentaries, this Summary and regular updates to same will be incorporated as a link within the weekly Commentaries. Such will save roughly six pages of often-repetitive material in subsequent physical missives, while preserving immediate access to the desired detail
Background Documents to this Summary. Underlying the Hyperinflation Outlook as general background are No. 777 Year-End Special Commentary of December 30, 2015, No. 742 Special Commentary: A World Increasingly Out of Balance of August 10, 2015, and No. 692 Special Commentary: 2015 - A World Out of Balance of February 2, 2015, which updated the Hyperinflation 2014 reports and the broad economic outlook. Previously, the long-standing hyperinflation and economic outlooks were updated with the publication of 2014 Hyperinflation Report—The End Game Begins – First Installment Revised, on April 2, 2014, and publication of 2014 Hyperinflation Report—Great Economic Tumble – Second Installment, on April 8, 2014. The two 2014 Hyperinflation Report installments, however, remain the primary background material for the hyperinflation and economic analyses and forecasts. In terms of underlying economic reality, one other reference is the Public Commentary on Inflation Measurement. The regular weekly Commentaries also update elements of the general outlook, as circumstances develop. An all-encompassing background document is planned for first-half 2016.
Federal Reserve and Other Central Banks Have No Way Out—Eventual Problem Remains Hyperinflation, Not Hyper-Deflation. Having taken little but stopgap measures to prevent systemic collapse in the Panic of 2008, the Federal Reserve and the U.S. Treasury still face problems of systemic insolvency or instability in the near future. Some forecasters look for the current situation to evolve into a deflationary collapse of debt. While likely meaningful insolvencies in the global financial system loom, the process becomes hyper-deflationary only in the circumstance where the banking system collapses and money supply disappears, as happened in the 1930s. With the precedent of the Panic of 2008 in hand, much more likely is a systemic bailout, very possibly in the extreme, with hyperinflationary consequences. Those controlling the system have already made clear their desire in answer to the question raised by Robert Frost in his poem Fire and Ice; their choice appears solidly to be for the world to end in fire (2014 - The End Game Begins page 26).
“New” Recession Should Hit the U.S. Dollar Hard. In announcing the federal funds rate hike of December 17, 2015, the Federal Reserve’s Federal Open Market Committee (FOMC) declared that its monetary policy was based on economic concerns, despite numerous and obvious prior actions to the contrary. Discussed frequently in ShadowStats Commentaries (see for example Commentary No. 779), the FOMC generally has used a “weak” economy as political cover when introducing the various stages of quantitative easing, which generally were used to help bailout the banking system, not to stimulate general economic activity.
Discussed in recent reporting (see Opening Comments), U.S. economic activity has been turning down meaningfully, and news on the economy should become increasingly bleak in the weeks and months ahead. Presumably, that should remove some pressure from the FOMC for a round of aggressive rate hikes. Speculation even could mount for a rate cut. If the Fed needs to provide liquidity to the banking system or to the U.S. Treasury, as it did with QE3, the political cover of a weak economy will around for some time to come. With Fed monetary policy in abeyance, at the moment, shifting market expectations towards a “new” recession should trigger meaningful selling pressure against the U.S. dollar. The term “new” is used in that ShadowStats contends that the intensifying downturn is no more than a continuation of the economic collapse that began in early 2006.
Updated Hyperinflation and U.S. Dollar Outlook. Rapidly slowing economic activity and an increasingly-likely quarterly contraction for fourth-quarter GDP, in its first revision, have significant negative implications, ranging from mounting selling pressure on the U.S. dollar, to unexpected and additional widening of the federal budget deficit and U.S. Treasury funding needs, to increased political volatility in what already is shaping up as an extraordinarily-significant presidential election year.
When Main Street U.S.A. suffers enough financial and other pain, the common reaction, historically, has been to dump those running the system. That pain threshold was crossed in 2008, and the year ahead assuredly will not be a happy one for many incumbents or for those who are counting on politics as usual.
That said, a heavily politics-as-usual budget deal has been put in place until after the election. With promised higher deficit spending. With no debt limit to contain continuing excesses until after the election, who is going to fund the expanded spending ahead? Who is going to buy the proffered U.S. Treasury securities? Recent big buyers such as China, Japan and the Federal Reserve either are selling for a variety of reasons or otherwise are sitting on their hands. The most likely answer is that the Fed will end up as the continuing to buyer of last resort (i.e. QE4).
The U.S. Dollar continues to live on borrowed time, and the unfolding confluence of the factors raised here remains likely to push the dollar into a heavy sell-off. The FOMC has raised rates, but also has continued publicly to tie its policy to U.S. economic health. That leaves the weak economy as political cover should the Fed need such cover, again, which is likely. Yet, that also should help to intensify the negative-impact selling pressure on the dollar, from news of an intensifying downturn in an already-contracting economy.
The traumatic rate-raising process for FOMC up through the mid-December 2015 rate action likely masked serious other problems in the domestic and global financial systems. One likely major concern has to have been for continued stability and liquidity of the market for U.S. Treasury securities. Beyond domestic and global banks, the biggest beneficiary of QE3 was the U.S. Treasury.
Nothing has changed here, including the ShadowStats broad outlook for ongoing economic stagnation and downturn, intensifying systemic instabilities and a looming massive decline in the U.S. dollar. Along with the pending dollar crisis are the ongoing implications ultimately for severe inflation, for a domestic hyperinflation. Already in the early months of 2016, forces are gathering to trigger heavy dollar selling. A massive U.S. dollar sell-off remains the likely proximal trigger for the early stages of the inflation, and that dollar selling could be as near as the next, severely-negative economic surprise.
Primary Summary. The U.S. dollar continues to face a massive decline in the wake of the extraordinary and generally still-ongoing rally seen since June 2014, in the context of an intensifying, renewed downturn in the U.S. economy, ongoing domestic fiscal imbalances and financial- and political-system instabilities. Financial-system concerns, including possible Treasury-funding issues, likely will be factors behind slowness of the Federal Reserve’s Federal Open Market Committee (FOMC) in putting forth significant, further interest rate hikes. Those factors have implications for a meaningful upturn in domestic inflation, eventually evolving into a great hyperinflationary crisis.
Fed policy, if anything, has exacerbated the long-term economic stagnation and renewed business downturn, where the quantitative easings always were intended as covert bailouts for the banking system, not as stimuli for the economy. Instead, the weak economy regularly was used as political cover for the effective banking-system bailouts.
Current fiscal conditions show the effective long-term insolvency of the U.S. government, a circumstance that usually would be met by eventual, unfettered monetization of the national debt and obligations, leading to a hyperinflation. As first estimated by ShadowStats in 2004, such hyperinflation appeared likely by 2020. That time horizon for the hyperinflation forecast was moved to 2014, because of the 2008 Panic, the near-collapse of the financial system, and official (U.S. government and Federal Reserve) responses to same. That hyperinflation forecast remains in place, but it has been adjusted into 2016 and the year ahead, as discussed in No. 742 and No. 777.
The basic story of how and why this fiscal, financial and economic crisis has unfolded and developed over the years—particularly in the last decade—is found in the Opening Comments and Overview and Executive Summary of the 2014 Hyperinflation Report—The End Game Begins.
Dollar Circumstance. The U.S. dollar rallied sharply from mid-2014 to date, despite some fluttering up to year-end, and now into early 2016. The rally, initially, likely reflected covert financial sanctions and oil-price manipulations by the United States, aimed at creating financial stresses for Russia, in the context of the Ukraine situation. Relative U.S. economic strength, and the relative virtuousness of Fed monetary policy versus major U.S. trading partners, were heavily picked-up on and over-estimated by global markets looking to support the dollar.
The U.S. economy remains in contraction, with a variety of key indicators, such as industrial production, real retail sales, domestic freight activity and revenues of the S&P 500 companies continuing to show a recession. Although formal recognition could take several months, consensus recognition of a “new” recession should gain rapidly, in tandem with a variety of monthly, quarterly and annual data reflecting the downturn in business activity. When formal recognition comes, timing of the onset of the recession likely still will be from December 2014 (see Opening Comments).
As market expectations move increasingly towards an imminent, new recession, such not only should reduce expectations for significant tightening in Fed policy, but also should renew expectations for a more-accommodative or newly-accommodative Fed. While such could help to fuel further stock-market mania, any resulting rallies in equity prices should be more than offset in real terms, by percentage declines in the exchange-rate value of the U.S. dollar or in the eventual increases in headline consumer inflation.
Faltering expectations should place mounting and eventually massive selling pressure on the U.S. dollar, as well as potentially resurrect elements of the Panic of 2008. Physical gold and silver, and holding assets outside the U.S. dollar, remain the ultimate primary hedges against an eventual total loss of U.S. dollar purchasing power. These circumstances should unwind what has been the sharp and generally ongoing rally in the U.S. dollar’s exchange rate since mid-2014, and the broadly-related selling pressures seen in the gold and silver markets. Further, oil prices should spike anew, along with a sharp reversal in the dollar’s strength, irrespective of current supply disruptions.
Unexpected economic weakness intensifies stresses on an already-impaired banking system, increasing the perceived need for expanded, not reduced, quantitative easing. The highly touted “tapering” by the FOMC ran its course, and now an initial rate hike is in place. Future Fed behavior—moving towards normal monetary conditions in what had been an unfolding, purportedly near-perfect economic environment—was pre-conditioned by a continued flow of “happy” economic news. Fed tightening likely is close to being on hold until after the 2016 presidential election, irrespective of near-term economic pressures. Suggestions that all was right again with world were nonsense. The Fed’s games likely now will be played out as far as possible, with hopes, once again, of avoiding a financial-system collapse.
A renewed economic downturn also savages prospective federal budget deficit prognostications (particularly the 10-year versions). Such throws off estimates of U.S. Treasury funding needs. Current fiscal “good news” remains from cash-based, not GAAP-based accounting projections and is heavily impacted by changes in business activity.
The economy has not recovered; the banking system is far from stable and solvent; and the Federal Reserve and the federal government still have no way out. Significant banking-system and other systemic (i.e. U.S. Treasury) liquidity needs will be provided for, as needed, by the Fed, under the ongoing political cover of a weakening economy—a renewed, deepening contraction in business activity. The Fed has no choice. Systemic collapse is not an option for the Board of Governors. This circumstance simply does not have a happy solution.
Accordingly, any significant, renewed market speculation in the near future as to an added round of Federal Reserve quantitative easing, QE4, could become a major factor behind crashing the dollar and boosting the price of gold. The Fed has strung out its options for propping up the system as much as it thought it could, with continual, negative impact on the U.S. economy. Again, the easings to date, however, appear to have been largely a prop to the banking system and to the increasingly unstable equity markets. While higher domestic interest rates tend to act as a dollar prop, the hike in rates also may trigger a round of other systemic problems. Again, there is no happy way out of this for the Fed.
The fundamental problems threatening the U.S. dollar could not be worse. The broad outlook has not changed; it is just a matter of market perceptions shifting anew, increasingly against the U.S. currency. That process likely will become dominated by deteriorating global perceptions of stability in U.S. economic activity, its political system, and the ability of the Federal Reserve to control its monetary policy. Key issues include, but are not limited to:
· A severely damaged U.S. economy, which never recovered post-2008, is turning down anew, with no potential for recovery in the near-term. Fourth-quarter 2015 GDP should be reported in outright, inflation-adjusted contraction as of February 26th. Formal recession recognition should follow shortly thereafter, timed from December 2014. Ongoing severe, structural-liquidity constraints on the consumer, are preventing a normal economic rebound in the traditional, personal-consumption-driven U.S. economy (see the Opening Comments and No. 777 Year-End Special Commentary).
· U.S. government unwillingness to address its long-term solvency issues. Those controlling the U.S. government have demonstrated not only a lack of willingness to address long-term U.S. solvency issues, but also the current political impossibility of doing so. Serious consideration of the government addressing the fiscal imbalances has been shifted to post-2016 election timing. Any current fiscal “good news” comes from cash-based, not GAAP-based accounting projections, where the GAAP shortfall is not slated to be addressed by the current government. The GAAP-based version continues to run around $4 to $5 trillion for the annual shortfall, with total net obligations of the U.S. government exceeding $100 trillion, including the net present value of unfunded liabilities. Still, many in Washington look to continue increasing spending and to take on new, unfunded liabilities. What remains to be seen is for how long the concerns of the global financial markets will remain on hold (see No. 777).
· Monetary malfeasance by the Federal Reserve, as seen in central bank efforts to provide liquidity to a troubled banking system, and also to the U.S. Treasury. Despite the end of the Federal Reserve’s formal asset purchases, the U.S. central bank monetized 78% of the U.S. Treasury’s fiscal-2014 cash-based deficit (see Commentary No. 672). The quantitative easing QE3 asset purchase program effectively monetized 66% of the total net issuance of federal debt to be held by the public during the productive life of the program (beginning with the January 2013 expansion of QE3). The 2014 monetization process was completed with the Federal Reserve refunding the interest income it earned on the Treasury securities to the U.S. Treasury, but more of that lies ahead. As has been commonplace, the Fed likely will seek political cover for any new or expanded systemic accommodation in the intensifying economic distress.
· Mounting domestic and global crises of confidence in a dysfunctional U.S. government. The positive rating by the public of the U.S. President tends to be an indicative measure of this circumstance, usually with a meaningful correlation with the foreign-exchange-rate strength of the U.S. dollar. The weaker the rating, the weaker tends to be the U.S. dollar. The positive rating for the President is off its historic low, but still at levels that traditionally are traumatic for the dollar. Chances of a meaningful shift towards constructive cooperation between the White House and the Congress in addressing fundamental fiscal and economic issues are nil. Issues such as non-recovered, faltering economic activity, the consumer liquidity crisis and the nation’s long-range solvency issues should continue to devolve into extreme political crises in the year ahead.
· Mounting global political pressures contrary to U.S. interests. Downside pressures on the U.S. currency are intensifying, or sitting in place, in the context of global political and military developments contrary to U.S. strategic, financial and economic interests. Active efforts or comments against the U.S. dollar also continue to expand. In particular, anti-dollar rhetoric and actions have been seen with Russia, China, France, India and Iran, along with some regular rumblings in OPEC and elsewhere. The process moved forward recently with the Chinese yuan gaining global reserve currency status as of October 2016. Where recent dollar strength may have bought some time versus those who have to hold dollars for various reasons. Nonetheless, developing short-term global financial instabilities and a quick, significant reversal in the dollar’s strength should intensify the “dump-the-dollar” rhetoric rapidly.
Both the renewed dollar weakness and the resulting inflation spike should boost the prices of gold and silver, where physical holding of those key precious metals remains the ultimate hedge against the pending inflation and financial crises. Investors need to preserve the purchasing power and liquidity of their wealth and assets during the hyperinflation crisis ahead. See Chapter 10, 2014 Hyperinflation Report—Great Economic Tumble for detailed discussion on approaches to handing the hyperinflation crisis and No. 777, for other factors afoot in the current environment.
__________
REPORTING DETAIL
GROSS DOMESTIC PRODUCT—GDP (Fourth-Quarter 2015, “Advance” or First Estimate)
Gross Domestic Product—Within Striking Distance of a Headline GDP Contraction. [Most of the text in next five paragraphs is repeated from the Opening Comments.] The “advance” estimate of 0.69% annualized growth in real fourth-quarter 2015 Gross Domestic Product (GDP) was no more than statistical noise. Simply put, there was no statistically-significant difference between the “advance” headline quarterly gain and an outright quarterly contraction. An outright contraction likely looms in the first revision.
Given the accelerating downside trend in most near-term, headline economic reporting, including the durable goods orders detailed in yesterday’s No. 782, the consensus outlook for broad economic activity should be shifting rapidly to the downside. Negative expectations for the first revision to fourth-quarter GDP on February 26th, and the actual reporting of same should follow.
Discussed frequently, the GDP does not reflect properly or accurately the changes to the underlying fundamentals that drive the economy. Underlying real-world economic activity has shown that the broad economy began to turn down in 2006 and 2007, plunged into 2009, entered a protracted period of stagnation thereafter—never recovering—and then began to turn down anew in the last year.
The GDP simply remains the most worthless of the popular government economic series, in terms of determining what really is happening to U.S. business activity. The series is the most heavily-modeled, politically-massaged and gimmicked government indicator of the economy. It has been so since at least the days when President Lyndon Johnson reportedly reviewed the numbers before their release, and then would return them to the Commerce Department, if Commerce had gotten them “wrong,” and would keep doing so until Commerce got the numbers “right.”
Nonetheless, despite all the upside biases and gimmicks built into the GDP reporting, the real world occasionally surfaces in formal GDP estimates, and that is close, but still in the process of unfolding. With major monthly economic series such as retail sales, industrial production, durable goods orders and housing-market measures showing regular contractions, underlying reality has become weak enough, once again, for headline GDP, GNP and/or GDI to show an ongoing, formal “new” recession. That initial recognition likely looms within the now-unfolding reporting timeframe of the first-quarter 2016 GDP and its revisions.
__________________
Notes on GDP-Related Nomenclature and Definitions
For purposes of clarity and the use of simplified language in the text of the GDP analysis, here are definitions of several key terms used related to GDP reporting:
Gross Domestic Product (GDP) is the headline number and the most widely followed broad measure of U.S. economic activity. It is published quarterly by the Bureau of Economic Analysis (BEA), with two successive monthly revisions, and with an annual revision in the following July.
Gross Domestic Income (GDI) is the theoretical equivalent to the GDP, but it generally is not followed by the popular press. Where GDP reflects the consumption side of the economy and GDI reflects the offsetting income side. When the series estimates do not equal each other, which almost always is the case, since the series are surveyed separately, the difference is added to or subtracted from the GDI as a “statistical discrepancy.” Although the BEA touts the GDP as the more accurate measure, the GDI is relatively free of the monthly political targeting the GDP goes through.
Gross National Product (GNP) is the broadest measure of the U.S. economy published by the BEA. Once the headline number, now it rarely is followed by the popular media. GDP is the GNP net of trade in factor income (interest and dividend payments). GNP growth usually is weaker than GDP growth for net-debtor nations. Games played with money flows between the United States and the rest of the world tend to mute that impact on the reporting of U.S. GDP growth.
Real (or Constant Dollars) means the data have been adjusted, or deflated, to reflect the effects of inflation.
Nominal (or Current Dollars) means growth or level has not been adjusted for inflation. This is the way a business normally records revenues or an individual views day-to-day income and expenses.
GDP Implicit Price Deflator (IPD) is the inflation measure used to convert GDP data from nominal to real. The adjusted numbers are based on “Chained 2009 Dollars,” as introduced with the 2013 comprehensive revisions, where 2009 is the base year for inflation. “Chained” refers to the substitution methodology, which gimmicks the reported numbers so much that the aggregate of the deflated GDP sub-series missed adding to the theoretically-equivalent deflated total GDP series by $60.4 billion in “residual,” as of the second estimate of fourth-quarter 2014.
Quarterly growth, unless otherwise stated, is in terms of seasonally-adjusted, annualized quarter-to-quarter growth, i.e., the growth rate of one quarter over the prior quarter, raised to the fourth power, a compounded annual rate of growth. While some might annualize a quarterly growth rate by multiplying it by four, the BEA uses the compounding method, raising the quarterly growth rate to the fourth power. So a one percent quarterly growth rate annualizes to 1.01 x 1.01 x 1.01 x 1.01 = 1.0406 or 4.1%, instead of 4 x 1% = 4%.
Annual growth refers to the year-to-year change of the referenced period versus the same period the year before.
__________________
Gross Domestic Product (GDP). Published today, January 29th, by the Bureau of Economic Analysis (BEA), the first estimate of fourth-quarter 2015 GDP showed a statistically-insignificant, real (inflation-adjusted), annualized, quarterly headline gain of 0.69% +/- 3.5% (95% confidence interval). That was down from headline growth of 1.98% in third-quarter 2015 and 3.92% in second-quarter 2015 GDP, but it was minimally higher than first-quarter 2015 benchmarked gain of 0.64% [a pre-benchmark quarterly contraction of 0.17% (-0.17%)].
Graphs 13 and 15 plot the latest headline levels of real quarterly GDP activity, respectively showing short-term (since 2000) and long-term (since the historical onset of the quarterly GDP series in 1947) perspectives. Distribution detail of fourth-quarter 2015 GDP growth is outlined in the Opening Comments.
Shown in Graphs 14, 16 and 17, headline year-to-year real growth in fourth-quarter 2015 slowed markedly to 1.80%, the slowest annual growth in seven quarters, since the quarterly GDP contraction in first-quarter 2014. It was down from 2.15% in third-quarter 2015, from 2.72% in second-quarter 2015 and from 2.88% in first-quarter 2015.
In terms of annual-average real growth, 2015 GDP gained 2.38% versus 2014, where 2014 gained 2.43% versus 2013.
The latest quarterly year-to-year growth remained well below the near-term peak of 3.08% in third-quarter 2010. The current-cycle trough in annual change was in second-quarter 2009, reflecting a year-to-year decline of 4.09% (-4.09%). That was the deepest year-to-year contraction for any quarterly GDP in the history of the series, which began with first-quarter 1947 (1948 in terms of available year-to-year detail).
Graph 14 shows current year-to-year quarterly detail, from 2000-to-date, where Graph 16 shows the same series in terms of its full quarterly, year-to-year history back to 1948.
Graph 17 shows full annual-growth detail for 1940 to date.
[Graphs 13 to 17 begin on the following page]
Graph 13: Quarterly GDP in Billions of 2009 Dollars (2000 to Fourth-Quarter 2015)

Graph 14: Quarterly GDP Real Year-to-Year Change (2000 to Fourth-Quarter 2015)

Graph 15: Quarterly GDP in Billions of 2009 Dollars (1947-2015)

Graph 16: Quarterly GDP Real Year-to-Year Change (1948-2015)

Graph 17: Annual-Average GDP Real Percent Change (1930-2015)

Implicit Price Deflator (IPD). As general guidance, the weaker the inflation rate used in deflating an economic series, the stronger will be the resulting inflation-adjusted growth. The first estimate of fourth-quarter 2015 GDP inflation, or the implicit price deflator (IPD), was an annualized quarterly increase of 0.82%, versus 1.30% in third-quarter 2015, versus 2.13% in second-quarter 2015 and a benchmarked gain of 0.12% in the first-quarter 2015.
Year-to-year, fourth-quarter 2015 IPD was 1.08%, versus 0.90% in third-quarter 2015, versus 0.98% in second-quarter 2015 and a benchmarked 1.01% annual gain in first-quarter 2015.
In terms of annual average inflation, initial estimate of the 2015 IPD was 1.10%, versus 1.09% in 2014.
For purposes of comparison, headline CPI-U inflation (Bureau of Labor Statistics), showed an annualized, seasonally-adjusted, quarter-to-quarter gain of 0.23% in fourth-quarter 2015, versus a gain of 1.58% in third-quarter 2015, versus a gain of 2.98% in second-quarter 2015 and a contraction of 3.01% (-3.01%) in first-quarter 2015. Unadjusted, year-to-year quarterly CPI-U inflation showed a year-to-year fourth-quarter 2015 gain of 0.73%, versus a third-quarter 2015 gain of 0.11%, versus a second-quarter 2015 annual contraction of 0.04% (-0.04%) and a year-to-year decline of 0.10% (-0.10%) in first-quarter 2015.
Annual average CPI-U inflation in 2015 was 0.12% versus 1.62% in 2014.
Gross National Product (GNP). The initial estimate of fourth-quarter 2015 GNP will not be published until March 25th, given data-quality issues, a problem common with the headline GDP. Gross National Product (GNP) is the broadest measure of U.S. economic activity, where GDP is GNP net of trade flows in factor income (interest and dividend payments). As a reporting gimmick aimed at boosting the headline reporting of economic growth for net-debtor nations such as Greece and the United States, international reporting standards were shifted some decades back to reporting headline GDP instead of GNP. The unrevised, headline third-quarter 2015 annualized real growth was 1.35%, versus 3.92% in second-quarter 2015 and an annualized contraction of 0.15% (-0.15%) in first-quarter 2015.
Gross Domestic Income (GDI). The initial estimate of fourth-quarter 2015 GDI will not be published until March 25th, given data-quality issues, a problem consistent with the headline GDP. Gross Domestic Income (GDI) is the theoretical income-side equivalent of the consumption-side GDP estimate. The GDP and GDI are made to equal each other, every quarter, with the addition of a “statistical discrepancy” to the GDI-side of the equation, but the discrepancy just as easily could be added to the GDP number. The unrevised headline third-quarter 2015 annualized real growth was 2.66%, versus 2.20% in second-quarter 2015 and 0.42% in first-quarter 2015.
ShadowStats-Alternate GDP. The ShadowStats-Alternate GDP estimate for fourth-quarter 2015 GDP is a year-to-year contraction of 1.7% (-1.7%) versus the softening annual gain of 1.8% seen in the headline number. Such was against a ShadowStats estimate of a 1.4% (-1.4%) annul decline in third-quarter 2015, versus the official third-quarter GDP year-to-year gain of 2.1% (see the Alternate Data tab).
While the annualized, real quarterly growth rate is not estimated formally on an alternate basis, the headline 0.7% annualized quarter-to-quarter gain in fourth-quarter 2015 was much weaker, net of all the happy assumptions and regular reporting gimmicks coming into today. It still should revise lower in next month’s reporting, into an outright quarterly contraction. Actual quarterly contractions appear to have been a realistic possibility for inflation-adjusted GDP in most quarters since the official, second-quarter 2009 end to the 2007 recession.
Adjusted for understated inflation and other methodological changes—such as the inclusion of intellectual property, software and recent accounting for the largely not-measurable and questionable impact of the Affordable Care Act (ACA)—the business collapse that began in 2006/2007 is ongoing; there has been no meaningful economic rebound. The “corrected” real GDP graph, and the longer-term “corrected” graph (see Graphs 2 and 4), updated from 2014 Hyperinflation Report—Great Economic Tumble – Second Installment (see also the Opening Comments section), are based on the removal of the impact of hedonic quality adjustments that have reduced the reporting of official annual GDP inflation by roughly two-percentage points. It is not the same measure as the ShadowStats-Alternate GDP, here, which reflects reversing additional methodological distortions (“Pollyanna Creep”) of recent decades.
__________
WEEK AHEAD
Economic Reporting Should Continue Trending Weaker than Expected, Well into 2016 Reporting; Inflation Should Rise Anew—Along with Oil Prices—in Response to a Weakening Dollar. Fluctuating increasingly to the downside, amidst intensifying, negative headline reporting, market expectations for business activity nonetheless still gyrate with the latest economic hype in the popular media. That effect helps to hold the consensus outlook at overly-optimistic levels, with current expectations still exceeding underlying reality. Along with the broad trend in weakening expectations, however, movement towards looming recession recognition continues at an accelerating pace, as discussed in the Opening Comments and in No. 777 Year-End Special Commentary.
Headline reporting of the regular monthly economic numbers increasingly should weaken in the weeks and months ahead, along with much worse-than-expected reporting for at least the next several quarters of GDP (and GDI and GNP), for fourth-quarter 2015 and well into 2016. That includes mounting odds for an eventual outright quarterly contraction in fourth-quarter 2015 GDP activity, as well as pending downside revisions to recent GDP history in the 2016 annual benchmark revision, due on July 29th (see the Opening Comments).
CPI-U consumer inflation—intermittently driven lower this year by collapsing prices for gasoline and other oil-price related commodities—likely has seen its near-term, year-to-year low. Annual CPI-U turned minimally positive in June 2015, for the first time in six months, notched somewhat higher in July and August, with a minimal fallback in September, tied to renewed weakness in gasoline prices. With positive seasonal adjustments countering some of the monthly weakness in gasoline prices, combined with particularly weak headline inflation one year ago, headline November 2015 CPI-U annual inflation rose to 0.5%, with annual inflation up to 0.7% in December. The potential for some pullback in January CPI inflation, however, was discussed in No.781. Separately, fundamental reporting issues with the CPI are discussed here: Public Commentary on Inflation Measurement.
Despite heavily-negative price pressure from oil-supply circumstances, at present, significant inflation pressures still should mount anew, at such time as oil prices rebound. That process should accelerate, along with a pending sharp downturn in the exchange-rate value of the U.S. dollar. Those areas, the general economic outlook and longer range reporting trends were reviewed broadly, most recently, in No. 777 Year-End Special Commentary in complement to No. 742 Special Commentary: A World Increasingly Out of Balance, No. 692 Special Commentary: 2015 - A World Out of Balance and the 2014 Hyperinflation Reports: The End Game Begins and Great Economic Tumble.
Note on Reporting-Quality Issues and Systemic-Reporting Biases. Significant reporting-quality problems remain with most major economic series. Beyond the pre-announced gimmicked changes to reporting methodologies of the last several decades, which have tended to understate actual inflation and to overstate actual economic activity, ongoing headline reporting issues are tied largely to systemic distortions of monthly seasonal adjustments. Data instabilities—induced partially by the still-evolving economic turmoil of the last eight-to-ten years—have been without precedent in the post-World War II era of modern-economic reporting. The severity and ongoing nature of the downturn provide particularly unstable headline economic results, when concurrent seasonal adjustments are used (as with retail sales, durable goods orders, employment and unemployment data, discussed and explored in the labor-numbers related Commentary No. 695).
Separately, discussed in Commentary No. 778, a heretofore unheard of spate of “processing errors” has surfaced, currently involving surveys of earnings and construction spending. This is suggestive of deteriorating internal oversight and control of the U.S. government’s headline economic reporting. At the same time, it indicates an openness of the involved statistical agencies in revealing the reporting-quality issues. Combined with recent allegations of Census Bureau falsification of data in its monthly Current Population Survey (the source for the Bureau of Labor Statistics’ Household Survey), these issues have thrown into question the statistical-significance of the headline month-to-month reporting for many popular economic series (see Commentary No. 669).
PENDING RELEASES:
Construction Spending (December 2015). The Commerce Department will release its estimate of December 2015 construction spending on Monday, February 1st. The detail will be covered in ShadowStats Commentary No. 784 of Friday, February 5th.
As usual, headline monthly changes here should not be statistically-significant, while previous data will be subject to large and irregular revisions. Irrespective of almost perpetually-positive market expectations for this series, the detail should continue in down-trending stagnation, net of inflation.
In what will have mixed impact on nominal (not-inflation-adjusted) growth, relative to real (inflation-adjusted) growth, related inflation (PPI – Final Demand Construction) was unchanged at 0.00% month-to-month, but rose by 1.88% year-to-year for September 2015, on a seasonally-adjusted basis, consistent with the headline construction-spending number.
U.S. Trade Balance (December 2015). The Commerce Department and Bureau of Economic Analysis (BEA) will release their full version of the monthly U.S. trade balance for December 2015 on Wednesday, February 3rd, updating the limited and questionable “advance” December merchandise trade detail published this morning (January 29th). The detail will be covered in ShadowStats Commentary No. 784 of Friday, February 5th.
Based on the “advance” detail, the December trade shortfall widened minimally versus a somewhat-narrowed November deficit. The “advance” numbers, however, have little obvious relationship to the “final” numbers published the next week. An assessment of potential revision impact on the headline fourth-quarter GDP will follow in the February 5th analysis. The broad trend going forward should remain for regular monthly and quarterly deteriorations in the real trade deficit.
Employment and Unemployment (January 2016), 2015 Payroll Employment Benchmarking. The Bureau of Labor Statistics (BLS) will publish its January 2016 labor data on Friday, February 5th, along the 2015 benchmark revision to payroll employment. Both employment and the broader unemployment numbers are open for negative, headline surprises, given the ongoing, general weakening tone in a number of business indicators other than headline unemployment. That said, the payroll benchmark revision potentially opens the headline payroll reporting to whatever the BLS would like to show.
Established monthly distortions to payroll employment (excessive upside biases, and publishing irregularities with the concurrent-seasonal-factor process) continue, though, as do the regular monthly distortions to headline unemployment (definitional issues with “discouraged workers,” and publishing irregularities with the concurrent-seasonal-factor process).
Underlying economic fundamentals continue to suggest slowing or negative month-to-month growth in headline payrolls, as well as deterioration in the broader unemployment rates such as U.6 and the ShadowStats Alternate Unemployment Measure.
Already at an Artificially-Low U.3. As seen with the reduction in the narrow, headline U.3 unemployment rate in recent months and years, any meaningful further narrowing of the headline December unemployment rate likely would encompass more unemployed being redefined off the headline unemployment rolls and out of the headline labor force, than the number of unemployed gaining new employment.
Implied, Weak Monthly Trend in Payroll Employment. As published previously by ShadowStats-affiliate www.ExpliStats.com, in its analysis of the biases built into the BLS’s concurrent-seasonal-factor modeling of the December 2015 payroll-employment reporting, the built-in-bias trend for January 2015 is for a headline monthly employment gain of 223,000 (see Commentary No. 779). Consensus forecasts usually settle-in near the trend level, although early-consensus indications are shy of that.
To the extent that underlying fundamentals continue to shine through all the regular monthly volatility and distortions, headline activity should continue to favor much weaker-than-expected payroll gains. Yet, again, anything is possible in the context of the annual benchmark revision.
Downside 2015 Payroll Benchmark Revision of 208,000 (-208,000) Purportedly Looms. The advance estimate of the 2015 benchmarking for payroll employment, announced on September 17th, indicated a downside revision of 208,000 (-208,000) jobs to the base March 2015 payroll employment levels (see Commentary No. 753).
As discussed in the Birth-Death Model section Commentary No. 779, though, initially-indicated downside revisions have ended up on the upside in recent years. Abuses from last year’s 2014 benchmarking are detailed in Commentary No. 694 and Commentary No. 695. With the headline benchmark revision for March 2014 showing understated payrolls of 67,000 (-67,000), the BLS upped its annual add-factor bias by an even greater 161,000 for the year ahead, to 892,000.
Separately, the BLS recently posted the following notice on its payroll employment homepage: “All employee hours and earnings data and related series from March 2006 through February 2009 for total private, private service-providing, education and health, membership associations and organizations and other services have been suppressed due to a data processing error introduced during the 2009 benchmark. Corrected data again will be available on February 5, 2016.”
All games aside, the benchmarking process should leave the payroll-employment environment looking somewhat weaker than it did pre-benchmarking.
__________