September 2008 - Poverty Report
Section Four
(View all Sections of this Issue)
Every year, the Census Bureau publishes one of the most important long-term leading indicators of broad economic activity: national income variance or household income dispersion, which continues at an extremely high level. Extreme highs in this measure foreshadow — usually by several years — major financial panics and economic depressions. The significant increases in this measure since the 1987 stock market panic help to explain the roots of the current systemic liquidity panic.
The Census Bureau’s Income, Poverty, and Health Insurance Coverage in the United States: 2007 was published in late August. I regularly ignore the heavily politicized reporting tied to poverty, because the highly theorized and massaged numbers have little relationship to or meaning in the real world. I do, however, look at the annual detail on reported income variance and income levels, which can be of significance. Some language and explanations here are repeated from prior annual analyses.
Without getting into broader philosophical issues, income variance is a long-term (multi-year) indicator of economic activity and financial system health. The more extreme the variance gets, the more income is concentrated at the top and bottom levels, instead of middle income levels, then the worse the economy and the financial markets eventually will become.

Consider two simplified populations, where in one instance $100,000,000 of income is divided among 10 households and second where it is divided among 1,000. There will tend to be more speculative financial markets in the first case, but more automobiles will be sold in the second case. The system tends to be self-adjusting when income variance reaches an extreme, with a speculative market bubble eventually bursting and income and economic activity tending to get redistributed.
As shown in the preceding graph, income dispersion remains near an historic high, well beyond any level estimated for before the onset of the Great Depression. The mean logarithmic deviation of income actually notched lower again, to .532 in 2007, from 0.543 in 2006 and the record-high 0.545 in 2005, but it remains on a high plateau, established in 2003.
Estimates of the pre-1929 peak variance were topped in the years before the 1987 stock crash, but the Treasury and the Federal Reserve took actions to prevent the system’s self-righting. The extreme increase in income dispersion that followed 1987 was thanks largely to the bubble policies of former Fed Chairman Greenspan, and, as noted in the September 2007 SGS newsletter, "it also has opened prospects of potentially unparalleled financial-market turmoil in the next several years."
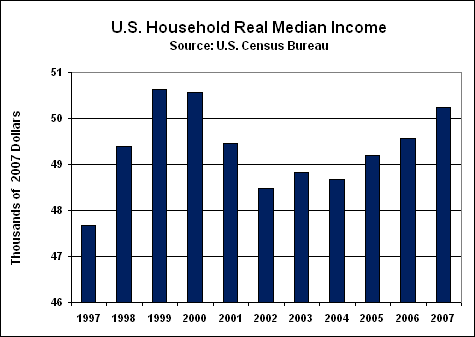
Also found in the Poverty Report are measures of household income. As shown in the next two graphs, real (inflation-adjusted) household income, as measured by the mean or average income, and the median income (the income level for the middle household in the survey), declined going into the 2000/2001 recession.


While neither series has recovered its pre-recession highs, mean household income already is falling anew, year-to-year, coming into the current recession. As will be explored in some depth in the next newsletter, the protracted structural recession currently restricting domestic business activity largely reflects the inflation-adjusted income for many households not keeping up with living expenses.
Keep in mind that these numbers are deflated using a particularly inadequate CPI measure, the CPI-U-RS, which has been restated historically by the Bureau of Labor Statistics so that earlier annual inflation has been adjusted to reflect the most-recent, inflation-dampening methodologies. The inflation-adjusted household income measures would be in consistent and deeper contraction, if deflated by SGS-alternate measures.
___________________________________________
PLEASE NOTE: The next SGS Newsletter currently is targeted for the week of October 19th. Intervening Flash Updates and Alerts will be posted in response to key economic or financial-market developments.
Earlier editions of the SGS writings referenced in the text can be found on the Archives tab at www.shadowstats.com.
Occasionally, important, brief updates are communicated directly by e-mail. If you are not receiving e-mail communications from us, please let us know at johnwilliams@shadowstats.com or by using the "Contact Us" option on www.shadowstats.com.
End of Section Four
(View all Sections of this Issue)